


The numbers of obese and diabetic patients are increasing year by year, and new experimental models are required to investigate the diverse aspects of these polygenic diseases, which are intimately linked in terms of aetiology. The pathogenesis of type 2 diabetes mellitus (T2DM) involves a progressive development of insulin resistance both in the peripheral tissues and in the liver, resulting in impaired insulin secretion from the pancreatic β-cells and hyperglycaemia(Reference Ahrén and Pacini1). T2DM is preceded by the metabolic syndrome(Reference Lau, Yan and Dhillon2), which is a group of conditions including dyslipidaemia, hyperglycaemia and obesity. Excessive accumulation of abdominal fat is a risk factor for T2DM(Reference Freemantle, Holmes and Hockey3) and is associated with dyslipidaemia and a rise in serum cortisol levels(Reference Purnell, Kahn and Samuels4). In order to improve our understanding of the mechanisms involved in the onset of obesity and insulin resistance, various rodent models have been developed based upon genetic susceptibility or chemical induction, for example(Reference Srinivasan and Ramarao5). Dietary manipulations in rodents have included high fat and/or carbohydrate administered either to the rodent itself(Reference Barnard, Roberts and Varon6, Reference Machado, Stefano and Oliveira7) or to its mother during pregnancy(Reference Armitage, Khan and Taylor8, Reference Nasu, Seki and Nara9). However, despite their widespread popularity and ease of induction, there are well-documented differences between the physiological changes induced by various different rodent T2DM models, such as differences in the pathogenesis of islet degeneration and the plasma insulin profile(Reference Nugent, Smith and Jones10). Care must be taken in the extrapolation of the results from rodent models to humans(Reference Srinivasan and Ramarao5), and larger animal models may be appropriate if they are shown to more accurately resemble the human pathology of obesity and type 2 diabetes.
Feline diabetes mellitus has been shown to closely resemble human T2DM in terms of clinical, pathological and physiological features(Reference Henson and O'Brien11, Reference Hoenig12). In common with humans, T2DM tends to develop spontaneously in middle-aged or older cats. Moreover, obesity is a risk factor for feline diabetes(Reference Crenshaw and Peterson13), and as with humans, overweight cats are becoming increasingly prevalent(Reference German14). A sedentary lifestyle, together with a highly energetic diet, is believed to fuel the human obesity epidemic(Reference Solomon, Sistrun and Krishnan15), and domestic cats increasingly occupy an indoor sedentary environment in which carbohydrates are consumed in the form of commercial cat diets(Reference Henson and O'Brien11). Further similarities between feline and human diabetes include the development of insulin resistance, hyperglycaemia and pancreatic islet cell lesions, together with partial loss of pancreatic β-cells(Reference Henson and O'Brien11, Reference Hoenig12, Reference Johnson, Hayden and O'Brien16).
Many studies of diet-induced obesity, T2DM and liver disease have focused on specific components common to the human diet, such as fructose(Reference Kelley, Allan and Azhar17), high-fructose corn syrup (HFCS) or equivalent(Reference Collison, Maqbool and Inglis18, Reference Tetri, Basaranoglu and Brunt19), trans-fat(Reference Tetri, Basaranoglu and Brunt19–Reference Dorfman, Laurent and Gounarides21) and the food flavour enhancer monosodium glutamate (MSG)(Reference Collison, Maqbool and Inglis18, Reference Collison, Maqbool and Saleh20, Reference von Diemen and Trindade22); all of which regularly occur in the so-called Western-style human diet. However, data on the effects of these dietary components on feline lipid homeostasis, plasma metabolite levels and glucose tolerance are relatively scarce. Thiess et al. (Reference Thiess, Becskei and Tomsa23) showed that a diet containing 29·2 % lard caused a significant rise in feline plasma TAG, NEFA, β-hydroxybutyrate (B-HBA) and cholesterol, together with a slightly elongated glucose clearance and reduced insulin response during a glucose tolerance test. Cats given a 40 % carbohydrate diet, however, did not show a similar pattern. A high-protein diet led to elevated postprandial amylin concentrations in cats, compared with high-carbohydrate or high-fat diets(Reference Martin, Siliart and Lutz24). To our knowledge, there are no published studies on the effect of dietary fructose, trans-fat or MSG in cats, despite the fact that cats express ketohexokinase, the enzyme that metabolises dietary fructose in the liver(Reference Springer, Lindbloon-Hawley and Schermerhorn25). Furthermore, diabetic cats have recently been reported to have a twelvefold increase in the neuronal accumulation of fructose compared with normal felines(Reference Mizisin, Shelton and Burgers26), making them a suitable model for the study of diabetic neuropathy.
Our aim was to compare the effects of four isoenergetic diets on weight gain, body fat, lipid profile, insulin sensitivity, adipokine, hormone and metabolite profile, together with glucose tolerance, in a feline model of diet-induced metabolic disturbance. We used a combination of partially hydrogenated vegetable shortening and HFCS to generate a high-fat–high-fructose diet. This diet was compared with an isoenergetic standard chow, either in the presence or absence of 1·125 % dietary MSG. We bred our study animals from female cats that were previously established on these diets for 3 weeks before mating, similar to our rodent models(Reference Collison, Maqbool and Inglis18, Reference Collison, Maqbool and Saleh20), since some of the effects of MSG are believed to occur only during the neonatal period(Reference Matysková, Maletínská and Maixnerová27–Reference Bunyan, Murrell and Shah29), and because developmental programming of the metabolic syndrome may be affected by maternal nutritional balance(Reference Armitage, Khan and Taylor8, Reference De Campos, Sinzato and Pimenta Wde30). Exposure to these diets occurred throughout the study, in order to mimic as closely as possible the situation that occurs in humans. In addition, our second aim was to examine the correlates of diet-induced weight and body fat change, lipid profile, cortisol and markers of liver dysfunction, in order to study early associations which may shed light on the mechanism of diet-induced metabolic dysregulation in a feline model.
Materials and methods
Cats and diets
A total of eight female domestic cats were used to breed eighteen male animals used in the present study. The breeding and care of the animals were in accordance with the protocols approved by the Animal Care and Use Committee of the King Faisal Specialist Hospital and Research Centre, and by the Institutional Animal Care Committees of Guelph University and CanCog Technologies. Commercially acceptable incandescent lighting was provided for the cats which were placed on a natural light cycle (lights on at 07.00 hours). Heating and cooling were electronically controlled and were set to maintain the room in a temperature range from 18 to 25°C. The room ventilation was designed to provide approximately fifteen filtered air changes per hour. Pen allocations for the cats provided each cat with a minimum of 0·56 m2 of personal space. The female breeders were between 2·0 and 5·0 years old and healthy based on physical examination and routine clinical laboratory data. Cats had free access to water and were fed twice daily. We used a combination of partially hydrogenated vegetable shortening and HFCS to generate a high-fat–high-fructose diet. The following four isoenergetic formulated diets (TestDiet®; Test Diets Purina, Richmond, IL, USA) were used in the present study: a standard chow (control) diet (catalogue no. 5003); diet A consisting of control diet with 1·125 % MSG (diet A: catalogue no. 5C1J); diet B containing 20 % partially hydrogenated vegetable shortening (8·6 % trans-fat) and 20 % HFCS (high-fat–high-fructose diet B, catalogue no. 5B4K); diet C containing 20 % partially hydrogenated vegetable shortening, 20 % HFCS and 1·125 % MSG (high-fat–high-fructose and MSG diet C, catalogue no. 5C1H). The diet composition is given in Table 1. The cats were fed twice per d for about 1 h. They were fed to meet their maintenance energy requirements (MER) estimated by the formula MER = 110 cal/d × (BW × 0·75)(Reference Laflamme31), where BW is the body weight (kg). Average MSG consumption as part of diets A and C was 201·4 (sem 18·65) mg/kg body weight. A preliminary diet acceptability study was performed on the breeder animals over a period of 1 week, to ascertain that the diets were palatable. Food consumption was monitored at every feed, and body weight was recorded at the beginning and end of the acceptability study. Female breeders (two animals per diet group) were established on each of the four different diets for 3 weeks before mating, and pregnant females continued on these diets throughout the gestation and weaning periods. Male animals bred for the study continued on these respective diets throughout the study and were fed twice daily. Food consumption was monitored at every feed, and body weight was monitored approximately every 14 d. Female kittens not included in the present study were adopted.
Table 1 Composition of the experimental diets
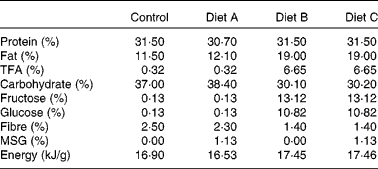
TFA, trans-fatty acids; MSG, monosodium glutamate.
Body composition and biochemical measurements
Total body scans were performed using dual-energy X-ray absorptiometry using the Lunar DPX-IQ densitometer (Lunar Corporation, Madison, WI, USA) to determine body composition, percentage of total body fat and bone mineral content at 3 months of age and, again, at 9 months. Pre-anaesthesia consisted of intramuscular atropine, and full anaesthesia induction was accomplished with intravenous propofol. Anaesthesia was maintained by intubation and isoflurane gas. Monitoring procedures during and after anaesthesia consisted of direct evaluation of respiration, heart rate, mucous membranes and intermittent auscultation. Total body scans on cats were performed in the paediatric small mode (Lunar Pediatric Software version 4.7e; GE Lunar, Madison, WI, USA). Body weight, percentage of fat, weight change and percentage of change in body fat were recorded. Body length was measured from the tip of the nose to the base of the tail in anaesthetised animals laid ventral side down, using a cloth tape. Clinical chemistry profiles, serum lipids, alkaline phosphatase, alanine transaminase, B-HBA and fasting serum insulin and glucose were assessed at 9 months of age. Samples for clinical chemistry and complete blood count were sent to Advance Vet Laboratories (Mississauga, ONT, Canada) for analysis. Serum TAG, total cholesterol, LDL-cholesterol and HDL-cholesterol concentrations were measured in the serum of 9-month-old fasted cats using the Reflovet Plus instrument (Roche, F. Hoffmann-La Roche Limited, Basel, Switzerland), according to the manufacturer's instructions. NEFA were measured in cat serum using the Half Micro Test (Roche Diagnostics GmbH, Mannheim, Germany). Hormone measurements were also assessed at 9 months of age in the serum of fasted cats. Insulin was measured using the feline insulin ELISA kit from Mercodia (Uppsala, Sweden; 10-1233-01), according to the manufacturer's instructions. Leptin and adiponectin were measured by ELISA using commercial assay kits (EZCL-31K; Millipore, Bedford, MA, USA and K1001-1 Otsuka Pharmaceuticals, Tokyo, Japan, respectively). Retinol-binding protein 4 was measured using the EZHRBP4-18K RBP4 ELISA kit (Millipore). Cortisol was measured using the 900-071 Cortisol ELISA kit from Assay Designs/Stressgen Bioreagents (Ann Arbor, MI, USA). Insulin-like growth factor 1 (IGF-1) was measured using the Mediagnost IGF-1 ELISA kit (IGFBP blocked; BioVendor LLC, Candler, NC, USA). Homeostatic model assessment index values, a measure of insulin resistance, were calculated according to the established formula: (fasting serum insulin (μIU/ml)) × (fasting serum glucose (mm))/22·5(Reference Matthews, Hosker and Rudenski32).
Intravenous glucose tolerance test
Glucose tolerance tests were performed when the cats were 9 months of age. Food was withheld for 12 h before testing. At least 1 h before testing, a cephalic catheter (20 gauge × 3·8 cm, manufactured by BD Medical, Mississauga, ONT, Canada) was placed under light physical restraint and patency maintained with 0·5 ml heparinised saline. If the catheter became non-patent, venepuncture was performed on the cats to obtain the samples. Then, 3ml samples of blood were drawn into SST-coated collection tubes before glucose administration (50 % (w/v) glucose solution, 2 ml glucose/kg body-weight baseline value at t = 0 min) and at 5, 10, 20 and 40 min after glucose injection. Blood samples were placed on ice, and the serum was separated by centrifugation at 2800 rpm for 10 min and frozen for subsequent analysis of glucose, insulin and NEFA, as detailed earlier.
Statistical analysis
All analyses were performed using SPSS software (version 13.0; SPSS, Inc., Chicago, IL, USA) and GraphPad InStat version 3 (San Diego, CA, USA). Data are presented as means with their standard errors of body weight, percentage of body fat, clinical chemistry, serum lipid profile and hormone measurements. Data were analysed by one-way ANOVA with Bonferroni's post hoc tests to determine statistical significance between selected diet groups. Significance was set at P < 0·05. Pearson's correlations were calculated to evaluate the association of variables listed in Table 2.
Table 2 Body characteristics, hormones, clinical chemistry and lipid profile in cats
(Mean values with their standard errors)

BMC, bone mineral content; IGF-1, insulin-like growth factor 1; HOMA-IR, homeostatic model assessment index; ALP, alkaline phosphatase; ALT, alanine transaminase; B-HBA, β-hydroxybutyrate; RBP4, retinol-binding protein 4; T-CHOL, total cholesterol.
Mean values were significantly different from those of the control: *P < 0·05, **P < 0·01, ***P < 0·001.
Mean values were significantly different from those of diet C: †P < 0·05, ††P < 0·01, †††P < 0·001.
Results
Body characteristics and growth hormone axis
Table 1 shows the diet composition. The average amount of the isoenergetic diets consumed was 71·61 (sem 8·38) g/d, with no significant differences between the four diets used in the study. At 3 months of age, there was no significant difference in adiposity and body weight (Table 2), but the percentage of weight gain and body-fat gain between 3 and 9 months of age in diet group A cats was 140 % higher than control levels (P < 0·05; Fig. 1(c) and (d) and Table 2). Percentage of fat and body-weight change in diet groups B and C were not significantly different from the control. There was a significant variation in body length at 9 months, with animals in diet group B obtaining 9 % less body length than the control; however, there was no apparent difference in bone mineral content and IGF-1 levels between the three diet groups compared with the control (Table 2).

Fig. 1 Effect of diet on body composition. (a) Body fat (g), (b) body weight (kg), (c) percentage of increase in body fat from 3 to 9 months of age and (d) percentage of change in body weight between 3 and 9 months of age in cats from the control diet (□, n 4), diet A (monosodium glutamate (MSG): ![]() , n 5), diet B (high fat–high fructose:
, n 5), diet B (high fat–high fructose: ![]() , n 4) and diet C (high fat–high fructose and MSG:
, n 4) and diet C (high fat–high fructose and MSG: ![]() , n 4) groups. Values are means, with standard errors represented by vertical bars. * Mean values were significantly different (P < 0·05).
, n 4) groups. Values are means, with standard errors represented by vertical bars. * Mean values were significantly different (P < 0·05).
Clinical chemistry, hormone and lipid profile
Creatinine levels in diet groups B and C were 1·5- and 1·4-fold elevated above control animals, and serum cortisol levels were similarly elevated in these two diet groups (1·4- and 1·5-fold, respectively, P < 0·001; Table 2). Levels of B-HBA were significantly increased in diet group C cats compared with the control (2·7-fold, P < 0·001; Table 2). Diet group B animals had twice the levels of serum alkaline phosphatase and alanine transaminase than diet group C (P < 0·001) animals, suggesting an impairment of liver function. Fasting insulin levels and homeostatic model assessment index values in diet group A cats were 2·4- and 3·1-fold greater than the control, suggesting the development of insulin resistance in these animals (P < 0·05 and P < 0·01; Tables 2 and 3, respectively). Serum leptin levels decreased by approximately fourfold in diet groups B and C, and diet group C animals had lower leptin and baseline fasting insulin levels than diet group A (P < 0·05; Tables 2 and 3, respectively) animals. Serum lipids were all within the normal range and did not differ significantly (Table 2). Other clinical chemistry markers are indicated in Table S1 of the supplementary material (available online at http://www.journals.cambridge.org/bjn).
Table 3 Glucose, insulin and NEFA parameters during an intravenous glucose tolerance test
(Mean values with their standard errors)

AUC, area under the curve; K, clearance rate; T 1/2, half-life.
Mean values were significantly different from those of the control: *P < 0·05, **P < 0·01.
Mean values were significantly different from those of diet C: †P < 0·05, ††P < 0·01, †††P < 0·001.
Intravenous glucose tolerance test
Fig. 2(a)–(c) shows mean serum glucose concentrations, insulin and NEFA levels, respectively, during a glucose tolerance test administered to the animals at 9 months of age. Areas under the curve (AUC), disappearance rates (K) and half-life (T 1/2) values are tabulated in Table 3. There was no difference in baseline (fasted) glucose levels (Fig. 2(a) and Table 3); however, after 40 min of intravenous glucose challenge, cats in diet groups B and C had significantly elevated serum glucose levels compared with the control (P < 0·05; Fig. 2(a)). The clearance rate of glucose (K glucose) was 158 % that of the control in diet group A cats, but only 44 % that of the control in diet group B cats (P < 0·05), suggesting a trend towards glucose intolerance in high-fat- and fructose-fed cats. Baseline insulin concentrations in diet group A cats were twice as high as controls and remained significantly elevated after 20 min of glucose challenge (P < 0·05; Fig. 2(b)). The AUC for insulin was 140 % that of the control in diet group A cats, but only 65 % that of the control values in diet group C cats (P < 0·0001; Table 3), suggesting impairment of first-phase insulin release in these animals. Cats in diet groups B and C also had fasting NEFA levels, which were 152 % elevated above the control (overall significance P = 0·02; Table 3). The AUC for NEFA were also greater in these two diet groups compared with the control.

Fig. 2 Intravenous glucose tolerance test in 9-month-old cats. (a) Mean plasma glucose (b) insulin and (c) NEFA levels in response to an oral glucose load in cats from the control diet (![]() ), diet A (monosodium glutamate (MSG),
), diet A (monosodium glutamate (MSG), ![]() ), diet B (high fat–high fructose,
), diet B (high fat–high fructose, ![]() ) and diet C (high fat–high fructose and MSG,
) and diet C (high fat–high fructose and MSG, ![]() ) groups. Mean values were significantly different: * P < 0·05, ** P < 0·01, *** P < 0·001.
) groups. Mean values were significantly different: * P < 0·05, ** P < 0·01, *** P < 0·001.
Correlates of body characteristics, lipid and hormone profiles
Pearson's correlation analysis was performed on the variables detailed in Table 2. The percentage of body-fat increase was strongly correlated with body-weight increase, TAG and leptin (r 0·84, 0·79 and 0·76, respectively, P < 0·001; Table 4). Serum leptin showed an inverse relationship to creatinine, cortisol and NEFA. Cortisol correlated with B-HBA, NEFA, creatinine and adiponectin (Table 4), and IGF-1 showed positive associations with 9-month body weight, bone mineral content and fasting insulin.
Table 4 Pearson's correlation coefficients between percentage of body fat, leptin, cortisol, insulin-like growth factor 1 (IGF-1) and bone mineral content (BMC)

B-HBA, β-hydroxybutyrate; BMC, bone mineral content; IGF-1, insulin-like growth factor 1.
* P < 0·05, ** P < 0·01, *** P < 0·001.
Discussion
The present results suggest that dietary manipulation prenatally and over the first 9 months of life can markedly affect normal metabolism. MSG invoked a phenotype of increased weight gain, adiposity and elevated insulin levels, together with a significantly higher AUCinsulin. A combination of high-fat and -fructose feeding resulted in elevated cortisol and markers of liver dysfunction, whereas the combination of all three dietary constituents resulted in significantly lower insulin levels, together with markers of metabolic ketosis. The present results with MSG are interesting when compared with previous observations in rodents, which show that neonatal administration of MSG, usually by injection shortly after birth, results in an obese phenotype in adulthood, accompanied by hyperinsulinaemia, consistent with the development of insulin resistance(Reference Matysková, Maletínská and Maixnerová27–Reference Bunyan, Murrell and Shah29). The mechanism in rodents appears to be due to partial or complete destruction of the N-methyl-d-aspartate receptor-rich arcuate nucleus. It is now apparent that maternal administration of MSG may penetrate the placental barrier and distribute to the embryonic tissues of the fetus. Oral administration of MSG and 3H-labelled glutamate to pregnant mice resulted in marked elevations of 3H-labelled glutamate in the placenta and in the fetal brain, liver and kidney(Reference Yu, Zhao and Shi33). Furthermore, injections of MSG in pregnant mice using 3H-labelled glutamate as a tracer have been shown to result in cytopathological damage to the fetal arcuate nucleus and ventromedial nucleus of the hypothalamus(Reference Gao, Wu and Zhao34). Moreover, maternal exposure to MSG has been demonstrated to result in obesity and brain lesions(Reference Inouye and Murakami35), together with behavioural changes in the offspring, including learning disabilities(Reference Frieder and Grimm36, Reference Frieder and Grimm37), which could be reversed by co-administration of sodium ferulate(Reference Yu, Zhang and Ma38). The ability of sodium ferulate to protect against MSG-induced apoptosis of neuronal cells appears to occur via prevention of the glutamate-induced decrease in the activity of the phosphatidylinositol 3-kinase (PI3K/Akt) and the mitogen-activated protein kinase kinase (MEK/ERK1/2) signalling pathways, and also through inhibition of the down-regulation of glutamate-induced Bcl-2 protein expression(Reference Jin, Yan and Fan39).
Much less is known about feline glutamate metabolism. In common with dogs and rabbits, glutamate is rapidly absorbed from the feline intestine(Reference Neame and Wiseman40). [3H]Glutamate has been shown to bind specifically to the feline central nervous system under physiological conditions of pH and temperature(Reference Head, Tunnicliff and Matheson41), and hypothalamic lesions were demonstrated to occur in kittens injected intravenously with glutamate(Reference Tanaka, Shimada and Nakao42). Electrolytic destruction of the posterior commissure and the commissure of the inferior colliculus in cats was shown to result in hyperphagia and weight gain(Reference Skultety43). Conversely, bilateral lesions to the ventral hypothalamus resulted in decreased energy intake and marked weight loss. Further experiments in cats have shown that destruction of the feline hypothalamic nucleus semilunaris accessories rendered the hypothalamic nucleus entopeduncularis neurons unresponsive to glucose and insulin(Reference Emmers44). In common with humans, cats with the largest percentage of body fat also had the lowest insulin sensitivity and the greatest increase in basal insulin concentrations with weight gain in a study by Appleton et al. (Reference Appleton, Rand and Sunvold45). The present results also showed that in common with obese cats(Reference Appleton, Rand and Sunvold45), MSG-treated cats with increased adiposity also had higher AUC for insulin during an intravenous glucose tolerance test.
The combination of high-fat and -fructose feeding (diet B) resulted in a reduction of serum leptin and an increase in serum creatinine and cortisol. Impaired glucose metabolism was suggested by a reduced glucose clearance rate after an intravenous glucose tolerance test. Commercial extruded cat diets are high in carbohydrates(Reference Backus, Puryear and Crouse46), usually maize-based, and cats express the hepatic enzyme necessary to metabolise fructose(Reference Springer, Lindbloon-Hawley and Schermerhorn25). Impaired glucose tolerance, together with reduced adiposity and markers of liver damage, has recently been reported in trans-fat-fed mice(Reference Machado, Stefano and Oliveira7). High-fat and -fructose diets are frequently used to induce T2DM in animal models(Reference Huang, Chiang and Yao47), and in rodents, it is believed that dietary fructose contributes to the development of hyperinsulinaemia(Reference Zavaroni, Sander and Scott48), whereas high-fat feeding impairs rodent pancreatic insulin secretion(Reference Ahrén, Gudbjartsson and Al-Amin49), contributing to the induction of glucose intolerance. A comparison of the effect of high-fat and high-carbohydrate diets on feline glucose tolerance suggested that the high fat component was responsible for perturbations found in the clearance of glucose and was more effective in raising serum B-HBA levels(Reference Thiess, Becskei and Tomsa23). Fructose- and HFCS-fed rodents have recently been demonstrated to have elevated alanine transaminase levels, suggesting the initiation of liver dysfunction(Reference Figlewicz, Ioannou and Bennett Jay50). High-fat and -fructose feeding has been shown to precipitate non-alcoholic fatty liver disease(Reference Aragno, Tomasinelli and Vercellinatto51), and trans-fat feeding raised murine serum alanine transaminase levels(Reference Koppe, Elias and Moseley52); however, information on the aetiology of feline hepatic lipidosis is relatively scarce.
The combination of high fat and fructose plus MSG (diet C) resulted in significantly lower fasting insulin levels, together with a lowered first-phase insulin release during the intravenous glucose tolerance test, even though glucose levels remained in the normal range. It has previously been shown in cats rendered progressively diabetic by treatment with growth hormone and dexamethasone that glucose levels during an intravenous glucose tolerance test remained in the normal range even when the first-phase insulin response had diminished by roughly fivefold(Reference Hoenig, Hall and Ferguson53). Diet C also raised serum B-HBA, cortisol, alkaline phosphatase and NEFA levels, which may point to the early development of ketosis in this diet group, despite the fact that fasting glucose levels were similar to the control, and all parameters studied fell within the normal reference range for cats. The exact mechanism whereby this combination of MSG and high fat–fructose resulted in a different phenotype than either one alone remains to be fully established. One possibility is that although both diets B and C had increased fat and fructose content, resulting in higher fasting NEFA levels, the diet C combination may have altered feline metabolism, precipitating a switch in hepatic metabolism to ketogenesis in these hypoinsulinaemic animals. B-HBA is a product of fatty acid oxidation in the liver, and elevated lipid peroxidation was demonstrated in MSG-treated rodents fed a hyperenergetic diet compared with animals given the hyperenergetic diet in the absence of MSG treatment(Reference Diniz, Fernandes and Campos54). Additionally, neonatal injections of MSG were shown to alter cafeteria diet-induced thermogenesis compared with saline-treated controls fed the same energy-rich diet, resulting in a significant weight gain in the cafeteria-MSG-treated mice compared with cafeteria-saline-treated controls(Reference Moss, Ma and Cameron55). Diet group C cats also had low levels of serum leptin in addition to insulin. The low levels of leptin found in diabetic ketoacidotic patients have been shown to be rapidly restored upon insulin infusion(Reference Kitabchi and Umpierrez56). Interestingly, these patients also had higher levels of cortisol, B-HBA and NEFA than the controls.
We have also examined correlations between feline body characteristics, hormones, metabolites and serum lipid components irrespective of the different dietary regimens employed. In particular, leptin correlated strongly with percentage of body fat, serum TAG and weight change, confirming previous observations that human leptin correlates with fat mass(Reference Fors, Matsuoka and Bosaeus57) and the waist:hip ratio correlates with serum TAG(Reference Zwiauer, Widhalm and Kerbl58), both in children. Additionally, we have found an inverse relationship between feline leptin and cortisol levels similar to that reported in humans(Reference Carlson, Saeed and Little59), supporting the notion that cats closely resemble humans in several aspects of physiology. In the present study, we also noted a further correlation between serum IGF-1 and insulin levels. This is in agreement with the findings of Kawachi et al. (Reference Kawachi, Takeda and Sasaki60) who speculated that circulating levels of both hormones could be determined by common nutritional and other causal factors, thus allowing for the possibility that diet-induced elevations in circulating IGF-1 may lead to increased adiposity, which in turn could result in hyperinsulinaemia.
The present study has some limitations. First, the group sizes were small, which reduced the power of the study and may have precluded other differences emerging as significant. On the other hand, we were able to demonstrate statistically significant diet-induced metabolic effects between the four diet groups. Second, we did not separate the effects of high fat from those of high fructose; however, we were able to show that dietary manipulation in these cats results in the development of metabolic characteristics shared by obesity and diabetes, using this model. Third, the length of the present study may limit its potential; however, our data suggest that further research in this area is warranted, and it would be of interest to see if the metabolism of the high-fructose/fat/MSG diet groups would change if they reverted to a control diet. It would also be pertinent to ascertain whether concomitant administration of sodium ferulate might alter feline metabolism in response to these diets, similar to its effect on MSG-treated rodents(Reference Yu, Zhang and Ma38, Reference Jin, Yan and Fan39).
In summary, the present study shows that dietary manipulation prenatally and over the first 9 months of life can affect feline weight gain, together with markers of insulin deregulation and metabolic dysfunction. Our analysis of the correlations between extent of feline adiposity, leptin and other metabolic parameters suggests a close similarity between feline and human metabolism with respect to these parameters, providing further evidence that these animals may make a suitable model for the examination of metabolic deregulation.
Acknowledgements
The present study was carried out in collaboration with CanCog Technologies, under the approval of the Animal Care and Use Committee of the King Faisal Specialist Hospital and Research Centre, and by the Institutional Animal Care Committees of Guelph University and CanCog Technologies. K. S. C., F. A. A.-M. and N. W. M. designed the study, interpreted the results and prepared the manuscript. J. B. oversaw all animal husbandry and on-site tests. S. M. S., A. I., R. M., N. J. M. and R. B. provided technical assistance, and M. Z. Z. performed the data analysis, figures and table preparation. Our gratitude goes to Mr Hakim Al-Enazi for his unparalleled help in coordinating research resources. The authors declare that they have no competing interests. The present study was supported by the RAC (no. 2060 037) and by the National Biotechnology Initiative (grant no. 08-MED-490-20).


