

Overweight and obesity in children and adolescents continue to be major public health concerns in many countries including the USA( Reference Ogden, Carroll and Kit 1 , Reference Ogden, Carroll and Kit 2 ). Excess body fatness has been shown to adversely affect children and adolescents by reducing their health-related quality of life( Reference Williams, Wake and Hesketh 3 , Reference Swallen, Reither and Haas 4 ), and is also associated with several risk factors for later chronic diseases( Reference Berenson, Srinivasan and Bao 5 , Reference Mahoney, Burns and Stanford 6 ). As established body fatness is difficult to treat successfully, investigation of modifiable lifestyle factors that influence body fatness in children and adolescents is a high public health priority.
A large number of epidemiological studies conducted among young populations have shown an inverse relationship between eating frequency (EF) – that is, the number of times per day a person eats, regardless of whether that eating occasion is designated as a meal or snack – and adiposity measures( Reference Ritchie 7 – Reference Kontogianni, Farmaki and Vidra 20 ), with some exceptions( Reference Thompson, Ballew and Resnicow 21 – Reference Murakami and Livingstone 26 ). However, the results should be interpreted cautiously with regard to methodological limitations. First, the assessment of EF has often relied on a series of self-report questions( Reference Barba, Troiano and Russo 9 , Reference Antonogeorgos, Panagiotakos and Papadimitriou 10 , Reference Cassimos, Sidiropoulos and Batzios 13 – Reference Neutzling, Taddei and Gigante 17 , Reference Toschke, Kuchenhoff and Koletzko 19 , Reference Ferreira and Marques-Vidal 23 ). Only a few studies have assessed EF on the basis of information on actual dietary behaviours (using dietary record or 24-h recall)( Reference Ritchie 7 , Reference Lioret, Touvier and Lafay 18 , Reference Thompson, Ballew and Resnicow 21 , Reference Murakami and Livingstone 26 ).
In addition, the relationships of EF with adiposity measures may be confounded by possible under-reporting of EF concomitant with the under-reporting of energy intake (EI) by obese or overweight subjects( Reference McCrory, Howarth and Roberts 27 , Reference Bellisle, McDevitt and Prentice 28 ). For example, one study found that when subjects with implausible EI were eliminated from the analytic sample, the inverse relation between EF and BMI percentile no longer existed( Reference Huang, Howarth and Lin 25 ). Further, interpreting the literature on EF is complicated by the fact that there is no consensus about what constitutes a snack, a meal or an eating occasion. Although some researchers have relied on respondents’ self-identification of meals, snacks or eating occasions( Reference Keast, Nicklas and O’Neil 8 – Reference Antonogeorgos, Panagiotakos and Papadimitriou 10 , Reference Cassimos, Sidiropoulos and Batzios 13 – Reference Toschke, Kuchenhoff and Koletzko 19 , Reference Ferreira and Marques-Vidal 23 , Reference Nicklas, Yang and Baranowski 24 ), others have attempted to use more objective criteria (based on clock time, energy content/contribution or both)( Reference Ritchie 7 , Reference Kontogianni, Farmaki and Vidra 20 – Reference Jennings, Cassidy and van Sluijs 22 , Reference Huang, Howarth and Lin 25 , Reference Murakami and Livingstone 26 ). As a consequence of these methodological limitations, more robust data analyses are needed to resolve this issue.
More importantly, potentially different effects of meal frequency (MF) and snack frequency (SF) have not been investigated simultaneously using different definitions of meals and snacks. An accurate distinction between meals and snacks is of importance, because they are hypothesised to have opposite effects on energy balance. A high MF may prevent fat mass deposition, whereas snacking may contribute to fat mass deposition( Reference Chapelot 29 ). This is also important for the development of science-based recommendations of meal and snack patterns for consumers( Reference Johnson and Anderson 30 ).
The aim of the present cross-sectional study in a representative sample of US children and adolescents based on the data from the National Health and Nutrition Examination Survey (NHANES) was to examine the relationship of EF, MF and SF with overweight and abdominal obesity, by focusing on the confounding of EI misreporting and the use of different definitions of eating occasions, meals and snacks.
Methods
Survey design and analytical sample
The present cross-sectional analysis was based on public domain data from NHANES, a continuing population-based survey that uses a complex, stratified, multistage probability sample design to create a representative sample of the non-institutionalised civilian US population( Reference Zipf, Chiappa and Porter 31 , Reference Johnson, Paulose-Ram and Ogden 32 ). The survey examines about 5000 persons each year, and data are released in 2-year cycles. The unweighted response rates for the examined persons aged 6–19 years for NHANES 2003–2004, 2005–2006, 2007–2008, 2009–2010 and 2011–2012 were 84, 83, 83, 86 and 77 %, respectively( 33 ). The NHANES protocol was approved by National Center for Health Statistics Research Ethics Review Board, and written informed consent was obtained from all participants or proxies. The documentation and data used for each of these surveys were downloaded from the NHANES website( 34 ).
For the present analysis, five survey cycles (i.e. 2003–2004, 2005–2006, 2007–2008, 2009–2010 and 2011–2012) were combined to produce estimates with greater precision and smaller sampling error. The analytical sample was limited to children and adolescents aged 6–19 years with data from two complete, reliable and self-reported 24-h dietary recalls, determined by the National Center for Health Statistics (n 11 719; the time interval between the two 24-h recalls was 3–10 d). After excluding pregnant (n 96) and lactating (n 15) respondents, as well as those with missing information on the variables of interest (n 924), the final analytic sample included 10 684 respondents from NHANES 2003–2012.
Anthropometric measurements
Body weight and height were measured by trained interviewers using standardised procedures with calibrated equipment. Waist circumference (WC) was measured by trained personnel with a soft tape placed horizontally just above the iliac crest at minimal respiration. BMI (kg/m2) was calculated as weight (kg) divided by height squared (m2). The percentile of BMI for age was calculated using SAS programme for growth charts available from the Centers for Disease Control and Prevention( Reference Kuczmarski, Ogden and Guo 35 , 36 ). Overweight (including obesity) was defined as BMI≥85th percentile of BMI for age. Abdominal obesity was defined as WC equal or above the sex- and age-specific 90th percentile based on data from NHANES III (1988–1994)( Reference Li, Ford and Mokdad 37 ).
Dietary assessment
All surveys collected dietary information using two 24-h dietary recalls. The first recall was conducted by face-to-face interviews, with the second recall being conducted by telephone 3–10 d after the first recall on a different day of the week (but not necessarily, e.g., 1 weekday and 1 weekend day). The dietary data were collected using an automated five-step multiple-pass approach – namely, the US Department of Agriculture Automated Multiple-Pass Method( 34 , Reference Moshfegh, Rhodes and Baer 38 – Reference Conway, Ingwersen and Moshfegh 41 ). Participants were asked to report the time each food and beverage was consumed and to classify each eating occasion from a pre-defined list of categories, which were used to define meals and snacks, as described later. Proxies, most commonly a parent, assisted with the dietary interview of children aged 6–11 years; dietary intake was self-reported by adolescents aged 12–19 years. Estimates of intakes of energy and selected nutrients from all reported foods and beverages were calculated using the US Department of Agriculture Food and Nutrient Database for Dietary Studies( 34 ). Values of nutrient intake were energy-adjusted using the density method (i.e. percentage of energy for energy-providing nutrients and amount per 4184 kJ of energy for dietary fibre).
Definitions of eating frequency, meal frequency and snack frequency
Data from the two 24-h dietary recalls were also used to calculate the mean number of eating occasions per day – that is, EF. Eating occasions were defined as any occasion when any food or drink was consumed( Reference Ritchie 7 , Reference Franko, Striegel-Moore and Thompson 12 , Reference Kontogianni, Farmaki and Vidra 20 , Reference Jennings, Cassidy and van Sluijs 22 , Reference Murakami and Livingstone 26 , Reference Hartline-Grafton, Rose and Johnson 42 – Reference Yannakoulia, Melistas and Solomou 44 ). In many previous studies, if two eating occasions occurred in ≤15 min, both events were counted as a single eating occasion; when >15 min separated two eating occasions, they were considered distinct eating occasions( Reference Kontogianni, Farmaki and Vidra 20 , Reference Thompson, Ballew and Resnicow 21 , Reference Murakami and Livingstone 26 , Reference Yannakoulia, Melistas and Solomou 44 , Reference Ma, Bertone and Stanek 45 ). In the present study, however, all foods and beverages reported at one discrete clock time were considered as part of one eating occasion, because almost all eating episodes (>99·5 %) occurred at least 15 min apart in NHANES( Reference Kant and Graubard 46 ). EF was calculated based on all eating occasions except for those providing <210 kJ of energy. This calculation method has been used in several previous studies( Reference Murakami and Livingstone 26 , Reference Hartline-Grafton, Rose and Johnson 42 – Reference Ma, Bertone and Stanek 45 , Reference Ruidavets, Bongard and Bataille 47 ) and was chosen to avoid giving undue weight to eating occasions that only included water, low-energy beverages or small quantity of foods. Use of differently calculated EF, that is, EF based on all eating occasions or EF based on all eating occasions except for those providing no energy, did not change the results (data not shown).
All eating occasions were divided into either meals or snacks using three different published definitions: on the basis of (1) contribution to total EI( Reference Ritchie 7 ), (2) self-reported name of eating occasion( Reference Kant and Graubard 46 ) and (3) clock time( Reference Jennings, Cassidy and van Sluijs 22 ). For the first definition( Reference Ritchie 7 ), a meal was defined as any eating episode comprising ≥15 % of total EI, regardless of the time of the day or composition of foods or beverages consumed. All other eating episodes were classified as a snack. For each participant, MF and SF determined based on percentage contribution to total EI were thus calculated (hereafter referred to as MFenergy% and SFenergy%, respectively). For the second definition( Reference Kant and Graubard 46 ), eating occasions with self-reported names such as ‘breakfast’, ‘brunch’, ‘lunch’, ‘supper’ and ‘dinner’ or their equivalents in Spanish were considered meals. All other self-reported eating events were considered as snacks. For each participant, MF and SF determined based on self-report were thus calculated. For the third definition( Reference Jennings, Cassidy and van Sluijs 22 ), meals were defined as eating events reported during select times of the day, that is, 06.00–09.00, 12.00–14.00 and 17.00–20.00 hours. All other eating occasions were considered snacks. For each participant, MF and SF determined based on the time consumed were thus calculated.
Assessment of non-dietary variables
Race/ethnicity was categorised as non-Hispanic white, non-Hispanic black, Mexican-American and others. As an indicator of socio-economic status, family poverty income ratio was considered (<130, 130–349 and ≥350 %). The physical activity variable was created as follows: for children aged 6–11 years, the responses to the question on the number of times per week that play or exercise was hard enough to induce sweat in the past 7 d (NHANES 2009–2012) or without a specified period (NHANES 2003–2008) were as follows – 0–3 times=low, 4–6 times=moderate and 7 times=active; for adolescents aged 12–19 years, the responses to two different questions on any leisure time moderate or vigorous activities lasting ≥10 min in the past 30 d (NHANES 2003–2006) or without a specified period (NHANES 2007–2012) were as follows – no to both the questions=low, yes to one question=moderate and yes to both two questions=active. The hours of screen time were determined from questions on television/video watching (h/d) or computer use (h/d) over the past 30 d (except for adolescents aged 12–19 years in NHANES 2007–2008 and 2009–2010 for which information on sedentary activity was used), which were categorised as <2, ≥2 to <4, ≥4 to <6 and ≥6 h/d.
Evaluation of energy intake reporting
Misreporting of EI was evaluated based on the ratio of EI:estimated energy requirement (EER). EER was calculated using sex-, age- and weight status-specific equations from the US Dietary Reference Intakes, based on sex, age, body height and weight, and physical activity( 48 ). Owing to a lack of an objective measure of physical activity in the present study, ‘low active’ level of physical activity (i.e. physical activity level ≥1·4 to <1·6)( 48 ) was assumed for all subjects during this calculation, based on accelerometer data from NHANES 2003–2006( Reference Troiano, Berrigan and Dodd 49 , Reference Belcher, Berrigan and Dodd 50 ).
Statistical analysis
Statistical analyses were performed for children aged 6–11 years (n 4346) and adolescents aged 12–19 years (n 6338) separately, using SAS statistical software (version 9.2, SAS Institute). The mean of the 2 d of dietary recalls was used for all dietary variables, rather than calculating usual intake, because, although statistical methods for estimating usual dietary intake are based on the assumption that the dietary assessment method (24-h dietary recall in this case) is an unbiased instrument for measuring food intake( Reference Tooze, Kipnis and Buckman 51 ), this seems violated in many cases at least for EF variables( Reference Huang, Howarth and Lin 25 – Reference Bellisle, McDevitt and Prentice 28 ). This approach has been used in several previous studies( Reference Leech, Worsley and Timperio 52 , Reference Murakami and Livingstone 53 ). All the analyses used the NHANES-provided sampling weights that were calculated to take into account unequal probabilities of selection resulting from the sample design, non-response and planned over-sampling of selected subgroups, so that the results are representative of the US community-dwelling population( Reference Johnson, Paulose-Ram and Ogden 32 , 54 ). For EF, MF and SF, sample-weighted means (with SE) were generated using PROC SURVEYMEANS procedure. Differences in these variables across categories of each of the characteristics were examined by Wald’s F test using PROC SURVEYREG procedure. Associations of EF, MF, SF and adiposity measures with EI and EI:EER were investigated by linear regression analyses using PROC SURVEYREG procedure. Linear regression and logistic regression analyses were performed to explore the associations of EF, MF and SF (independent variables) with measures of fatness (dependent variables). EF, MF and SF were analysed continuously after confirming the linearity of relations using tertile, quartile and quintile categories. Using the PROC SURVEYREG procedure, the adjusted regression coefficients (with SE) of variation of BMI percentile and WC by one increase in EF, MF and SF were calculated. In addition, using the PROC SURVEYLOGISTIC procedure, OR and 95 % CI for overweight and abdominal obesity per one increase in EF, MF and SF were calculated. The potential confounding factors considered (in model 1) were sex, age, race/ethnicity, family poverty income ratio, physical activity, watching television and computer use, survey cycle, protein intake, fat intake, total sugar intake and dietary fibre intake. EI:EER was further included as a potential confounding factor (in model 2). All reported P values are two-tailed, and P<0·05 was considered to be statistically significant.
Results
Dietary characteristics and adiposity measures of the subjects are presented in Table 1. EF, MF and SF were higher in children than in adolescents, irrespective of the definition applied. When compared with EER, EI was on average over-reported by 6 % in children but under-reported by 14 % in adolescents. There was no difference in the prevalence of overweight and abdominal obesity between children and adolescents. The correlations among three measures of MF were relatively weak in both children (Pearson’s r: 0·09–0·34) and adolescents (Pearson’s r: 0·24–0·40), whereas there were relatively strong correlations among three measures of SF in both children (Pearson’s r: 0·55–0·81) and adolescents (Pearson’s r: 0·55–0·79) (online Supplementary Table S1). All measures of MF and SF were positively correlated with EF, although the strength of the correlations varied (Pearson’s r ranging from 0·13 (MFenergy% in children) to 0·89 (SF based on self-report in children)).
Table 1 Dietary characteristics and adiposity measures of the subjects: National Health and Nutrition Examination Survey (NHANES) 2003–2012Footnote *(Mean values with their standard errors)

EF, eating frequency; MFenergy%, meal frequency (MF) determined based on percentage contribution to total EI; SFenergy%, snack frequency (SF) determined based on percentage contribution to total EI; MFself-report, MF determined based on self-report; SFself-report, SF determined based on self-report; MFtime, MF determined based on the time consumed; SFtime, SF determined based on the time consumed; EI, energy intake; EI:EER, ratio of EI:estimated energy requirement.
* All mean values are weighted to reflect the survey design characteristics. Analyses are based on subjects with complete data on two 24-h dietary recalls as well as complete information on the variables of interest. All dietary variables are based on average values of the two 24-h dietary recalls.
† P values for differences between children and adolescents based on independent t test.
‡ On the basis of all occasions except for those providing <210 kJ of energy.
§ A meal was defined as any eating episode comprising ≥15 % of total EI, regardless of the time of the day or composition of foods and beverages consumed; all other eating episodes were classified as snacks.
|| Self-reports of breakfast, brunch, lunch, supper and dinner or their equivalents in Spanish were considered as meals; all other self-reported eating events were considered as snacks.
¶ Meals were defined as eating events reported during select times of the day (06.00–09.00, 12.00–14.00 and 17.00–20.00 hours); all other eating occasions were considered as snacks.
** Including obesity. Defined as BMI ≥85th percentile of BMI for age according to growth charts available from the Centers for Disease Control and Prevention( Reference Kuczmarski, Ogden and Guo 35 , 36 ).
†† Defined as waist circumference equal or above the sex- and age-specific 90th percentile based on data from NHANES III (1988–1994)( Reference Li, Ford and Mokdad 37 ).
Associations of eating frequency, meal frequency and snack frequency with subjects characteristics
Table 2 shows EF, MFenergy% and SFenergy% (as examples) according to categories of subject characteristics. Although EF was higher in boys in both age groups, MFenergy% was higher in male children only and SFenergy% was higher in male adolescents only. For children, EF and SFenergy% were the highest in non-Hispanic whites and the lowest in non-Hispanic blacks. For adolescents, EF and SFenergy% were the highest in others, whereas MFenergy% was the highest in non-Hispanic whites, with the lowest values in non-Hispanic blacks. There were positive associations between family poverty income ratio and EF (adolescents only) and SFenergy%. All EF, MFenergy% and SFenergy% values were positively associated with physical activity in adolescents only. There were inverse associations between watching television and computer use and EF and SFenergy% in adolescents only. For survey cycle, only SFenergy% differed in adolescents, with the highest in 2003–2004 and the lowest in 2007–2008.
Table 2 Eating frequency (EF), meal frequency and snack frequency according to categories of subjects characteristics: National Health and Nutrition Examination Survey (NHANES) 2003–2012Footnote *(Mean values with their standard errors)
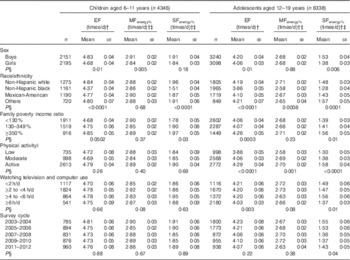
MFenergy%, meal frequency determined based on percentage contribution to total energy intake; SFenergy%, snack frequency determined based on percentage contribution to total energy intake.
* All mean values are weighted to reflect the survey design characteristics. Analyses are based on subjects with complete data on two 24-h dietary recalls as well as complete information on the variables of interest. All dietary variables are based on average values of the two 24-h dietary recalls.
† On the basis of all occasions except for those providing <210 kJ of energy.
‡ A meal was defined as any eating episode comprising ≥15 % of total energy intake, regardless of the time of the day or composition of foods and beverages consumed; all other eating episodes were classified as snacks.
§ P values for heterogeneity based on Wald’s F test.
|| The physical activity variable was created as follows. For children aged 6–11 years, the response to the question on the number of times per week that play or exercise was hard enough to induce sweating in the past 7 d (NHANES 2009–2012) or without a specified period (NHANES 2003–2008): 0–3 times=low, 4–6 times=moderate and 7 times=active. For adolescents aged 12–19 years, the responses to two different questions on any leisure time moderate or vigorous activities lasting ≥10 min in the past 30 d (NHANES 2003–2006) or without a specified period (NHANES 2007–2012): no to both two questions=low, yes to one question=moderate and yes to both two questions=active.
Associations of eating frequency, meal frequency, snack frequency and adiposity measures with energy intake and energy intake:estimated energy requirement
Associations of EF, MF, SF and adiposity measures with EI and EI:EER are presented in Table 3. All measures of EF, MF and SF were strongly and positively associated with both EI and EI:EER in both children and adolescents, with the exception of no association between MFenergy% and EI in children. Although BMI percentile and WC were positively associated with EI in children only, they were inversely associated with EI:EER in both children and adolescents.
Table 3 Associations of eating frequency (EF), meal frequency, snack frequency and adiposity measures with EI and EI:EER: National Health and Nutrition Examination Survey 2003–2012Footnote *(Regression coefficients (β) with their standard errors)
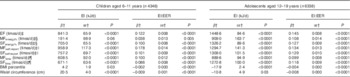
EI, energy intake; EI:EER, ratio of EI:estimated energy requirement; MFenergy%, meal frequency (MF) determined based on percentage contribution to total EI; SFenergy%, snack frequency (SF) determined based on percentage contribution to total EI; MFself-report, MF determined based on self-report; SFself-report, SF determined based on self-report; MFtime, MF determined based on the time consumed; SFtime, SF determined based on the time consumed.
* Analyses are based on subjects with complete data on two 24-h dietary recalls as well as complete information on the variables of interest. All dietary variables are based on average values of the two 24-h dietary recalls.
† Regression coefficients mean the change of EI or EI:EER with one additional unit of each dietary variable and adiposity measure.
‡ On the basis of all occasions except for those providing <210 kJ of energy.
§ A meal was defined as any eating episode comprising ≥15 % of total EI, regardless of the time of the day or composition of foods and beverages consumed; all other eating episodes were classified as snacks.
|| Self-reports of breakfast, brunch, lunch, supper and dinner or their equivalents in Spanish were considered as meals; all other self-reported eating events were considered as snacks.
¶ Meals were defined as eating events reported during select times of the day (06.00–09.00, 12.00–14.00 and 17.00–20.00 hours); all other eating occasions were considered as snacks.
Associations of eating frequency, meal frequency and snack frequency with adiposity measures
Table 4 shows the associations of EF, MF and SF with adiposity measures. After adjustment for potential confounding factors, except for EI:EER (model 1), all measures of EF, MF and SF showed inverse or null associations with BMI percentile and WC in both age groups. However, further adjustment for EI:EER (model 2) resulted in positive associations of EF with BMI percentile (children only) and WC. For MF, after full adjustment including EI:EER (model 2), there was no association in children, irrespective of the definition of meals, whereas only MFenergy% showed inverse associations in adolescents. After full adjustment (model 2), all measures of SF were positively associated with BMI percentile and WC in children, whereas only SFenergy% showed positive associations in adolescents.
Table 4 Associations of eating frequency (EF), meal frequency and snack frequency with adiposity measures: National Health and Nutrition Examination Survey 2003–2012Footnote *(Regression coefficients (β) with their standard errors)

MFenergy%, meal frequency (MF) determined based on percentage contribution to total energy intake; SFenergy%, snack frequency (SF) determined based on percentage contribution to total energy intake; MFself-report, MF determined based on self-report; SFself-report, SF determined based on self-report; MFtime, MF determined based on the time consumed; SFtime, SF determined based on the time consumed.
* Analyses are based on subjects with complete data on two 24-h dietary recalls as well as complete information on the variables of interest. All dietary variables are based on average values of the two 24-h dietary recalls.
† Adjusted for sex (boys or girls), age (years, continuous), race/ethnicity (non-Hispanic white, non-Hispanic black, Mexican-American or others), family poverty income ratio (<130, 130–349 or ≥350 %), physical activity (low, moderate or active), watching television and computer use (<2, ≥2 to <4, ≥4 to <6 or ≥6 h/d), survey cycle (2003–2004, 2005–2006, 2007–2008, 2009–2010 or 2011–2012), protein intake (percentage of energy, continuous), fat intake (percentage of energy, continuous), total sugar intake (percentage of energy, continuous) and dietary fibre intake (g/4184 kJ, continuous).
‡ Adjusted for variables used in model 1 and ratio of energy intake:estimated energy requirement (continuous).
§ Regression coefficients mean the change of adiposity measures with one additional eating occasion per day.
|| On the basis of all occasions except for those providing <210 kJ of energy.
¶ A meal was defined as any eating episode comprising ≥15 % of total energy intake, regardless of the time of the day or composition of foods and beverages consumed; all other eating episodes were classified as snacks.
** Self-reports of breakfast, brunch, lunch, supper and dinner or their equivalents in Spanish were considered as meals; all other self-reported eating events were considered as snacks.
†† Meals were defined as eating events reported during select times of the day (06.00–09.00, 12.00–14.00 and 17.00–20.00 hours); all other eating occasions were considered as snacks.
Associations of eating frequency, meal frequency and snack frequency with overweight and abdominal obesity
Associations of EF, MF and SF with overweight and abdominal obesity are shown in Table 5. When analysed without adjustment for EI:EER (model 1), all measures of EF, MF and SF showed inverse or null associations in both age groups. However, after adjustment for EI:EER (model 2), EF was positively associated with the risk of overweight (children only) and abdominal obesity. Although all measures of MF showed no associations, all measures of SF were associated with higher risks of overweight and abdominal obesity in children. The associations varied in adolescents, depending on the definition of meals and snacks. Although MFenergy% was associated with a lower risk of overweight, SFenergy% and MF based on self-report showed positive associations with both overweight and abdominal obesity.
Table 5 Associations of eating frequency (EF), meal frequency and snack frequency with overweight and abdominal obesity: National Health and Nutrition Examination Survey 2003–2012Footnote *(Odds ratios and 95 % confidence intervals)

MFenergy%, meal frequency (MF) determined based on percentage contribution to total energy intake; SFenergy%, snack frequency (SF) determined based on percentage contribution to total energy intake; MFself-report, MF determined based on self-report; SFself-report, SF determined based on self-report; MFtime, MF determined based on the time consumed; SFtime, SF determined based on the time consumed.
* Analyses are based on subjects with complete data on two 24-h dietary recalls as well as complete information on the variables of interest. All dietary variables are based on average values of the two 24-h dietary recalls.
† Adjusted for sex (boys or girls), age (years, continuous), race/ethnicity (non-Hispanic white, non-Hispanic black, Mexican-American or others), family poverty income ratio (<130, 130–349 or ≥350 %), physical activity (low, moderate or active), watching television and computer use (<2, ≥2 to <4, ≥4 to <6 or ≥6 h/d), survey cycle (2003–2004, 2005–2006, 2007–2008, 2009–2010 or 2011–2012), protein intake (percentage of energy, continuous), fat intake (percentage of energy, continuous), total sugar intake (percentage of energy, continuous) and dietary fibre intake (g/4184 kJ, continuous).
‡ Adjusted for variables used in model 1 and ratio of energy intake:estimated energy requirement (continuous).
§ OR for overweight and abdominal obesity per one increase of eating occasion per day.
|| On the basis of all occasions except for those providing <210 kJ of energy.
¶ Including obesity. Defined as BMI ≥85th percentile of BMI for age according to growth charts available from the Centers for Disease Control and Prevention( Reference Kuczmarski, Ogden and Guo 35 , 36 ).
** Defined as waist circumference equal or above the sex- and age-specific 90th percentile based on data from NHANES III (1988–1994)( Reference Li, Ford and Mokdad 37 ).
†† A meal was defined as any eating episode comprising ≥15 % of total energy intake, regardless of the time of day or composition of foods and beverages consumed; all other eating episodes were classified as snacks.
‡‡ Self-reports of breakfast, brunch, lunch, supper and dinner or their equivalents in Spanish were considered as meals; all other self-reported eating events were considered as snacks.
§§ Meals were defined as eating events reported during select times of the day (06.00–09.00, 12.00–14.00 and 17.00–20.00 hours); all other eating occasions were considered as snacks.
Discussion
To the authors’ knowledge, this is the first study to examine associations of different measures of EF, MF and SF with adiposity measures in a representative sample of US children and adolescents. In the multivariate analyses without taking into account EI misreporting (assessed by EI:EER), all measures of EF, MF and SF showed inverse or null associations in both children and adolescents. However, after full adjustment including EI:EER, a completely different picture emerged, showing positive associations between EF and overweight (children only) and abdominal obesity. All SF variables were also associated with higher risks of overweight and abdominal obesity in children, with no associations for all MF variables. The associations in adolescents were inconsistent, which depended on the definition of meals and snacks. Thus, adjustment for the misreporting of EI, as well as the definition of MF and SF, radically changed the results of the present analysis.
Well-designed previous studies on the association between EF and measures of body fatness have shown mixed findings. In a 10-year prospective study of girls, less-frequent eating at baseline (9–10 years of age) predicted a greater gain in BMI and WC( Reference Ritchie 7 ). Conversely, another prospective study of girls aged 8–12 years showed that higher EF (≥6 times/d), compared with moderate EF (≥4 to <6 times/d), was associated with higher increase in BMI z-score between 8–12 and 11–19 years of age( Reference Thompson, Ballew and Resnicow 21 ). In addition, there was a cross-sectional association between EF and BMI z-score and waist:height ratio in centrally obese children aged 9–10 years, after adjustment for EI misreporting( Reference Jennings, Cassidy and van Sluijs 22 ). In a cross-sectional analysis where only plausible EI reporters were included, there was no association between EF and BMI percentile in all three groups of young people (3–5, 6–11 and 12–19 years)( Reference Huang, Howarth and Lin 25 ). A positive association between EF and BMI z-score emerged in adolescents aged 11–18 years (but not in children aged 4–10 years) after adjustment for EI misreporting( Reference Murakami and Livingstone 26 ). In the present study, positive associations between EF and adiposity measures were shown after adjustment for EI:EER, which is consistent with several previous studies( Reference Thompson, Ballew and Resnicow 21 – Reference Murakami and Livingstone 26 ). To the authors’ knowledge, there has been no attempt to investigate the effects of MF and SF separately in young populations; however, one cross-sectional study in US adults( Reference Howarth, Huang and Roberts 55 ) has shown that after excluding implausible EI reporters SF, but not MF, as defined mainly based on self-report and energy content, was positively associated with BMI, which is consistent with the present observations in children, but not in adolescents. These discrepant findings may be, at least partly, explained by differences in the characteristics and lifestyles of the populations, definitions of EF, MF and SF, dietary assessment methods, adiposity measures and potential confounding factors considered, in addition to under-reporting of EF, MF and SF by obese or overweight subjects.
The main finding of the present study that EF was positively associated with adiposity measures seems plausible given the observed positive association of EF with EI. An increased EF may contribute to an increased EI, resulting in fat mass deposition. Although all measures of MF and SF were positively associated with EI, only SF was associated with adiposity measures in children, which may be due to stronger associations between SF and EF compared with those between MF and EF. In adolescents, on the other hand, despite consistent positive associations of MF and SF with EI, the associations of MF and SF with adiposity measures varied depending on the definition of meals and snacks. Given that there is a lack of consensus definition of meals and snacks, the present study has highlighted the wisdom of applying different definitions for meals and snacks in future evaluation of their impact on adiposity status.
In the present study, (the direction of) the association of EF, MF and SF with adiposity measures radically changed after adjustment for EI:EER. Given the positive association of EF, MF and SF with EI:EER and the inverse association of BMI percentile and WC with EI:EER, this may be due to the under-reporting of EF, MF and SF concomitant with the under-reporting of EI by subjects with higher BMI percentile and WC, as also suggested in a previous study in British adults( Reference Murakami and Livingstone 56 ). Thus, the present study highlights the key importance of adjusting for EI misreporting in studies of EF, MF and SF in relation to adiposity measures.
The strengths of this study include the use of a variety of published definitions of EF, MF and SF based on detailed dietary information obtained from two 24-h dietary recalls, measured anthropometric data and the use of an individualised measure of EER to assess misreporting of EI in a large representative sample of US children and adolescents. However, there are also several limitations inherent to this study. First, the cross-sectional nature of the present study does not permit the assessment of causality owing to the uncertain temporality of the association, and only a prospective study would provide better understanding of the relationships of EF, MF and SF with adiposity measures.
In the present study, an eating occasion was classified as any event that provided ≥210 kJ of energy. Although this definition has been used in several previous studies( Reference Murakami and Livingstone 26 , Reference Hartline-Grafton, Rose and Johnson 42 – Reference Ma, Bertone and Stanek 45 , Reference Ruidavets, Bongard and Bataille 47 ), some arbitrary decision (i.e. energy content) is inevitable by nature. In addition, although MF and SF based on self-report have been most widely used, these are subject to inconsistencies due to differences in individual perceptions, and thus would not necessarily have reduced bias( Reference Johnson and Anderson 30 ). In addition, MF and SF based on EI contribution are, by definition, equal to frequencies of larger (not necessarily ‘meal’) and smaller (not necessarily ‘snack’) eating episodes, respectively. Furthermore, MF and SF based on time may be problematic, because eating patterns vary according to lifestyle as well as the cultural environment( Reference Johnson and Anderson 30 ). Thus, results may possibly differ on the basis of other definitions. In any case, as research explicitly examining the impact of these different definitions is limited, it is currently difficult to decide which definition might be most appropriate for meals and snacks. Similar studies using different definitions of meals and snacks need to be carried out before reaching a consensus on what defines meals and snacks.
At present, the only way to obtain unbiased information on energy requirements in free-living settings is to use doubly labelled water( Reference Livingstone and Black 57 ). This technique is expensive and impractical for application in large-scale epidemiological studies. Instead, in the present study, EER was calculated using equations from the US Dietary Reference Intakes, which have been developed based on a large number of measurements of total energy expenditure by the doubly labelled water method and are highly accurate (R 2≥0·95)( 48 ). In the absence of actual, measured total energy expenditure, these equations should serve as the best proxy. Owing to constraints within the data set, the present study did not have a validated and individualised measure of physical activity. Instead, ‘low active’ level of physical activity was assumed for all subjects for the calculation of EER. This seems adequate for most US children and adolescents, based on accelerometer-based data in NHANES 2003–2006( Reference Troiano, Berrigan and Dodd 49 , Reference Belcher, Berrigan and Dodd 50 ). Nevertheless, in very active individuals (e.g. those aged 6–11 years, as has been reported)( Reference Belcher, Berrigan and Dodd 50 ), EER would be underestimated, resulting in an overestimation of EI:EER. Finally, although adjustment for a variety of potential confounding variables was made, residual confounding could not be ruled out.
In conclusion, in this cross-sectional study in a representative sample of US children and adolescents based on NHANES 2003–2012, positive associations between EF and overweight (children only) and abdominal obesity were observed. All measures of SF were associated with higher risks of overweight and abdominal obesity in children, with no associations for all measures of MF. The associations in adolescents were inconsistent, which depended on the definition of meals and snacks. The practical implications of the present study are that higher SF may be a contributing factor to obesity, particularly in children. Nonetheless, over-simplification should be avoided because there is no consensus about what constitutes a snack, a meal or an eating occasion, and results may possibly differ on the basis of other definitions. Further, adjustment for EI:EER radically affected the results of the analysis. This suggests the importance of adjustment for EI:EER, rather than excluding EI misreporters, which may lead to bias. Prospective studies are needed to establish the associations observed in this study.
Acknowledgements
This study was supported in part by the Grants-in-Aid for Young Scientists (B) from the Ministry of Education, Culture, Sports, Science and Technology of Japan (K. M., grant number 15K16213). The Ministry of Education, Culture, Sports, Science and Technology of Japan had no role in the design, analysis or writing of this article.
K. M. contributed to the concept and design of the study, statistical analysis, data interpretation and manuscript writing. M. B. E. L. critically reviewed the manuscript. All the authors read and approved the final version of the manuscript.
The authors declare that there are no conflicts of interest.
Supplementary Material
For supplementary material/s referred to in this article, please visit http://dx.doi.org/10.1017/S0007114516000854


