


Undernutrition is common among young children living in low-income countries( Reference Black, Victora and Walker 1 ). Both the short- and long-term adverse effects of under-nutrition impact health and future livelihoods. This underscores the need for comprehensive intervention packages, including effective dietary strategies. One such intervention is the use of lipid-based nutrient supplements (LNS) as home fortification of infant foods( Reference Arimond, Zeilani and Jungjohann 2 ). Studies of the effectiveness of LNS for reducing undernutrition have shown mixed results( Reference Maleta, Phuka and Alho 3 – Reference Dewey, Mridha and Matias 5 ). In cases where there was no association between LNS intake and growth outcomes( Reference Maleta, Phuka and Alho 3 ), low adherence to the intervention (LNS consumption) and/or the displacement of other foods in the diet might partially account for the lack of a physiological effect. Thus, to correctly interpret LNS intervention trial results, accurate measurement of the LNS exposure and its influence on overall dietary intakes is fundamental.
The assessment of infant dietary intakes is complicated for several reasons: (1) infants eat very small quantities of food; (2) measuring intake includes measuring not only the amount served, but also amounts left over, spit-up, spilled or dropped; (3) infants are often cared for and fed by multiple people and (4) infants are unable to report their own intakes( Reference Haisma, Coward and Albernaz 6 ). The weighed food record (WFR) is considered the ‘gold standard’ dietary assessment method for quantitative estimates of an individual’s dietary intake, including for young children, because foods are weighed and recorded as they are consumed( Reference Gibson and Ferguson 7 ). However, for large surveys, the 24-h recall is more practical because it is relatively rapid to conduct, has a low respondent burden and is less disruptive for low-literacy communities where, for the WFR, research assistants must weigh and record all foods consumed by participants. The disadvantages of 24-h recalls are that they are prone to errors of memory, recall bias, errors in portion size reporting and potentially a social-desirability bias( Reference Gibson 8 ). The multiple-pass interactive 24-h recall (i-24-HR) was developed specifically for areas with low literacy rates, and includes a pictorial chart to prospectively record dietary intakes and reduce errors of memory( Reference Ferguson, Gadowsky and Huddle 9 ).
Previous studies, in Malawi, Ghana, Sweden and the United States, have assessed the validity of the 24-h recall method relative to WFR for estimating the energy and nutrient intakes of young children( Reference Thakwalakwa, Kuusipalo and Maleta 10 – Reference Persson and Carlgren 13 ). They show recalled compared with weighed energy intakes are generally over-estimated( Reference Thakwalakwa, Kuusipalo and Maleta 10 , Reference Fisher, Butte and Mendoza 12 , Reference Olinto, Victora and Barros 14 ), which for rural Malawian 15-month-old infants was by 13 %( Reference Thakwalakwa, Kuusipalo and Maleta 10 ). This pattern of over-estimation of energy intakes might be more pronounced for toddlers than infants, if accurate reporting becomes more difficult as the diet becomes more complex( Reference Fisher, Butte and Mendoza 12 , Reference Piwoz, Creed de Kanashiro and Lopez de Romana 15 ). To our knowledge, no study has validated the 24-h recall for African infants under 12-months of age.
There is also evidence that certain foods are more accurately reported than others( Reference Bornhorst, Huybrechts and Ahrens 16 , Reference Piwoz, Creed de Kanashiro and Lopez de Romana 17 ). Such differences become important when assessing dietary exposures in a LNS intervention trial because LNS, which is an energy and nutrient dense food, is not present in the diet of the control group. Systematic under- or over-estimation of LNS intakes would bias between-group comparisons by either exaggerating or attenuating the observed effect of LNS on infant dietary intakes, of energy and nutrients. An accurate assessment of dietary exposure is essential in dietary intervention trials to properly understand the association between dietary exposure and outcome( Reference Kipnis and Freedman 18 – Reference Keogh, Carroll and Tooze 20 ). To our knowledge, the i-24-HR has not been validated for use among infants who are participating in an LNS intervention trial.
This study, therefore, aimed to assess the relative validity of the i-24-HR used in an LNS intervention trial, the International Lipid‐Based Nutrient Supplements Dose (iLiNS-DOSE) study( Reference Maleta, Phuka and Alho 3 ). The iLiNS-DOSE study aimed to evaluate the efficacy of three doses of LNS for the prevention of stunting among infants supplemented from 6 to 18 months of age. In this trial, inter-group differences in dietary intakes of energy and nutrients were assessed when the infants were 9–10 months of age( Reference Hemsworth, Kumwenda and Arimond 21 ). The specific objectives of the present study were to (1) assess the relative validity of the i-24-HR method for estimating dietary intakes of energy, protein, fat, Fe, Zn, Ca and vitamin A from complementary foods using a 1-d WFR as the reference method; (2) assess whether there is a differential bias in i-24-HR measures of energy intake between the control group and intervention groups and (3) describe potential sources of measurement error in the i-24-HR, including errors in the types or amounts of LNS and complementary foods reported.
Methods
Design and study population
A cross-sectional validation study was nested within a dietary assessment sub-study of infants participating in the 12-month iLiNS-DOSE randomised control trial conducted in Mangochi district, Malawi from November 2009 to July 2012. Data collection for the dietary assessment sub-study took place between March 2010 and October 2011 when the infants were 9–10 months of age. Data collection for the dietary validation study took place between October 2010 and October 2011. The main trial was designed to assess the impact of three different doses of LNS (10, 20 and 40 g) on linear growth; which was delivered bi-weekly to households in the intervention groups. The objectives and methods of the iLiNS-DOSE trial (n 1980) and the dietary assessment sub-study (n 688) are described in more detail in Maleta et al.( Reference Maleta, Phuka and Alho 3 ) and Hemsworth et al.( Reference Hemsworth, Kumwenda and Arimond 21 ), respectively. In the dietary assessment sub-study, two i-24-HR were done exactly 7 d apart when the infants were between 9 and 10 months of age. In all, one i-24-HR was done during the week LNS was delivered, and the other in the subsequent week. In the validation study, the WFR, which were done 1 d before a corresponding i-24-HR, were done just after the LNS delivery to maximise capturing the presence of LNS in the child’s diet. The other i-24-HR was collected either 7 d before or 7 d after the i-24-HR that corresponded with the WFR day.
Sampling
A random sample of 228 infant–mother dyads was obtained for the validation study (fifty-six in each of the control, 10, 20 and 40 g LNS groups). The sample size for the validation study was calculated to allow detection of a difference of 230 kJ (one 10 g dose of LNS) between each of the four intervention groups with power of 80 % and α=0·05, assuming a standard deviation of the difference between the methods (WFR−i-24-HR) of 577 kJ (derived from a pilot study), and a 10 % attrition rate (e.g. missed i-24-HR following the WFR).
The original inclusion criterion was participation in the dietary assessment sub-study of the iLiNS-DOSE trial. The validation study, however, began 7 months after the trial began, which meant that one-third of participants had already completed the dietary sub-study and were no longer eligible for the validation study. As a result, to meet our target sample size of 228 age-eligible infants, we selected additional infants (n 78) at random from the basic sub-study group (i.e. not randomised to any additional sub-study at baseline to minimise respondent burden) to reach the intended sample size. It introduced an imbalance in the number of infants from the control and 10 g LNS groups v. the 20 and 40 g LNS groups. As such, more infants were in the 20 g LNS and 40 g LNS groups than the other two groups in this validation study.
Ethical approval
Ethical approval for this sub-study was granted by the London School of Hygiene and Tropical Medicine Research Ethics Board as well as by the College of Medicine Research Ethics Board in Malawi. Informed written consent was obtained from all participating caregivers in this study. The trial was registered at clinicaltrials.gov with the identifier: NCT00945698.
Dietary assessment
Interactive 24-h recall
Dietary data were collected using a four-pass i-24-HR, developed for use in a rural African context( Reference Ferguson, Gadowsky and Huddle 9 ). The method was modified specifically for a similar population and included pictorial charts (intended to reduce intrusions and omissions), bowls/cups/plates, and measured portion sizes using real food replicas and salted models. In the dietary assessment sub-study, caregivers were given the pictorial food chart and a plastic cup and bowl 2-d before the i-24-HR was done. On the day before the i-24-HR, caregivers were asked to prospectively record on the pictorial chart all foods, beverages, and LNS (if appropriate) when given to the child to minimise memory errors; and to feed their child from the cup and bowl provided to minimise portion size estimation errors. In the first pass, during the i-24-HR interview, from memory, the caregiver was asked to serially recall all foods, supplements and beverages that their child had consumed in the previous 24 h. In the second pass, information about the time, place and description of the food or beverage was collected. In the third pass, portion sizes were estimated by the caregivers showing the amount served and the amount left-over using real food replicas (with or without excess salt to preserve them) and unit descriptions (e.g. package of biscuits). The amounts were weighed by the interviewers using digital kitchen scales (Home Elegance, accurate to ±1 g), and recorded. The amount consumed was calculated as the amount served minus the amount left-over. LNS portion sizes were measured using a pot of LNS, which was weighed before and after the caregiver had removed the amount of LNS used at each eating occasion. Left-overs were subtracted from the amount of LNS served. If LNS was mixed with other foods, the amount left over was calculated by multiplying the amount served by the proportion of the mixed dish that was consumed, assuming uniform mixing. The consumption of LNS was not specifically probed to prevent errors of intrusion (i.e. items listed but not actually consumed). To reduce potential differences in recording, interviewers were given extensive training and used standardised operating procedures, including a portion size estimation manual, detailing the specific methods for portion size estimations and probing. At the end of the third pass, interviewers asked for the pictorial chart. Any discrepancies between the pictorial chart and the food list of the i-24-HR were discussed. In the final pass, the data collector summarised and confirmed the food and drinks recorded in the i-24-HR.
Weighed food record
All foods and beverages consumed by the child from 06.00 hours until the final meal of the day were weighed and recorded by a data collector, using digital kitchen scales (accurate to ±1 g). Left-over foods were weighed either individually, if they could be separated on the plate, or as a mixture, assuming uniform mixing. Recipe data were collected by weighing all raw ingredients and the final cooked dish. The WFR data collector was not involved in the collection of the i-24-HR data.
Questionnaires
Socio-demographic background characteristics of the infants were collected within 2 weeks of baseline enrolment in the iLiNS-DOSE study, when the infants were 6 months old, using an interviewer-administered questionnaire.
Data processing
Conversion factors were developed for the i-24-HR, and used to estimate the grams of food consumed. Average recipes were calculated for cooked dishes using the individual recipes collected from each household. These data were used to calculate intakes of ingredients from cooked dishes in the i-24-HR. Intakes of energy and nutrients from the WFR and i-24-HR were estimated, using a food composition table developed for this study( Reference Hemsworth, Kumwenda and Arimond 21 ).
The time each item was consumed was also recorded, and it was used to match the corresponding eating occasions for inter-method portion size comparisons. Meals and snacks consumed after 19.00 hours were removed from both the WFR and i-24-HR (i.e. a 12-h WFR and recall were created) because there were occasions during the collection of the WFR when the final meal was consumed after the data collector had left the household.
Statistical analysis
All data analyses were performed using Stata version 12 (StataCorp LLC). The three LNS intervention groups were collapsed to form one large group, for all analyses, because there were no significant inter-group differences in energy and nutrient intakes from complementary foods (including LNS), and the group sample sizes were small( Reference Hemsworth, Kumwenda and Arimond 21 ). In all analyses, except the analyses for an instrument effect (see below), data from only one of the two i-24-HR were used, which was the i-24-HR collected for the same day as the WFR. Energy and nutrient intake distributions from the WFR and i-24-HR were mathematically transformed, when necessary, for the analyses.
Sociodemographic variables
A composite variable for socioeconomic status was calculated using principal component analysis (PCA), and the PCA scores were divided into quintiles using the first principal component. The following variables were used as part of the composite variable: maternal occupation, household crowding, source of electricity, source of water, sanitary facilities, material of roofing, and material of house walls.
χ 2-Tests, for categorical socio-demographic variables, and two-sample t tests, for non-categorical socio-demographic variables, were used to check for variables associated with ‘missingness’ of WFR and for differences between intervention groups (control v. LNS) in the validation study.
Assessment of agreement between dietary assessment methods
Paired t tests were used to compare mean intakes of energy and nutrients from the corresponding i-24-HR and WFR. Absolute differences (‘error’) in amounts of energy and nutrients between the two methods were calculated as follows: i-24-HR−WFR. A two-sample t test with equal variances was used to compare the absolute differences between the control and intervention groups. Bland–Altman plots were used to estimate, for energy intakes, the level of agreement between the two methods and the 95 % limits of agreement (LOA).
Assessment of differential error
Measurement error modelling was used to investigate whether error in the i-24-HR differed by treatment group. We let $S_{1} $
denote the i-24-HR measurement (square-root transformed) made at the same time as the WFR, and
$S_{1} $
denote the i-24-HR measurement (square-root transformed) made at the same time as the WFR, and $W_{1} $
denote the WFR measurement itself (square-root transformed). The second independent i-24-HR measurement (square-root transformed) was denoted
$W_{1} $
denote the WFR measurement itself (square-root transformed). The second independent i-24-HR measurement (square-root transformed) was denoted $S_{2} $
. The true, but unobserved, intakes at time points 1 and 2 were denoted
$S_{2} $
. The true, but unobserved, intakes at time points 1 and 2 were denoted $Y_{1} $
and
$Y_{1} $
and $Y_{2} $
, respectively. At time point
$Y_{2} $
, respectively. At time point $j \;(j{\equals}1,\,\,2)$
the relationships between the observed measurements of dietary intake and the unobserved underlying true intake were assumed to be of the following forms, where we allowed separate model parameters for individuals in the control (C) and combined intervention (T) groups,
$j \;(j{\equals}1,\,\,2)$
the relationships between the observed measurements of dietary intake and the unobserved underlying true intake were assumed to be of the following forms, where we allowed separate model parameters for individuals in the control (C) and combined intervention (T) groups, $\eqalignno{ & {\rm Combined \;intervention \;group}\colon\,{\rm }S_{j} {\equals}\gamma _{{0{\rm T}}} {\plus}\gamma _{{1{\rm T}}} Y_{j} {\plus}\epsilon _{{{\rm T}j}} \cr & {\rm Control \;group}\colon\,{\rm }S_{j} {\equals}\,\gamma _{{0{\rm C}}} {\plus}\gamma _{{1{\rm C}}} Y_{j} {\plus}\epsilon _{{{\rm C}j}} \cr & {\rm Combined \;intervention\; group}\colon\,{\rm }W_{1} {\equals}Y_{j} {\plus}\delta _{{{\rm T}j}} \cr & {\rm Control\; group}\colon\,{\rm }W_{1} {\equals}Y_{j} {\plus}\delta _{{{\rm C}j}} (1) $
The $\epsilon $
and
$\epsilon $
and $\delta $
terms are random errors with mean zero and constant variance. The WFR is assumed to provide an unbiased estimate of true intake in both the control and intervention groups. The intercept parameters
$\delta $
terms are random errors with mean zero and constant variance. The WFR is assumed to provide an unbiased estimate of true intake in both the control and intervention groups. The intercept parameters $\gamma _{{{\rm 0T}}} $
and
$\gamma _{{{\rm 0T}}} $
and $\gamma _{{0{\rm C}}} $
, and slope parameters
$\gamma _{{0{\rm C}}} $
, and slope parameters $\gamma _{{{\rm 1T}}} $
and
$\gamma _{{{\rm 1T}}} $
and $\gamma _{{{\rm 1C}}} {\mib{ }} $
, represent systematic error in the i-24-HR measurement. We assessed evidence for differential error based on estimates of the differences
$\gamma _{{{\rm 1C}}} {\mib{ }} $
, represent systematic error in the i-24-HR measurement. We assessed evidence for differential error based on estimates of the differences
 $$\gamma _{{{\rm 1T}}} {\minus}\gamma _{{{\rm 1C}}} $$
and
$$\gamma _{{{\rm 1T}}} {\minus}\gamma _{{{\rm 1C}}} $$
and $\gamma _{{0{\rm T}}} {\minus}\gamma _{{{\rm 0C}}} $
and corresponding bootstrap CI. The parameters of the measurement error model in Equation (1) were estimated via a method of moments approach.
$\gamma _{{0{\rm T}}} {\minus}\gamma _{{{\rm 0C}}} $
and corresponding bootstrap CI. The parameters of the measurement error model in Equation (1) were estimated via a method of moments approach.
Sources of disagreement between the interactive 24-h recall and weighed food records
To identify possible sources of disagreement between the two dietary assessment methods, we categorised each food and drink item (for composite dishes, we matched the individual ingredients) as an omission (present on WFR, absent on i-24-HR), an intrusion (absent on WFR, present on i-24-HR) or a match (present on both methods at matching meal/snack times). We calculated the frequency of each category across food groups (i.e. phala; nsima and rice; added sugar; sweetened snacks; savoury snacks; meat, fish and eggs; legumes, nuts and seeds; fruit; starchy roots and vegetables; milk and yogurt; non-dairy beverages; soup/broth from relish and LNS), a method previously described by Smith et al.( Reference Smith, Domel Baxter and Hardin 22 ). We compared the median percentage agreement for each food group (i.e. 100×reported amount (i-24-HR)/reference amount (WFR)), for the intervention and control groups, using Mann–Whitney rank sum test when the sample was at least five consumers. In the case where one food within a food group of these is an intrusion, this resulted in a reference amount of zero (at the individual food level only), and in the case where there is an omission, this resulted in a reported amount of zero. We also compared the overall inter-method differences, in the grams of food consumed in each food group, using the Wilcoxon signed-rank test.
Instrument effect
We tested for an ‘instrument effect’, because the presence of a data collector on the day of the WFR might have influenced the caregivers’ ability to recall dietary intakes during its corresponding i-24-HR. This ‘instrument effect’ was assessed using the Wilcoxon signed-rank test, by comparing the median intakes of energy and nutrients estimated using the i-24-HR corresponding to the WFR day and the i-24-HR collected on a day independent of the WFR (i.e. collected 1 week before or after the WFR). For this analysis, n 71 matched records were available.
Results
Participants
A total of 228 infants were selected to participate in the validation study. However, seventy-eight were lost to follow-up and eighteen did not have a matching WFR and i-24-HR. The final sample size analysed was 132 matching i-24-HR and WFR (Fig. 1). There were no significant differences in socio-demographic characteristics comparing those with missing data and those who completed the WFR (data not shown). Likewise, there were no differences in baseline characteristics between the intervention and control groups (Table 1).
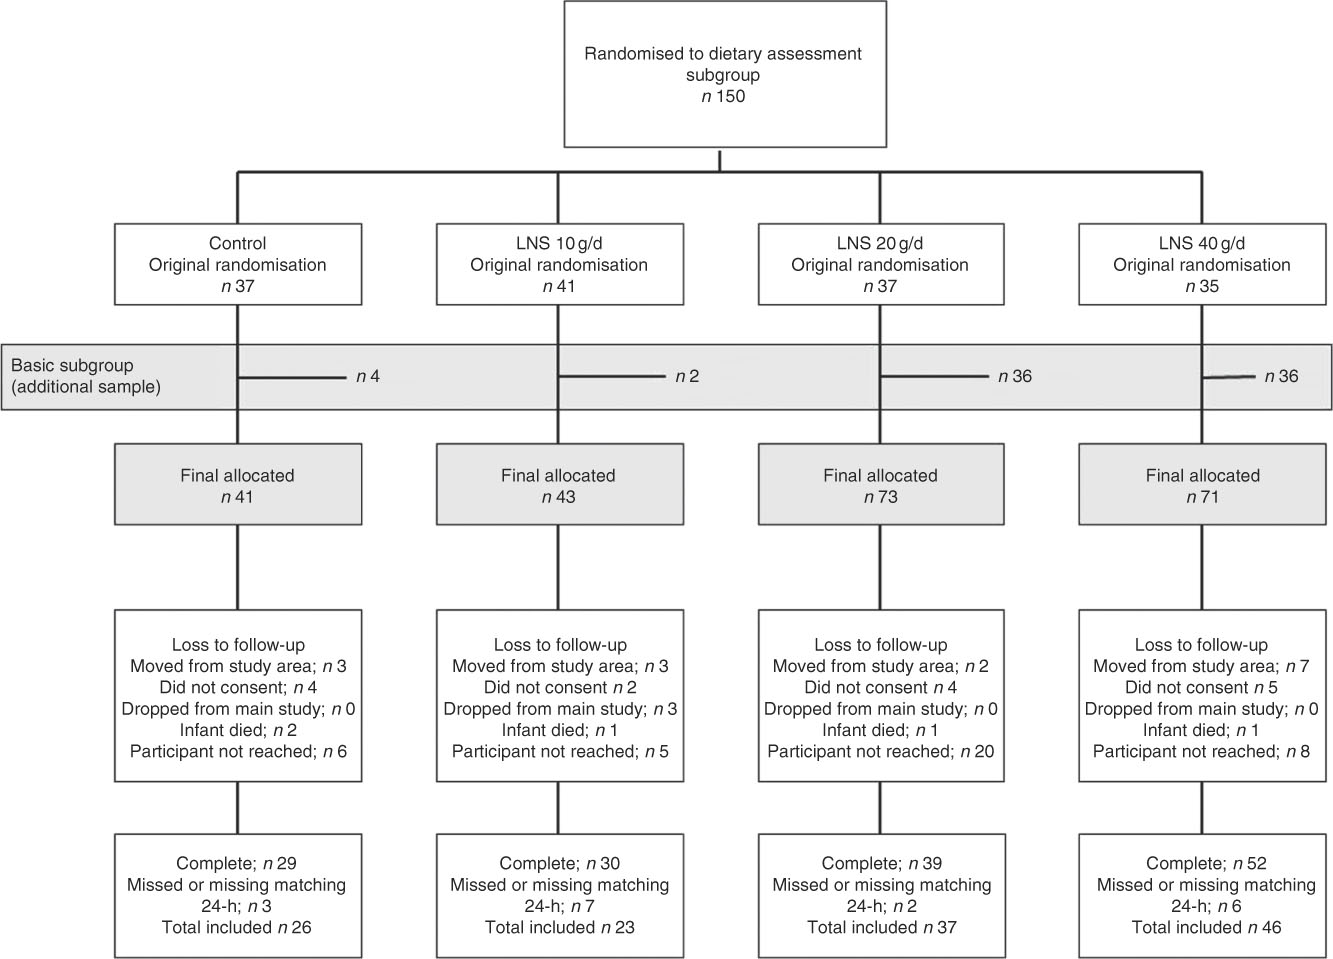
Fig. 1 Consort flow diagram of participant enrolment and inclusion in the validation sub-study. LNS, lipid-based nutrient supplements.
Table 1 Characteristics of participants at enrolment into the main study (at 6 months of age) (Numbers and percentages; mean values and standard deviations)
* χ 2.
† Two-sample t test.
‡ n 25 breastfed, n 1 missing value in this control group.
Agreement between dietary assessment methods
The reported energy intakes were lower in the i-24-HR compared with the WFR, although the difference was not statistically significant (P=0·09) (Table 2). Reported protein intake was significantly underestimated and Ca intake was significantly over-estimated by the i-24-HR compared with the WFR (P<0·001). There were no significant between-method differences in intakes of fat, Fe, Zn or vitamin A. The Bland–Altman plot showed a systematic bias for under-reporting recalled energy intakes compared with the WFR and poor agreement at the individual level, with 95 % LOA of −1531 to 1322 kJ (online Supplementary Fig. S1).
Table 2 Estimated intakes of energy and selected nutrientsFootnote * using the interactive 24-h recall (i-24-HR) compared with weighed food records (WFR) between the hours of 06.00 and 18.00 by intervention group and pooled group (Mean values and 95 % confidence intervals)
LNS, lipid-based nutrient supplement; RAE, retinol activity equivalents.
* Data back-transformed from square root transformation for presentation.
† Absolute mean difference: i-24-HR−WFR.
‡ Matched pairs t test.
§ Two-group t test with equal variances between intervention and control group absolute differences.
When stratified by intervention group, however, there was a significant under-estimation of recalled energy intakes in the control group (P=0·010) but not in the intervention group (P=0·60) (Table 2). Recalled intakes of protein, fat, Fe and Zn were also significantly underestimated in the control group. In the intervention group, recalled intakes of protein were significantly under-estimated, whereas recalled intakes of Ca and Zn were significantly overestimated (Table 2). Further, after comparing the absolute differences (‘error’) calculated between the WFR and i-24-HR in the control and intervention groups, we found significant differences (P≤0·05) for energy (kJ) and Fe, and all other nutrients were considered non-significant (P>0·05). The Bland–Altman plot by intervention group (online Supplementary Fig. S2(a) and (b)) showed poor 95 % LOA for energy at an individual level, for both the intervention (95 % LOA −1498, 1410 kJ) and control (95 % LOA −1569, 866 kJ) groups; and a mean systematic under-estimation of energy intakes in the control group only (−351 kJ).
By fitting the measurement error models in Equation (1), we found that $\hat{\gamma }_{{1{\rm C}}} {\equals}{\minus}2\hskip-2pt\cdot\hskip-2pt4 $
(95 % CI −24·9, 29·7) and
$\hat{\gamma }_{{1{\rm C}}} {\equals}{\minus}2\hskip-2pt\cdot\hskip-2pt4 $
(95 % CI −24·9, 29·7) and $\hat{\gamma }_{{1{\rm T}}} {\equals}2\hskip-2pt\cdot\hskip-2pt6$
(95 % CI −20·0, 20·2),
$\hat{\gamma }_{{1{\rm T}}} {\equals}2\hskip-2pt\cdot\hskip-2pt6$
(95 % CI −20·0, 20·2), $\hat{\gamma }_{{0{\rm C}}} {\equals}129\hskip-2pt\cdot\hskip-2pt3$
(95 % CI 120·3, 137·6) and
$\hat{\gamma }_{{0{\rm C}}} {\equals}129\hskip-2pt\cdot\hskip-2pt3$
(95 % CI 120·3, 137·6) and $\hat{\gamma }_{{0{\rm T}}} {\equals}{\minus}66\hskip-2pt\cdot\hskip-2pt5$
(95 % CI −70.5, −62·7). The CI were obtained from the 2·5 and 97·5 percentiles of 1000 bootstrap estimates, using bootstrap samples stratified by intervention group. The expected i-24-HR measure of energy intake (
$\hat{\gamma }_{{0{\rm T}}} {\equals}{\minus}66\hskip-2pt\cdot\hskip-2pt5$
(95 % CI −70.5, −62·7). The CI were obtained from the 2·5 and 97·5 percentiles of 1000 bootstrap estimates, using bootstrap samples stratified by intervention group. The expected i-24-HR measure of energy intake ( $S$
) given the true intake (
$S$
) given the true intake ( $Y$
) is therefore
$Y$
) is therefore $E\left( {S{\rm \,\mid\,}Y} \right){\equals}{\minus}66\hskip-2pt\cdot\hskip-2pt5{\plus}2\cdot6Y$
in the combined intervention group, and
$E\left( {S{\rm \,\mid\,}Y} \right){\equals}{\minus}66\hskip-2pt\cdot\hskip-2pt5{\plus}2\cdot6Y$
in the combined intervention group, and $E\left( {S{\rm \,\mid\,}Y} \right){\equals}129\hskip-2pt\cdot\hskip-2pt3{\minus}2\cdot4Y$
in the control group. The estimates of the slope are in opposite directions in the intervention and control groups because the correlation between the independent i-24-HR and the WFR is positive in the intervention group, but negative in the control group; however the CI are very wide and the 95 % bootstrap CI for the difference
$E\left( {S{\rm \,\mid\,}Y} \right){\equals}129\hskip-2pt\cdot\hskip-2pt3{\minus}2\cdot4Y$
in the control group. The estimates of the slope are in opposite directions in the intervention and control groups because the correlation between the independent i-24-HR and the WFR is positive in the intervention group, but negative in the control group; however the CI are very wide and the 95 % bootstrap CI for the difference $\gamma _{{1{\rm T}}} {\minus}\gamma _{{{\rm 1C}}} $
was (−46·6, 56·5). However, there was strong evidence for a difference in the intercepts; the 95 % bootstrap CI for the difference
$\gamma _{{1{\rm T}}} {\minus}\gamma _{{{\rm 1C}}} $
was (−46·6, 56·5). However, there was strong evidence for a difference in the intercepts; the 95 % bootstrap CI for the difference $\gamma _{{{\rm 0T}}} {\minus}\gamma _{{{\rm 0C}}} $
was (−204·8, −185·6). The model-based approach, therefore, suggests that the relationship between the i-24-HR measure of energy intake and the true intake may be different in the intervention and control groups, that is, potential differential error.
$\gamma _{{{\rm 0T}}} {\minus}\gamma _{{{\rm 0C}}} $
was (−204·8, −185·6). The model-based approach, therefore, suggests that the relationship between the i-24-HR measure of energy intake and the true intake may be different in the intervention and control groups, that is, potential differential error.
Sources of disagreement between the interactive 24-h recall and weighed food records
Lipid-based nutrient supplement intakes
In the intervention group, there was a significant between-method difference in estimated LNS intakes. The median intake was significantly higher for the recalled (i-24-HR) than reference (WFR) amount (i.e. 8·1 g (4·5, 11·8) v. 4·5 g (2·0, 9·0); P<0·001) (online Supplementary Table S1). The median (interquartile range) percentage agreement (matched LNS portions) indicates recalled LNS consumption was over-estimated by over 50 % compared with the WFR (Table 3). Close to 90 % of the eating occasions matched on both the WFR and i-24-HR; and rates of intrusions and omissions were similar and low (Table 4).
Table 3 Percentage agreement for matching foods (items appearing both on the interactive 24-h recall and the weighed food record) between intervention groups (Medians and 25th and 75th percentiles)
LNS, lipid-based nutrient supplement.
* Report percentage=(reported amount/reference amount)×100. Reference amount observed during the weighed food record; reported amount taken from the interactive 24-h recall.
† Includes all portion sizes from items that match between the reported and reference values at the same time (i.e. meal or snack time).
‡ One participant missing in the control group for these analyses.
§ Mann–Whitney two-sample rank sum test by food group.
|| LNS only present in the diets of the intervention group, which is why there is no between-group comparison. This is descriptive only, looking at the percentage agreement of LNS in the intervention group.
Table 4 Number of eating episodes and percentages of matching food groups (items appearing both in the interactive 24-h recall (i-24-HR) and the weighed food record (WFR)), intrusions and omissions by intervention groups (Numbers and percentages)
LNS, lipid-based nutrient supplement.
* One participant missing for these analyses.
† The total of portions that were matched between the reference (WFR) and reported (i-24-HR), as a percentage of all items in the same group.
‡ The total of portions that were reported (i-24-HR) but not observed in the reference data (WFR).
§ The total of portions that were observed in the reference data (WFR), but not reported (i-24-HR).
Complementary food intakes
At the pooled group level, phala, legumes, nuts and seeds, and meat, fish and eggs were significantly under-estimated; whereas, soups/broths from relish and added sugar were significantly over-estimated in the i-24-HR compared with the WFR (online Supplementary Table S1). There were no significant differences between intervention and control groups in reporting accuracy (i.e. percentage agreement for food groups), except for soups/broths from relish, where the control group showed a higher over-reporting rate than the intervention group. These comparisons, for four of the twelve food groups, were limited by the small sample size of the control group (Table 3).
In both the intervention and control groups, a comparison of food group matches, intrusions and omissions showed the highest reporting agreement for staples, where over 88 % of the phala and nsima eating occasions matched between the two methods (Table 4). Episodically consumed foods such as meat, fish and eggs (which were frequently misreported as soup/broth from relish), starchy roots and vegetables, and sweetened snacks had poor reporting matching, with a higher tendency for respondents to omit (i.e. forget) as opposed to intrude (i.e. add in error).
The ‘instrument-effect’
There was no evidence of an ‘instrument effect’. There were no significant differences in estimated intakes of energy or nutrients comparing the independent i-24-HR (performed either 1 week before or after the WFR) and the corresponding i-24-HR (i.e. for the same day as the WFR). The absolute differences ranged from zero retinol activity equivalents/d to 142 kJ/d (online Supplementary Table S2).
Discussion
In the context of a LNS supplementation trial, we found there was no significant difference comparing energy intakes measured using the i-24-HR to the WFR when all groups were pooled. This comparison was not biased towards agreement by the weighing process, because the independent and corresponding i-24-HR provided similar estimates of energy and nutrients intakes. However, this pooled comparison masked a difference between the intervention and control groups. When stratified by intervention group, the i-24-HR systematically under-estimated dietary energy intakes compared with the WFR in the control group but not in the intervention group. The significant difference in the ‘error’ or absolute difference between the methods in control and intervention groups suggests a differential for recalled energy intakes. This differential error, for estimating median energy intakes, primarily is the result of an over-estimation of the energy-dense supplement (LNS), which was only consumed by the intervention group. It compensated for the under-estimation of energy intakes from complementary foods because most caregivers were able to report whether their infant had consumed it. In contrast, when using dietary data collected via i-24-HR to examine associations, the 95 % LOA indicate poor agreement at the individual level, in both groups, which will attenuate associations. These results highlight, when aiming to estimate inter-group differences in median intakes of energy and nutrients in an intervention trial, the importance of examining whether systematic measurement error when quantifying intervention food consumption, contributes to a differential bias. In studies aiming to examine associations between dietary intakes and functional outcomes (e.g. growth), the i-24-HR is inferior to more accurate methods of dietary assessment. In our study, considerable effort was made to accurately estimate LNS consumption. The caregivers were asked to spoon out the amount of LNS served to the infant and estimate the amount left-over, which were both weighed and recorded.
There were few differences, comparing the intervention and control groups, for between-method agreement in the estimation of complementary foods intakes. In the pooled group analyses, the main sources of between-method disagreement were under-estimated recalled portion sizes of dietary staples (phala, rice and nsima by between 11 and 14 %), meat, fish and eggs and legumes, nuts and seeds. Energy-dense foods, such as added sugar, were overestimated by over 40 % compared with the WFR; but it did not compensate for the under-estimation of energy from staples (phala, nsima and rice). This result is not surprising because dietary staples provide a high percentage of daily energy intakes for rural infants in Malawi.
Underestimation of certain food groups is not unique and has been reported among women in Malawi( Reference Ferguson, Gadowsky and Huddle 9 ) as well as preschool-aged children in Ghana( Reference Ferguson, Gibson and Opare-Obisaw 11 ). However, the underestimation in energy intakes relative to the WFR, in the control group of our study, is in contrast to results from a study of 10–13 month old Senegalese infants (n 45), which showed the 24-h recall was a relatively good measure of intake compared with WFR( Reference Dop, Milan and Milan 23 , Reference Dop, Milan and Milan 24 ); and a study of 15-month old rural Malawian infants (n 169), which showed a systematic over-estimation in energy and nutrient intakes( Reference Thakwalakwa, Kuusipalo and Maleta 10 ). The sources of measurement error, in the previous Malawian study, are unknown. These inter-study differences could be a function of inter-method or age group differences. In our study, we probed for left-overs and adjusted the portion sizes in the i-24-HR based on recalled left-overs. This adjustment was not reported in the other studies. It has been suggested that as a diet becomes more complex (as the infant ages), the reporting accuracy changes( Reference Fisher, Butte and Mendoza 12 ) and perhaps the direction of the error also changes.
The results of this validation study suggest that a differential error might be present when an i-24-HR is used to measure group mean dietary intakes, which is related to a systematic over-estimation of the exposure (LNS). Linear calibration techniques could be used to correct the systematic under-estimation of energy intakes from non-LNS foods. Previous studies have developed correction factors using the WFR as the reference standard to adjust i-24-HR energy intakes for a systematic overestimation of energy intakes compared with the WFR. This technique is not recommended for the current study because the reference method is subject to the same errors as the test method( Reference Willett 19 , Reference Keogh, White and Rodwell 25 ), for example, both the WFR and i-24-HR are subject to mis-estimation of items that were spilled or spit up. The linear calibration equations would only have been appropriate if we had used a biomarker, such as the stable isotope technique to measure total energy expenditure, which is an unbiased and independent measure of long-term energy intake( Reference Haisma, Coward and Albernaz 6 , Reference Keogh, Carroll and Tooze 20 ).
Study limitations and advantages
The main study limitations were the relatively low sample size and high rate of attrition. The study was underpowered to detect differential error in the i-24-HR between control v. intervention groups. The high rate of attrition occurred because of the logistical demands of this validation study in a large catchment area (i.e. transportation, communication with households, etc.). No observed background characteristics were associated with missing the visit.
Another limitation was the reference method used. The WFR is the most common reference standard for comparison with a 24-h dietary recall because it is less resource-intensive than collection of biomarkers, and it provides useful robust information about portion size estimation, intrusions and omissions. However, it does not meet the strict criteria for a valid reference method( Reference Kipnis, Midthune and Freedman 26 ). To validate the i-24-HR (repeated to provide an estimate of usual intakes), for estimating energy intakes alone, the doubly labelled water method is the preferred reference method( Reference Keogh, White and Rodwell 25 , Reference Moore, Prentice and Coward 27 ). Further, the modelling approach we used to assess evidence for differential error (Equation (1)), relies on an assumption that the WFR provides an unbiased measure of intake, as well as additional assumptions about the form of the systematic errors.
This study also had many advantages. It was carried out several months after the start of the intervention, which meant that the children were habituated to the intervention food. It was also conducted over a long period of time which allowed for seasonal variation in dietary patterns and episodically consumed foods to be captured. This study is also the first study that we are aware of that has assessed the relative validity of the i-24-HR for estimating the dietary intakes of rural African infants under 12 months of age who are participating in an LNS intervention trial. Such trials are important because the process of stunting predominantly occurs before 15 months of age in rural Africa( Reference Victora, de Onis and Hallal 28 ). Detailed and accurate dietary intake information will contribute to an improved understanding of direct causes of stunting and undernutrition. The study results emphasise the importance of considering a potential differential bias to avoid the misinterpretation of intervention results.
Conclusions
At the pooled group level, the i-24-HR showed relatively good agreement to the WFR. However, there was an apparent differential bias whereby the mean intakes of energy and some nutrients were under-estimated compared with the WFR in the control group but not in the intervention group. Considering the cost and logistical implications of the WFR, the i-24-HR could be used in its place, for estimating mean intakes, but careful attention should be made during the design stage to the objectives of the study and whether only measures of absolute intakes or overall between-group differences are required. Absolute intakes might be under-estimated, if the i-24-HR is used to estimate dietary energy intakes of 9–10-month-old infants who are not consuming an energy dense supplement, such as LNS. Future interventions evaluating differential dietary exposures (such as LNS) should consider, when comparing groups, whether a systematic error in intervention food measurement introduced a differential bias. When designing the study, they should put effort into developing an accurate method of quantifying intervention food consumption; and where possible, evaluate it in a pilot study before commencing data collection. For researchers aiming to examine associations between dietary intakes and functional outcomes, such as growth, if resources permit, they should include a dietary assessment validation study, with a biomarker reference method (or using a gold-standard reference method) to understand the dietary assessment method’s measurement error structure to help avoid misinterpretation of dietary intakes in relation to final growth outcomes.
Acknowledgements
The authors are grateful for the skilled and dedicated efforts of the data collection team: Mayamiko Banda, Hamsa Banda, Zikomo Chipatso, Reuben Mbwana, Tony Kansilanga, Mike Njaya and Yacinta Stima. The authors are thankful to Jimmy Ngwaya who carefully prepared the food models which formed the basis of the data collection tools. A special thanks to Kathryn Dewey and Per Ashorn for their guidance and leadership in developing the protocol for this study, and expert advice throughout the study implementation and analysis. The authors are grateful for the vision, wisdom and professional guidance of the whole iLiNS Study Steering Committee (http://ilins.org/about-ilins/who-we-are/ilins-steering-committee).
This manuscript is based on research funded by a grant issued to the University of California, Davis from the Bill & Melinda Gates Foundation. The findings and conclusions contained within are those of the authors and do not necessarily reflect positions or policies of the Bill & Melinda Gates Foundation.
J. H., C. K., K. M., U. A., M. A. and E. L. F. designed the research and significantly contributed to the aim and structure of manuscript; J. H. and C. K. conducted the research; A. M. R. and R. K. provided statistical guidance and assistance with methods; J. H., R. K. and E.L.F analysed data and performed statistical analyses; J. H. drafted the paper with inputs from R. K. and E. L. F.; J. H., R. K. and E. L. F. had primary responsibility for the final content. R. K. and E. L. F. have equal contribution to senior authorship. All authors have read and approved the final manuscript.
The authors declare that there are no conflicts of interest.
Supplementary material
For supplementary material/s referred to in this article, please visit https://doi.org/10.1017/S0007114518002374


