


A growing body of literature has demonstrated that night-time pre-sleep consumption of snack-sized portions (544–628 kJ) does not have a detrimental effect on next-morning metabolism and appetite across a number of populations(Reference Madzima, Panton and Fretti1–Reference Leyh, Willingham and Baur8). These findings contribute to the view that the night-time pre-sleep period can be an opportunity for an increase in protein intake, a macronutrient that has an increased demand in ageing populations(Reference Bauer, Biolo and Cederholm9). In particular, there are a number of studies demonstrating that night-time pre-sleep protein consumption is not harmful to next-morning measures of metabolism and appetite in premenopausal women(Reference Madzima, Melanson and Black2–Reference Kinsey, Eddy and Madzima5,Reference Leyh, Willingham and Baur8) . However, menopause can cause a reduction in RMR that may be ameliorated with increased protein intake(Reference Hodson, Harnden and Banerjee10–Reference Wang, Hassager and Ravn12).
Menopause can cause changes in body composition and metabolism. Specifically, women going through menopause can experience significant reductions in lean mass paired with increases in visceral adipose tissue(Reference Hodson, Harnden and Banerjee10–Reference Wang, Hassager and Ravn12). As a side effect of reduced lean mass, postmenopausal women experience a significant reduction in RMR(Reference Hodson, Harnden and Banerjee10,Reference Lovejoy, Champagne and De Jonge11) . Interestingly, postmenopausal women have been shown to compensate for this decline in RMR by reducing energy intake(Reference Hodson, Harnden and Banerjee10,Reference Lovejoy, Champagne and De Jonge11) . However, the failure to decrease energy intake would probably result in increased body mass and an elevated risk for cardiometabolic disorders(Reference Lovejoy, Champagne and De Jonge11).
By virtue of reduced energy intake, it has been shown that postmenopausal women consume lower amounts of protein than in their premenopausal years(Reference Hodson, Harnden and Banerjee10,Reference Lovejoy, Champagne and De Jonge11) . Coincidentally, increasing protein intake has been proposed as a strategy to combat a decline in lean mass, RMR and rise in fat mass, all of which can occur as a result of menopause(Reference Arciero, Gentile and Pressman13,Reference Gordon, Bopp and Easter14) . Increased protein intake enhances diet-induced thermogenesis (DIT), muscle protein synthesis (MPS) and satiety(Reference Tappy15,Reference Halton and Hu16) . In particular, DIT, defined as the increase in energy expenditure above baseline following food consumption, can be elevated by 20–30 % after protein consumption(Reference Tappy15). Consuming a high-protein diet, defined as protein accounting for ≥25 % of energy intake, causes an increase in DIT and ultimately total daily energy expenditure(Reference Halton and Hu16–Reference Arciero, Ormsbee and Gentile19). Additionally, the application of more protein to the diet has been shown to aid in lean mass preservation and can reduce abdominal fat by increasing the feeling of satiety throughout the day(Reference Arciero, Ormsbee and Gentile19,Reference Astrup20) .
While an increased protein intake could mitigate menopause-induced RMR reduction, it remains unknown if pre-sleep protein consumption will benefit or have no effect on next-morning metabolism in postmenopausal women. It would be expected that a sedentary postmenopausal woman, in the absence of reduced energy intake, would be at an elevated risk for weight gain when chronically consuming energy at night. Recent research contradicts this and shows that pre-sleep consumption of 544–628 kJ of casein protein (CP) results in increased next-morning RMR and satiety in both active and sedentary premenopausal populations(Reference Madzima, Melanson and Black2–Reference Kinsey, Eddy and Madzima5,Reference Leyh, Willingham and Baur8) . In addition, pre-sleep protein intake increases overnight MPS(Reference Groen, Res and Pennings21,Reference Res, Groen and Pennings22) , which may aid in preservation of lean mass and thus RMR(Reference Bopp, Houston and Lenchik23,Reference Tzankoff and Norris24) . However, pre-sleep consumption of 544–628 kJ of CP may have negative effects in sedentary premenopausal women, causing increased next-morning levels of insulin in the absence of exercise(Reference Kinsey, Eddy and Madzima5). Overall, it remains unknown if the next-morning response of RMR and appetite to pre-sleep consumption of CP varies between sedentary pre- and postmenopausal women.
Therefore, the present study investigated the extent to which night-time pre-sleep consumption of a single serving of CP or a placebo supplement (PL) affects next-morning measures of satiety and metabolism in sedentary premenopausal women compared with sedentary postmenopausal women. We hypothesised that consumption of night-time pre-sleep CP would increase next-morning RMR and reduce appetite to a greater extent than that of PL. We also hypothesised that postmenopausal women would have a significantly lower RMR than premenopausal women and lower elevation in next-morning RMR in response to pre-sleep CP consumption.
Experimental methods
Subjects
Seven sedentary premenopausal and seven postmenopausal women from Florida State University and the city of Tallahassee were recruited for the present study. Inclusion criteria for premenopausal subjects were an age range of 18–30 years and an age range of 45–65 years for postmenopausal women. In addition to age, postmenopausal women were only included if they had an absence of menses for ≥12 months. All subjects were healthy and were excluded if they were diagnosed with uncontrolled hypertension (blood pressure >160/100 mmHg), diabetes, thyroid problems, kidney dysfunction and/or had milk allergies. In addition, subjects were excluded if they were smokers, had a BMI >35·0 kg/m2 and or participated in structured physical activity for >30 min 2×/week. Participants were asked to refrain from taking any nutritional supplements (except for a multivitamin) throughout the duration of the study. The present study was conducted according to the guidelines established in the Declaration of Helsinki, and all procedures involving human subjects were approved by the Florida State University Institutional Review Board (HSC no. 2017.21878). Written informed consent was obtained before participation in the study.
Study design
The study was a randomised, crossover, double-blind, placebo-controlled trial comparing the effects of 25 g of CP (33 g, 130 energy content, 25 g protein, 3 g carbohydrate, 1·5 g fat, 500 mg Ca, 95 mg Na, 45 mg K; powder form) with a flavour-matched PL (7·2 g, Gum Arabic 5 g, Ultrasmooth 500 mg, Natural & Artificial Vanilla Flavour 960 mg, Sucralose 180 mg, KCl 80 mg, White Blend Opacifier Sensient 500 mg; powder form) on RMR and appetite in sedentary pre- and postmenopausal women. Subjects came to the laboratory on three different occasions. Before the first visit, subjects were screened and told about the study over the phone. If the subject was interested in participation, she was invited to the laboratory for her first day of testing. The first visit occurred at the laboratory between 08.00 and 12.00 hours. Subjects were asked to wear sport bras and shorts and to arrive after a 3 h fast. During their first visit, subjects completed demographics, physical activity and medical history questionnaires. On completion of the questionnaires, subjects had their anthropometrics and body composition measured. Baseline measurements of blood pressure (completed for screening purposes), height, weight, waist circumference and body composition via dual-energy X-ray absorptiometry (model DPX-IQ; GE Healthcare Inc.) were performed to measure lean mass and fat mass. Following baseline testing, subjects were transported to the Institute of Sports Sciences and Medicine and familiarised with procedures for the metabolic testing of RMR. Subjects were asked to rest in a semi-recumbent position with a ventilated hood covering their head and torso for 40 min. The first visit concluded with subjects being given a 3 d dietary food log and a 24 h food log that were completed and returned to the research staff on the second visit. Subjects were also randomly assigned to consume either CP or PL. A CP or PL supplement was pre-mixed and delivered to each subject at her residence 1 h before her bedtime on the nights before visit two and three. Each subject was asked to consume the supplement no less than 2 h after her last meal and no more than 30 min prior to getting into bed.
The following morning, subjects reported to the Institute of Sports Sciences and Medicine in a fasted state (no food or drink, except for water, for at least 8 h) between 06.00 and 09.00 hours. Each visit began with collection of the 3 d and 24 h food logs and completion of a visual analogue scale to assess hunger, satiety and desire to eat. Subjects then had their RMR and RER measured. At the end of testing, subjects were given the opposite supplement to take home and consume the night before their third visit. Subjects were also given their 24 h food log back so they could replicate their diet 24 h prior to their third visit. The third visit followed the same procedures as the second visit. Each visit lasted approximately 1·5 to 2 h and was separated by 48 h. For premenopausal women, the second and third visits were completed 48 h apart, at least 1 week after the first visit, and during their follicular phase. All premenopausal women reported menses lasting for 5 d and were scheduled based on their monthly estimated dates for the occurrence of menses. Thus, the second and third laboratory visits occurred over a 5 d span. Postmenopausal women completed the second and third visit 1 week after visit one.
Anthropometrics and body composition
Height was measured using a wall-mounted stadiometer, and weight was measured using a digital scale (Seca Corporation). Waist circumference was measured using a Gulick fibreglass measuring tape with a tension handle (Creative Health Products Inc.). Measurements for waist circumferences were taken twice, and additional measurements were made if the initial readings were not within 5 mm of each other. Waist circumference was measured at the smallest area around the torso, above the umbilicus and below the xiphoid process.
All dual-energy X-ray absorptiometry scans were completed and evaluated in accordance with the manufacturer’s instructions by the same certified X-ray technician. Subjects were asked to lie in a supine position while the scan was being completed. Body composition values of lean mass and fat mass and the appendicular skeletal muscle index were determined. The appendicular skeletal muscle index was calculated by dividing the sum of the upper and lower limb muscle mass by the square of the height (total kg of upper and lower limb muscle/m2).
Food logs
Three day food logs were recorded on two weekdays and one weekend of the subject’s choosing. One of the investigators instructed the subjects on how to properly record their food intake. All dietary log data were analysed by the same research personnel using the US Department of Agriculture SuperTracker (https://supertracker.usda.gov/). If the US Department of Agriculture SuperTracker could not provide nutrition information for a food, the official website of the food’s name brand was utilised. Values for macronutrients and kJ were expressed as g/kg per d and kJ/d, respectively. 24 h food logs were analysed using the same protocol following the completion of the study. In addition to food consumption, subjects were asked to record the estimated time they fell asleep and woke up before the second and third visit to determine hours slept before consumption of CP or PL.
Protein and placebo supplements
The CP was comprised of 33 g, 544 kJ, 25 g protein, 1·5 g fat, 3 g carbohydrate, 500 mg Ca, 95 mg Na, 45 mg K (Dymatize Nutrition Inc.) or a flavour-matched PL: 42 kJ, 7·2 g, Gum Arabic 5 g, Ultrasmooth 500 mg, Natural and Artificial Vanilla Flavour 960 mg, Sucralose 180 mg, KCl 80 mg, White Blend Opacifier Sensient 500 mg (Dymatize Nutrition Inc.). The PL was formulated to target the thickness, flavour and sweetness of the CP supplement and contained acacia gum at a level that would contribute to <42 kJ post-intestinal fermentation. The administered dose of 25 g was utilised as this amount of CP is a commonly recommended dose that is displayed on protein supplement labels. In addition, prior evidence has shown an effect of maltodextrin, a commonly used placebo, on next-morning RMR(Reference Madzima, Panton and Fretti1). Thus, we opted to use a non-nutritive placebo to help observe potential effects of CP. The supplement powders were pre-mixed with 12 oz of water in a shaker bottle and were delivered to subjects at their residence in an opaque container 1 h before their bedtime. Each subject was instructed to consume the supplement no less than 2 h after their last meal and no more than 30 min prior to getting into bed. Each subject was asked to go to bed at the same time the night before their second and third visits. A text message was sent after the delivery of the supplement to confirm appropriate ingestion time.
Visual analogue scales
On the second and third visits, subjects were asked to rate their feelings of hunger, satiety and desire to eat using a visual analogue scale when they first entered the laboratory. The visual analogue scale was a 10 cm horizontal scale with opposing extremes (‘not at all’ to ‘extremely’) of each appetite sensation located at each end of the 10 cm line. The subjects indicated their subjective feelings by placing a vertical line along the 10 cm scale. Each rating was converted to a score in cm using a standard ruler. Higher scores indicated greater feelings of each sensation.
Metabolic assessment
RMR and RER were measured using an open-circuit indirect calorimeter (ParvoMedics TrueOne 2400 metabolic cart) with a ventilated hood. Subjects rested in a semi-recumbent position within a dark, quiet and climate-controlled isolated room (20–23°C) with the ventilated hood covering their head and torso. Prior to testing, calibrations were performed on the flow metre and gas analysers using standard gases of known concentrations. Subject’s RMR and RER were measured continuously for 40 min, and the most stable 10 min segment was used for analysis. RMR was measured as VO2 and kJ/d.
Statistical analysis
Sample size calculation was based on the data collected by Madzima et al. who found a significant difference in RMR between CP and PL. Based an α of 0·05, a power of 80 % and an effect size of 1·1, seven subjects per group were needed for the study. Statistical analysis was performed using SPSS. Dependent variables of subject characteristics (age, anthropometrics, body composition by dual-energy X-ray absorptiometry and 3 d food logs) were analysed by one-way ANOVA to determine differences between pre- and postmenopausal women. The most stable 10 min period of the RMR measurement (RER, kJ/d, VO2) and measures of hunger, desire to eat and satiety were analysed using a 2 × 2 (group (pre- v. postmenopausal) × supplement (CP v. PL)) ANOVA. If there were group × supplement interactions, a Bonferroni post hoc test was used to analyse group and supplement differences. Significance was set at P ≤ 0·05, and data were reported as mean values and their standard deviations, unless otherwise noted.
Results
Nineteen sedentary women were originally recruited for the study (n 9 postmenopausal; n 10 premenopausal). Three postmenopausal women were unable to complete the study (n 1 scheduling conflict; n 1 due to claustrophobia caused by the ventilated hood; n 1 BMI over 35·0 kg/m2), and two premenopausal were unable to complete the study (n 1 due to modification of physical activity habits; n 1 due to scheduling conflicts). Thus, seven sedentary premenopausal and seven sedentary postmenopausal women completed the study. Subject characteristics are presented in Table 1. Age and waist circumferences were significantly different between pre- and postmenopausal subjects (P < 0·05). Body composition measures are presented in Table 2. Fat mass, android lean mass and android fat mass were significantly different between pre- and postmenopausal subjects (P < 0·05). There were no differences between variables of lean mass, gynoid fat mass, gynoid lean mass or appendicular skeletal muscle index.
Table 1. Subject characteristics
(Mean values and standard deviations, n 14)

* Mean value was significantly different from that of the premenopausal group (P ≤ 0·05).
Table 2. Body composition measures
(Mean values and standard deviations, n 14)
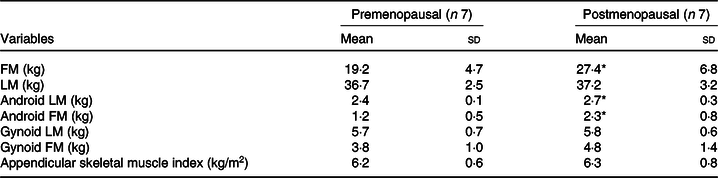
FM, fat mass; LM, lean mass.
* Mean value was significantly different from that of the premenopausal group (P ≤ 0·05).
Macronutrient and energy intakes based on 3 d food logs are displayed in Table 3. Measures of average daily protein, fat and total energy intake for the 3 d food logs were not significantly different between groups. However, carbohydrate intake was significantly higher in premenopausal women (P = 0·025).
Table 3. Macronutrient and energy intakes based on 3 d food logs†
(Mean values and standard deviations, n 14)

* Mean value was significantly different from that of the premenopausal group (P ≤ 0·05).
† Supplement(s) were not included in these results.
The metabolic responses of the subjects to the consumption of CP and PL are shown in Table 4. Excluding RMR (VO2), there were no significant group (pre- v. postmenopausal) by supplement (CP v. PL) interactions or main effects found. A main group effect for RMR (VO2) was found in premenopausal women after the consumption of CP and PL when compared with postmenopausal women (P = 0·003).
Table 4. Hours of sleep and metabolic responses to placebo (PL) and protein supplements in premenopausal v. postmenopausal women
(Mean values and standard deviations, n 14)
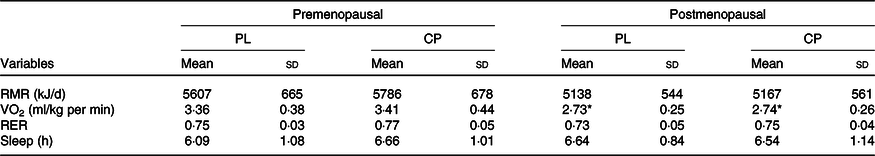
CP, casein protein.
* Mean value was significantly different from that of the premenopausal group (P ≤ 0·01).
Subjects’ perceived feelings of hunger, satiety and desire to eat are shown in Table 5. There were no significant group (pre- v. postmenopausal) by supplement (CP v. PL) interactions found for hunger (P = 0·64), satiety (P = 0·55) or desire to eat (P = 0·71).
Table 5. Visual analogue scale results for premenopausal v. postmenopausal women
(Mean values and standard deviations, n 14)
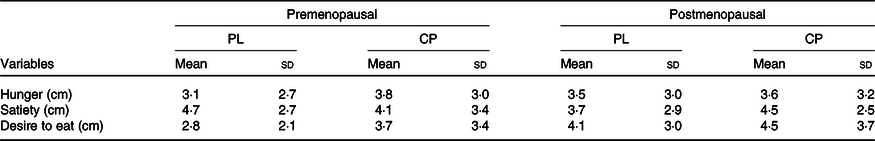
PL, placebo; CP, casein protein.
Discussion
The purpose of the present study was to compare the effects of night-time pre-sleep consumption of CP on the response of next-morning measures of RMR and appetite in sedentary pre- and postmenopausal women. To our knowledge, this is the first study to comapare the effects of night-time pre-sleep CP feeding on next-morning metabolism in sedentary pre- and postmenopausal women. Because of the noted impact of protein on satiety(Reference Halton and Hu16), the present study also sought to compare the effect of night-time pre-sleep protein consumption on next-morning measures of appetite in sedentary pre- and postmenopausal women.
The primary findings of the present study were that pre-sleep CP consumption did not significantly increase or change next-morning RMR (kJ/d, VO2) or hunger, satiety and desire to eat in sedentary pre- and postmenopausal women. Interestingly, premenopausal women had significantly higher RMR (VO2) under the PL and CP conditions than did postmenopausal women. Therefore, we accept the hypothesis that RMR would be higher in premenopausal women and reject the hypothesis that CP consumed prior to overnight sleep would increase next-morning RMR and produce a lesser elevation in RMR in postmenopausal women. We also reject the hypothesis that CP consumed pre-sleep would decrease morning measures of appetite in sedentary pre- and postmenopausal women.
Metabolic measures between placebo and casein protein
RMR (VO2) was significantly lower in postmenopausal women compared with premenopausal women under both PL and CP conditions (PL: about 8 % lower; CP about 11 % lower). This is in agreement with Hodson et al. (Reference Hodson, Harnden and Banerjee10) and Lovejoy et al. (Reference Lovejoy, Champagne and De Jonge11) who both found a nearly identical differences in RMR (about 7–9 %) when comparing pre- with postmenopausal women. Lower RMR in postmenopausal women is typically attributed to the loss of lean mass, but in the present study, lean mass was not significantly different between the two groups. Lovejoy et al. (Reference Lovejoy, Champagne and De Jonge11) reported similar findings and attributed the reduction of RMR to reductions in energy expenditure during the luteal phase of the menstrual cycle. An increase in RMR of about 37 kJ/min has been observed from the start of the luteal phase until menses and is related to an abrupt increase in progesterone production(Reference Solomon, Kurzer and Calloway25). Progesterone has been shown to elicit a hyperthermic effect that results in elevated RMR(Reference Barton and Wiesner26,Reference Kappas and Palmer27) . Because progesterone production ceases after menopause, the noted increase of RMR during the luteal phase is absent in postmenopausal women. It is possible that even though our population of postmenopausal women maintained lean mass, the absence of luteal phase RMR increase equated to a lower RMR overall.
In terms of CP, it was hypothesised that postmenopausal women would exhibit an elevation in next-morning RMR but it would be less than that of premenopausal women. When comparing the response to CP between groups, a lower response did not occur. Within each group, the response to CP and PL showed no significant difference across all metabolic measures. For postmenopausal women, this finding could be potentially explained by the effect of age on gastric emptying which ultimately influences DIT and has been shown to decline with age(Reference Kao, Lai and Wang28–Reference Moore, Tweedy and Christian30). Conceivably, a slower rate of gastric emptying would allow fewer nutrients to be absorbed over a set amount of time when compared with a faster rate. This would amount to a lower DIT response after food consumption. Du et al. (Reference Du, Rajjo, Santosa and Jensen31) supported this finding that adult males and females aged 60–88 years had a significantly reduced response of DIT after the consumption of a meal when compared with younger adult males and females aged 18–35 years. Ormsbee et al. (Reference Ormsbee, Gorman and Miller4) demonstrated that DIT can remain elevated for over 8 h in college-aged female runners after pre-sleep consumption of 355 ml of chocolate milk which contained about 10 g of casein protein. It would be expected that the group of postmenopausal women would show an elevation in RMR because their average sleep the night of CP consumption was 6·54 (sd 1·14) h. However, ageing could have slowed gastric emptying and made fewer nutrients available for absorption during this time span. It is possible that this caused DIT to be significantly impaired to the point of showing little to no change in RMR.
It should also be noted that doses of CP < 40 g may not be enough to simulate overnight MPS(Reference Ormsbee, Kinsey and Eddy3,Reference Trommelen, Kouw and Holwerda32) . Conceivably, an increase in MPS could augment RMR. Thus, a lack of elevated overnight MPS may explain our lack of findings for next-morning RMR. Trommelen et al. (Reference Trommelen, Kouw and Holwerda32) demonstrated that 30 g of CP did not increase overnight MPS, while 40 g of CP did in healthy young men. Similar results were also reported by Madzima et al. (Reference Madzima, Melanson and Black2) who demonstrated that consumption of a night-time pre-sleep 48 g dose of CP increased next-morning RMR in premenopausal women compared with a 24 g dose of CP. Differences in dosing are particularly relevant to our group of postmenopausal women as ageing may warrant the need for a higher dose of CP to stimulate overnight MPS(Reference Kouw, Holwerda and Trommelen33). In addition, higher levels of overnight MPS may be associated with greater protein intake per kg body weight(Reference Snijders, Trommelen and Kouw34). Because the same dose was used in both groups, the greater body weight of the postmenopausal women resulted in a lower increase of relative protein intake per kg body weight. Overall, it is possible that the use of ≥40 g of CP may have augmented overnight MPS in our groups of pre- and postmenopausal women, potentially elevating next-morning RMR.
There was no significant group (pre- v. postmenopausal) by supplement (CP v. PL) interactions found for RER. Previously, it has been reported that night-time pre-sleep consumption of CP had no effect on next-morning RER(Reference Madzima, Panton and Fretti1–Reference Ormsbee, Gorman and Miller4). Our results support this finding, which are further supported by Kinsey et al. (Reference Kinsey, Cappadona and Panton6) who reported no changes in next-morning lipolysis with pre-sleep consumption of CP. Taken together, our findings demonstrate that pre-sleep consumption of CP does not have an effect on next-morning RMR or RER. However, it should be noted that our findings do not address changes occurring during the overnight period. RMR and RER are largely unexplored in this setting, and it is possible that pre-sleep consumption of CP may cause an effect during this time that is undetectable in the morning upon waking.
Measures of appetite (hunger, satiety and desire to eat) were not significantly different between or within groups for CP and PL. Other studies using higher doses (30–40 g) of CP have reported similar findings in premenopausal women and college-aged males(Reference Madzima, Melanson and Black2,Reference Leyh, Willingham and Baur8,Reference Trommelen, Kouw and Holwerda32) . However, our results are the first to show next-morning appetite response in postmenopausal women. In relation to both groups, lack of appetite response may relate to elevated habitual protein intake (>0·8 g/kg per d). Evidence suggests a lesser satiety response to a single-protein meal in those who consume elevated levels of protein(Reference Long, Jeffcoat and Millward35). It is also possible that our study was underpowered to detect appetite changes although others have found changes with similar and smaller sample sizes(Reference Ormsbee, Gorman and Miller4,Reference Kinsey, Cappadona and Panton6,Reference Horner, Byrne and King36) .
Dietary intake between pre- and postmenopausal women
Total energy, protein and fat were not significantly different between groups. However, carbohydrate intake was significantly higher in premenopausal women (premenopausal: 3·4 (sd 0·6) g/kg per d v. postmenopausal: 2·5 (sd 0·3) g/kg per d). While Hodson et al. (Reference Hodson, Harnden and Banerjee10) did not find significant differences in carbohydrate intake (premenopausal: 3·28 g/kg per d v. postmenopausal: 3·29 g/kg per d, P = 0·48), no significant differences were found for average daily energy intake (premenopausal: 8134 kJ/d v. postmenopausal: 7314 kJ/d, P = 0·07), fat (premenopausal: 1·11 g/kg per d v. postmenopausal: 1·02 g/kg per d, P = 0·17) and protein (premenopausal: 1·10 g/d v. postmenopausal: 1·03 g/kg per d). It is interesting to note that the energy intake of both groups was below what was reported by Hodson et al. (Reference Hodson, Harnden and Banerjee10) Low-energy intakes are most likely explained by the underreporting of food intake. In the case of postmenopausal subjects, evidence suggests a positive relationship between BMI and underreporting of energy intake(Reference Goris, Westerterp-Plantenga and Westerterp37,Reference Goris and Westerterp38) . Nevertheless, energy intake was not significantly different between groups signifying that our postmenopausal subjects may not reduce energy intake as others have reported(Reference Hodson, Harnden and Banerjee10,Reference Lovejoy, Champagne and De Jonge11) .
Body composition in pre- and postmenopausal women
There were no differences between groups for lean mass. This is probably explained by the greater BMI of the postmenopausal subjects compared with the premenopausal subjects. Higher BMI is associated with higher amounts of lean mass as more lean mass is required to ambulate at a greater body weight(Reference Iannuzzi-Sucich, Prestwood and Kenny39,Reference Kanehisa and Fukunaga40) . Potentially, the higher BMI in postmenopausal women helped to prevent the reductions in lean mass that others have observed. In addition, while our sample size was small, the age of our postmenopausal group may have affected lean mass. Trémollieres et al. (Reference Trémollieres, Pouilles and Ribot41) found that women who were postmenopausal and <60 years of age did not have significantly different lean mass when compared with premenopausal women who were 45–56 years of age. However, postmenopausal women >60 years of age had significantly less lean mass when compared with premenopausal women.
Limitations
Some limitations in our study exist. Mean time since menopause was not recorded. Some evidence suggests the greatest loss of lean mass occurs after the first 3 years of menopause(Reference Aloia, McGowan and Vaswani42). Thus, if our subjects were not ≥3 years post-menses, lean mass may have been preserved. We also placed no restrictions on how subjects could travel to each appointment nor did we confirm if the blinding of the drinks was successful. However, no subject reported a taste or sensory difference, although no specific questionnaire was used to confirm this. In addition, we did not have subjects spend the night in the laboratory, and therefore, activity and food consumption were not controlled. However, all subjects confirmed that they followed the protocols given to them. In both groups of subjects, the time slept was self-reported, and therefore, quantity and quality of sleep were not objectively measured. As noted by Knutson et al. (Reference Knutson, Spiegel and Penev43), loss of sleep can potentially lead to a reduction in RMR.
Future research should examine how different doses of CP affect morning measures of RMR and appetite. The previously mentioned studies by Trommelen et al. (Reference Trommelen, Kouw and Holwerda32) and Madzima et al. (Reference Madzima, Melanson and Black2) give reason to believe that a higher dose of protein may cause significant differences in measures of appetite and RMR. Additionally, the potential for reduction in the rate of gastric emptying in postmenopausal women makes it possible that a higher dose of protein could cause significant changes in RMR. Based on previous work by Madzima et al. (Reference Madzima, Panton and Fretti1), it should be considered how different types of protein and complex carbohydrates individually affect RMR and appetite. Madzima et al. (Reference Madzima, Panton and Fretti1) found that responses in appetite and RMR did not vary among carbohydrate, whey protein and CP. However, it remains uncertain if the same applies after during and after menopause. Finally, it would be interesting to evaluate how mixed macronutrients and whole foods effect physiological outcomes in these populations.
Conclusions
To our knowledge, this is the first study to compare the effects of night-time pre-sleep consumption of CP on next-morning metabolic and appetite responses in pre- and postmenopausal women. Postmenopausal women did not have different next-morning metabolic and appetite responses than what have been observed in premenopausal women in response to pre-sleep CP consumption. Although CP showed no metabolic or appetite benefits in either group, it is possible that an increase of protein in the diet could lead to beneficial health outcomes over time. Overall, the findings of our study support the growing evidence that pre-sleep consumption of snack-sized portions of CP (544–628 kJ) is not harmful to next-morning metabolism or appetite.
Acknowledgements
The authors thank the participants for their dedication and participation in the present study.
The present study was supported in kind with supplement product from Dymatize Nutrition Inc.
M. J. O. and L. B. P. conceived and designed the study, oversaw data collection, data analysis and manuscript preparation. M. J. O. also secured support for the project. C. M. S. carried out participant recruitment, data collection and analysis and assisted with manuscript preparation. C. L. P. assisted with attainment of dual-energy X-ray absorptiometry prescriptions, execution and analysis. J. T. L. assisted with participant recruitment and data analysis.
The authors have no financial or other interests concerning the outcome of the investigation. M. J. O. is on the advisory board Dymatize Nutrition and the International Protein Board. All other authors declare that they have no competing interests.


