


Over recent years it has become clear that the diagnosis of clinical dementia occurs at the end of a prodromal period which extends over several decades. Furthermore, numerous lifestyle and clinical risk factors occurring during the adult life course can act to influence the risk of developing dementia in older age. Exposure to such risk factors may similarly occur over many decades.Reference Livingston, Sommerlad, Orgeta, Costafreda, Huntley and Ames1,Reference Prince, Albanese, Guerchet and Prina2 A life-course perspective is essential.Reference Gustafson3 The patterns of the risk factors change over the life course (e.g. increasing or decreasing exposure). Subclinical pathology may influence risk factors (directly or indirectly) over the life course, e.g. reduced homeostatic control mechanisms, loss of appetite and weight loss. Methodologically, the combined risk of mixed populations and shorter-term studies of older adults may bring confounding, e.g. those with recent weight loss or gain alongside those sustaining a stable weight.
To be able to stratify by risk and to target at-risk groups we need to understand the relationship between risk-factor levels (e.g. higher or lower blood pressure), their trajectory and change over the life course, from early and mid- to late life, and the risk of incident cognitive decline or dementia. An increasing number of studies have adopted this approach for three of the core risk factors: blood pressure, cholesterol and obesity. When present in midlife all three risk factors have been associated with an increased risk of late-life cognitive decline and dementia (see comprehensive reviews by Alzheimer's Disease International and the Lancet).Reference Livingston, Sommerlad, Orgeta, Costafreda, Huntley and Ames1,Reference Prince, Albanese, Guerchet and Prina2 Data on exposure to high blood pressure, obesity and cholesterol in late life are more mixed.Reference Livingston, Sommerlad, Orgeta, Costafreda, Huntley and Ames1,Reference Prince, Albanese, Guerchet and Prina2 This raises questions relating to the need to understand trajectories of exposure to risk factors over the life course, for these three risk factors in particular. To begin to generate hypotheses relating to the pattern of risk-factor trajectory change and risk of cognitive decline and dementia, we systematically review and summarise the existing longitudinal observational studies reporting on trajectories of change in blood pressure, cholesterol and obesity from midlife (~40 to ~65 years), and subsequent late-life cognitive decline or dementia.
Methods
To ensure a robust and thorough overview of the literature we used systematic review techniques to search, select, extract and evaluate data from the published literature.
The databases MEDLINE, Embase and PsycINFO were searched from inception to 26 April 2018. Details of the search strategies are given in Supplementary Text 1 available at https://doi.org/10.1192/bjp.2019.156. Reference lists were also screened for other published papers. There were two analysts (R.P. and J.P.). The lead analyst (R.P.) carried out the literature searches. All identified abstracts, or titles where abstracts were unavailable, were independently read by both analysts and a list of papers potentially meeting the inclusion criteria was compiled by each analyst. The lists were then compared and any differences resolved by discussion. Once a list of full-text publications was agreed these were also read and assessed for relevance independently by both analysts. Any differences were again resolved by discussion.
Inclusion criteria
The inclusion criteria were as follows:
(a) longitudinal observational studies where the independent variable relating to one of the three risk factors (blood pressure, cholesterol and obesity) has been assessed in terms of trajectory or change over time;
(b) repeated risk-factor data from at least three different time points;
(c) follow-up longer than one year;
(d) some indication, or clear implication, that participants were free of cognitive decline or dementia at baseline assessment;
(e) use of formal assessment of cognitive function to report on cognitive change or cognitive decline; and/or
(f) report of incident dementia outcomes (from medical records or where studies used standard diagnostic criteria).
Exclusion criteria
The exclusion criteria were as follows:
(a) non-English publications (in the absence of resources available for translation);
(b) paediatric or teenage populations;
(c) use of single aggregate measures of exposure that allow no assessment of change (e.g. an average value derived from several visits).
Data analysis
Data from the relevant identified full-text articles were extracted onto a standard extraction sheet and included information on study design, participant sample size, age, proportion of sample who were female, mean follow-up or details of study visits, the number of visits used to examine the trajectory of the risk factor, methods of analysis, measure of risk factor, measure of outcome, covariates used and results. Where a single study had generated more than one publication reporting on trajectories, the most recent was selected unless the results were representing different end-points or different analyses in which case both were extracted for completeness.
To assess the quality of each paper in terms of its validity a formal scoring scheme was not used as these hold poor discriminant ability when assessing quality. Instead, each paper was assessed against the key questions adapted from the Critical Appraisal Skills Programme cohort checklist (https://casp-uk.net/casp-tools-checklists/) and, in particular, included assessment of bias in evaluation of exposure, outcome assessment and follow-up and the results of this assessment were tabulated. Data are presented in extraction tables. The study characteristics and results presented in the tables are standardised as much as possible given their varied representation in the source publications. We included articles where no specific trajectory-based analysis was described but where articles described graphical or numerical analyses that provide potential description of trajectories relating to dependent cognitive variables. In the absence of data allowing meta-analysis, narrative synthesis and an illustrative figure has been used to summarise the results. The search strategy, assessment of bias and other review methods were defined a priori and the protocol was registered with PROSPERO: CRD42018091350. This work used published data therefore ethical approval was not required.
Results
Identification of eligible studies
Blood pressure
Searches identified 1672 unique records, of which 52 were assessed at the full-text stage and 6 publications (5 studies) were retained (see the flow chart in Supplementary Fig. 1). Exclusion at this stage was because of the potential for the inclusion of prevalent cases (n = 2), a lack of data on trajectory of blood pressure and cognitive outcomes (n = 42) and a lack of appropriate cognitive measures (n = 2).
Cholesterol
Searches identified 1988 unique records, of which 20 were assessed at the full-text stage and 3 publications (3 studies) were retained (see the flow chart in Supplementary Fig. 2). Exclusion at this stage was because of the potential for the inclusion of prevalent cases (n = 3) and a lack of data on trajectory of cholesterol and cognitive outcomes (n = 14).
Obesity
Searches identified 4880 unique records, of which 35 were assessed at the full-text stage and 4 publications (4 studies) were retained (see the flow chart in Supplementary Fig. 3). Exclusion at this stage was because of the potential for the inclusion of prevalent cases (n = 1) and a lack of data on trajectory of obesity and cognitive outcomes (n = 30). To allow comparable reporting across studies, body mass index (BMI) was selected as representing the most commonly reported measure of obesity.
Characteristics of the included studies
For the full study characteristics, see Table 1.
Table 1 Study characteristics
AD, Alzheimer's disease; BMI, body mass index; BP, blood pressure in millimetres of mercury (mmHg); EPESE, East Boston Established Populations of Epidemiologic Studies of the Elderly; FU, follow up; HAAS, Honolulu Asia Aging Study; ILSE, Interdisciplinary Longitudinal Study on Adult Development and Aging; MCI, mild cognitive impairment; s.d., standard deviation; SBP, systolic blood pressure.
Blood pressure
Studies were recruited from North American, Japanese American and European populations.Reference Joas, Backman, Gustafson, Ostling, Waern and Guo4–Reference Stewart, Xue, Masaki, Petrovitch, Ross and White9 Two studies began in midlife,Reference Joas, Backman, Gustafson, Ostling, Waern and Guo4,Reference Stewart, Xue, Masaki, Petrovitch, Ross and White9 the remainder began in later life.Reference Li, Rhew, Shofer, Kukull, Breitner and Peskind5–Reference Qiu, Winblad and Fratiglioni8 Follow-up ranged from approximately 6 yearsReference Li, Rhew, Shofer, Kukull, Breitner and Peskind5–Reference Qiu, von Strauss, Winblad and Fratiglioni7 to over 30 years.Reference Joas, Backman, Gustafson, Ostling, Waern and Guo4,Reference Stewart, Xue, Masaki, Petrovitch, Ross and White9
Cholesterol
Studies were recruited from Japanese American and European populations.Reference Mielke, Zandi, Shao, Waern, Ostling and Guo10–Reference Toro, Degen, Pierer, Gustafson, Schroder and Schonknecht12 Two studies began in midlifeReference Mielke, Zandi, Shao, Waern, Ostling and Guo10,Reference Stewart, White, Xue and Launer11 and one in later life.Reference Toro, Degen, Pierer, Gustafson, Schroder and Schonknecht12 Follow-up ranged from approximately 10 yearsReference Toro, Degen, Pierer, Gustafson, Schroder and Schonknecht12 to approximately 30 years.Reference Mielke, Zandi, Shao, Waern, Ostling and Guo10,Reference Stewart, White, Xue and Launer11
Obesity
Studies were recruited from North American, Japanese American and European populations.Reference Gao, Nguyen, Hendrie, Unverzagt, Hake and Smith-Gamble13–Reference Stewart, Masaki, Xue, Peila, Petrovitch and White16 Three studies began in midlifeReference Gustafson, Backman, Joas, Waern, Ostling and Guo14–Reference Stewart, Masaki, Xue, Peila, Petrovitch and White16 and one in later life.Reference Gao, Nguyen, Hendrie, Unverzagt, Hake and Smith-Gamble13 Follow-up ranged from approximately 6 yearsReference Gao, Nguyen, Hendrie, Unverzagt, Hake and Smith-Gamble13 to approximately 25–30 years.Reference Gustafson, Backman, Joas, Waern, Ostling and Guo14–Reference Stewart, Masaki, Xue, Peila, Petrovitch and White16
Trajectories of risk factors and cognitive and/or dementia outcomes
In the absence of suitable data for meta-analysis, narrative synthesis is used to describe the overall results. In general, studies found that the levels of each risk factor rose with increasing age up to late midlife, for cholesterol, and to early/mid-late life for BMI and blood pressure, after which levels fell. For blood pressure and BMI, those who went on to develop dementia or cognitive decline generally showed higher baseline levels of each risk factor, a steeper rise and faster fall. The data were less specific for cholesterol. Figure 1 is an illustrative drawing to represent the general trajectories for each risk factor.
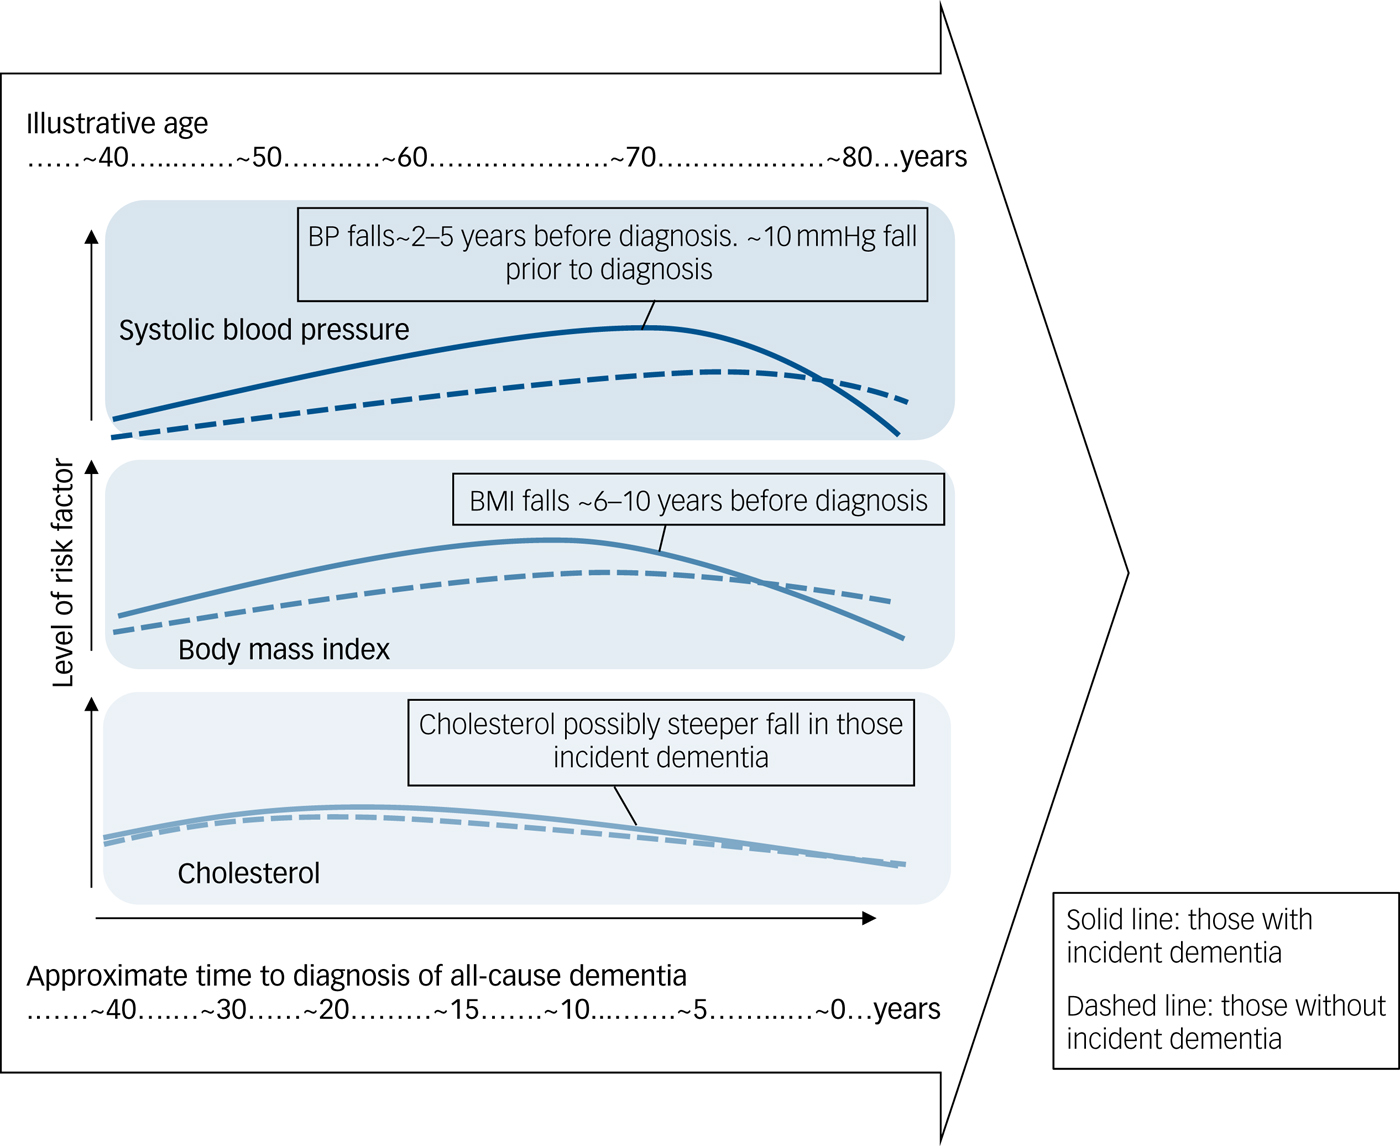
Fig. 1 Illustrative representation of trajectories.
Blood pressure
Table 2 gives the results for blood pressure as the independent variable. Four studies reported on incident all-cause dementia: the Kungsholmen Project, the Honolulu-Asia Aging Study (HAAS), the Prospective Population Study of Women in Gothenburg (PPSW) and the Adult Changes in Thought (ACT) study.Reference Joas, Backman, Gustafson, Ostling, Waern and Guo4,Reference Li, Rhew, Shofer, Kukull, Breitner and Peskind5,Reference Qiu, von Strauss, Winblad and Fratiglioni7–Reference Stewart, Xue, Masaki, Petrovitch, Ross and White9 Data from the Kungsholmen Project in Sweden were reported in two publications from 2004 and 2009, with the latter reporting longer follow-up. The Kungsholmen analyses consistently showed steeper blood pressure fall in those that went on to develop all-cause dementia in the 2–3 years before diagnosis, with a similar pattern for both systolic and diastolic pressure.Reference Li, Rhew, Shofer, Kukull, Breitner and Peskind5,Reference Qiu, Winblad and Fratiglioni8 The HAAS reported a steeper rise in systolic blood pressure with age followed by a steeper fall after ~78 years in those who went on to develop dementia.Reference Stewart, Xue, Masaki, Petrovitch, Ross and White9 Patterns for diastolic pressure were similar but less strong.Reference Stewart, Xue, Masaki, Petrovitch, Ross and White9 The PPSW study showed a similar pattern overall but also found that those taking antihypertensive treatment had a steeper rise in systolic blood pressure with a sharper and earlier fall (~69 rather than ~77 years) compared with those without treatment.Reference Joas, Backman, Gustafson, Ostling, Waern and Guo4 The ACT study found that participants aged <75 who went on to develop dementia had higher systolic blood pressure and that this fell more sharply in the final 2 years before diagnosis, when compared with those without all-cause dementia. For those aged 75 or older, there was no blood pressure difference between those who did or did not develop dementia.Reference Li, Rhew, Shofer, Kukull, Breitner and Peskind5
Table 2 Study results for blood pressure
AD, Alzheimer's disease; BP, blood pressure in millimetres of mercury (mmHg); DBP, diastolic blood pressure; EPESE, East Boston Established Populations of Epi-demiologic Studies of the Elderly; HAAS, Honolulu Asia Ageing Study; OR, odds ratio; SBP, systolic blood pressure; VaD, vascular dementia; CI, confidence interval.
a. Qiu et al, 2004 and Qiu et al, 2009 both report on data from the Kungsholmen longitudinal study. As Qiu et al, 2004 reports numerical results and Qiu et al, 2009 reports graphical results, both are represented in this table.
a. For the full version of this table, see Supplementary Table 1.
Three studies reported results for incident Alzheimer's disease: HAAS,Reference Stewart, Xue, Masaki, Petrovitch, Ross and White9 PPSWReference Joas, Backman, Gustafson, Ostling, Waern and Guo4 and the East Boston Established Populations of Epidemiologic Studies of the Elderly (EPESE).Reference Morris, Scherr, Hebert, Glynn, Bennett and Evans6 The HAAS found a sharper fall in those who went on to develop all-cause and vascular dementia, with the strongest relationship occurring for Alzheimer's disease and vascular dementia.Reference Stewart, Xue, Masaki, Petrovitch, Ross and White9 The PPSW reported a similar pattern for Alzheimer's disease to that seen in all-cause dementia;Reference Joas, Backman, Gustafson, Ostling, Waern and Guo4 in contrast, the EPESE study found no relationship between blood pressure trajectory and incident Alzheimer's disease.Reference Morris, Scherr, Hebert, Glynn, Bennett and Evans6
Cholesterol
Table 3 gives the results for cholesterol as the independent variable. Two studies reported on incident all-cause dementia: the HAAS and the PPSW.Reference Mielke, Zandi, Shao, Waern, Ostling and Guo10,Reference Stewart, White, Xue and Launer11 The HAAS also reported on Alzheimer's disease and vascular dementia. One study, the Interdisciplinary Longitudinal Study on Adult Development and Aging (ILSE), reported on Alzheimer's disease and mild cognitive impairment (MCI).Reference Toro, Degen, Pierer, Gustafson, Schroder and Schonknecht12 The PPSW and ILSE both reported cholesterol levels as rising and then falling from mid- to late life, with slightly higher baseline cholesterol levels and slightly steeper falls in the group who went on to develop dementia, Alzheimer's disease and MCI, with the highest values occurring around age 60. The HAAS, in contrast, reported total cholesterol as consistently lower in those men who went on to develop dementia;Reference Stewart, White, Xue and Launer11 however, their graphical representation suggests the possibility of a steeper fall in those who developed all-cause dementia with a similar pattern for Alzheimer's disease and vascular dementia.Reference Stewart, White, Xue and Launer11 They conclude that cholesterol levels declined at least 15 years before diagnosis.
Table 3 Study results for cholesterol
MCI, mild cognitive impairment; ANOVA, analysis of variance; NINCDS-ADRDA, National Institute of Neurological and Communicative Diseases and Stroke/Alzheimer's Disease and Related Disorders Association; NINDS-AIREN, National Institute of Neurological Disorders and Stroke and the Association Internationale pour la Recherche et l'Enseignement en Neurosciences; TC, total cholesterol; HR, hazard ratio; BMI, body mass index.
Obesity (BMI)
Table 4 gives the results for BMI as the independent variable. Four studies reported incident dementia: the HAAS, PPSW, the Indianapolis-Ibadan Dementia Project (Ibadan) and the Whitehall II Study.Reference Gao, Nguyen, Hendrie, Unverzagt, Hake and Smith-Gamble13–Reference Stewart, Masaki, Xue, Peila, Petrovitch and White16 Stewart et al (HAAS) also reported on Alzheimer's disease and vascular dementiaReference Stewart, Masaki, Xue, Peila, Petrovitch and White16 and Gao et al (Ibadan) on incident MCI.Reference Gao, Nguyen, Hendrie, Unverzagt, Hake and Smith-Gamble13 The Ibadan study and Whitehall studies found steeper declines in BMI in those that went on to develop dementia. For the Ibadan study the decline started around 10 years before diagnosis and became statistically significant by 6 years, whereas for the Whitehall II study the decline started approximately 8 years before diagnosis.Reference Gao, Nguyen, Hendrie, Unverzagt, Hake and Smith-Gamble13,Reference Singh-Manoux, Dugravot, Shipley, Brunner, Elbaz and Sabia15 Similar patterns were seen in the Ibadan study for MCI. In the HAAS, Japanese American men with incident dementia also had a higher midlife BMI and a sharper fall in late life than those who did not develop dementia. This was particularly pronounced for vascular dementia but less clear for Alzheimer's disease.Reference Stewart, Masaki, Xue, Peila, Petrovitch and White16 Swedish women also showed a similarly greater increase in BMI from mid- to late life and sharper fall in those who developed dementia, with age 70 selected as the pivotal point.Reference Gustafson, Backman, Joas, Waern, Ostling and Guo14
Table 4 Study results for body mass index
BMI, body mass index; NINCDS-ADRDA, National Institute of Neurological and Communicative Diseases and Stroke/Alzheimer's Disease and Related Disorders Association; MCI, mild cognitive impairment.
Risk of bias
Overall the risk of bias in the included studies was low to moderate and most studies recruited from population samples and assessed all risk-factor exposures, using standard measurement methods. Outcome measures were also based on standard criteria with a generally low risk of bias although the criteria used for identification of all-cause dementia, Alzheimer's disease, vascular dementia and MCI varied. Studies reported follow-up times of sufficient length to assess incident dementia. However, in some cases it was unclear how many visits each participant had contributed and how many participants were included in each analysis or within the graphical representation of the trajectories analysis. For details of the risk of bias assessment, see Supplementary Tables 2–4. As in any review, sources of bias may be associated with variation in study design, together with visit frequency and choice of analysis methods. To reduce the potential risk of bias incurred by the selection of studies with a minimum of three time points, a sensitivity analysis was carried out to examine the results of similar longitudinal studies reporting only two time points for the assessment of trajectory. All abstracts were re-reviewed and a further 16 articles extracted. No clear pattern was seen in the studies using only two time points. There was also no indication that excluding these articles could have contributed to bias in our results.
Discussion
Several well-established longitudinal studies have reported on the relationships between the trajectory of change over time in levels of blood pressure, cholesterol and obesity (assessed using BMI) and incident all-cause dementia, with some additionally reporting on Alzheimer's disease, vascular dementia and MCI. The pattern of results from the studies is similar, with those who went on to develop all-cause dementia showing a greater increase followed by a sharper decrease in blood pressure and/or BMI before a positive diagnosis. The pattern for cholesterol was less clear but still suggested a fall in cholesterol level in later life that may be greater in those who developed dementia.
The results for Alzheimer's disease, vascular dementia and MCI were similar but with fewer data points.
The results are congruent with emerging literature showing an association between steeper falls in blood pressure in late life and increased risk of infarctsReference Arvanitakis, Capuano, Lamar, Shah, Barnes and Bennett17 and an established literature showing associations for low blood pressure and low weight in older age with an increased risk of dementia or cognitive decline.Reference Anstey, Cherbuin, Budge and Young18–Reference Pedditizi, Peters and Beckett20 It also suggests that these at-risk individuals are those who had higher blood pressure, weight and higher cholesterol in midlife and that it is the trajectory of change rather than the current blood pressure or weight that is potentially most useful in identifying those who are more likely to receive a subsequent diagnosis of cognitive decline or dementia. Causality is less clear. Although raised blood pressure, BMI and cholesterol have been associated with an increased risk of later dementia,Reference Prince, Albanese, Guerchet and Prina2 we cannot infer any causal relationships between risk-factor trajectories and dementia. In fact, the reverse may be the case since dementia is known to have a decades-long prodromal period. Dementia pathology, particularly Alzheimer's disease pathology, has been observed 20 years before diagnosis.Reference Jack, Knopman, Jagust, Shaw, Aisen and Weiner21 A further possibility is that some as-yet-unmeasured factor may have a causal relationship with both risk-factor change and dementia pathology. Such pathology may have a direct impact on regulation of biomarkers like blood pressure but may also have indirect effects, for example behaviour change may occur around 15–20 years before diagnosis, with increasing apathy and changes in social engagement, smell, appetite and an increased need for caregiving and support with medical and lifestyle factors as the disease progresses.Reference Balsis, Carpenter and Storandt22 This in turn may also be associated with weight loss and fall in blood pressure.Reference Balsis, Carpenter and Storandt22
Our review has several strengths: it is the first such review to take a life-course approach and to collate longitudinal observational studies reporting on trajectories of exposure to risk factors. In doing so it may allow us to more confidently identify populations in the prodromal stages of developing dementia and to plan future studies to examine the impact of potential interventions. The lack of a detailed knowledge of risk-factor behaviour over the life course not only hampers our ability to develop targeted clinical and public health guidelines and interventions but also limits our ability to contextualise reports of changing dementia prevalence.Reference Anstey and Peters23 Furthermore, it restricts our ability to make the necessary healthcare, economic and societal predictions for future burden of disease. This review has advanced our knowledge and understanding of available evidence in this area.
Limitations inevitably include the limited quantity and quality of included studies, the inevitable variation in study populations, length of follow-up, risk of attrition, the use of varied statistical techniques in the published articles precluding meta-analysis, the varied reporting of study results and the lack of granular or detailed data allowing a more sophisticated understanding of exposure to risk-factor trajectories. In particular, a lack of comparable cognitive testing across studies with different frequencies of assessment and the use of generic screening instruments rather than sophisticated neuropsychological batteries may mean that the identification and classification of cognitive decline or dementia may differ. This may have resulted in similarly labelled groups exhibiting more or less severe decline than others, further reducing our ability to compare risk-factor trajectories before diagnosis. Furthermore, due to less data on specific dementia types and the likelihood of mixed pathology in the majority of individuals with later-onset dementia, we are unable to unpick the relative contributions that different pathology types might make to risk-factor trajectory or to the relationship between trajectory and cognition. The evidence in this area could also be further strengthened by the evaluation of trajectories in other long-term longitudinal observational studies and exploration of populations by subgroups such as gender, ethnic group or presence of APOE E4. Reference Bäckman, Joas, Waern, Ostling, Guo and Blennow24,Reference Scuteri, Najjar, Muller, Andres, Morrell and Zonderman25
These data suggest that BMI falls first, around 10 years prior to diagnosis of dementia, followed by blood pressure which falls around 5 years prior. Future analyses should examine sequential and simultaneous changes in multiple risk-factor trajectories from mid to late life and how this relates to long-term risk of dementia. An understanding of the patterns and trajectories of change in those who do and do not develop dementia will add to our understanding of the role of risk factors across the life course and may facilitate early identification of those most at risk, particularly where repeated measures are common, for example, in general practice. Characterisation of risk of dementia according to combinations and patterns of risk factors may ultimately be required as part of a battery of assessments to identify those at increased risk of dementia in late life.
Current issues, opportunities and implications for research
The global ageing population brings an associated need to understand the antecedents of successful ageing. An understanding of the life-course trajectory for factors that influence cognitive ageing is needed, not least to support the identification and testing of potential interventions that may reduce risk and/or ways to promote healthy brain ageing. It may also go some way towards disentangling the varied associations reported for risk-factor exposure and cognitive function in later life. For example, where some studies report associations between high and some between low blood pressure and cognitive impairment in later life.Reference Kennelly, Lawlor and Kenny19
Fully exploring this area requires sophisticated analysis with a minimum of three, but preferably more, repeated measures over follow-up from mid- to late life. Although the current evidence base is limited, the many multi-visit repeated measures longitudinal cohort studies in existence mean that there remains considerable potential for further exploration and evaluation. In examining the patterns and trajectories of the established risk factors for cognitive decline and dementia, this review provides the first overview of an emerging area. By necessity, the review takes a focus on three risk factors, however future work could feasibly include greater numbers of risk factors and the interaction between them and may eventually lead to personalised risk assessments and targeted interventions early in the asymptomatic, prodromal phase of cognitive decline and dementia.
Supplementary material
Supplementary material is available online at https://doi.org/10.1192/bjp.2019.156.
Funding
No funding was received directly for this work. All authors receive funding from various sources. R.P. was funded by the Australian National Health and Medical Research Council (NHMRC) National Institute for Dementia Research, Dementia Collaborative Research Centre at the time the work took place. K.J.A. is funded by NHMRC fellowship 1102694. We acknowledge support from the NHMRC Centre of Excellence in Cognitive Health and the Australian Research Council Centre of Excellence in Population Ageing.


eLetters
No eLetters have been published for this article.