


1. Introduction
The drainage of water from the surface to the bed of an ice sheet or glacier takes two primary forms. The first is via moulins, which are narrow features (often less than 5 m in diameter at the surface) that drain water during the melt season, activating when melt begins in the spring and shut down, and potentially partially closing, once surface melt ceases (Hoffman and others, Reference Hoffman2018; Andrews and others, Reference Andrews, Poinar and Trunz2022). Melt volumes into moulins vary depending on the glacial system, the surface melt rate and the catchment size. However, the meltwater discharge from surface channels into moulins tend to be <40 m3 s−1 (e.g. Gleason and others, Reference Gleason2021; Hill and Dow, Reference Hill and Dow2021), which is then delivered into the basal drainage system. The addition of water to the ice-sheet base by moulins causes pressurization, minor uplift of the ice surface and ice flow acceleration, particularly at the beginning of the melt season in regions where the basal drainage efficiency has not yet evolved (Iken, Reference Iken1981; Walder, Reference Walder1986; Banwell and others, Reference Banwell, Hewitt, Willis and Arnold2016).
The second type of surface-to-bed drainage is through rapid hydrofracturing and drainage of crevasses or surface lakes to the bed. Hydrofracture of crevasses not associated with lake drainage can either be isolated events with minimal longer-term impact on ice dynamics, or allow the formation of a new moulin (Chudley and others, Reference Chudley2021). During rapid supraglacial lake drainage, the rates of water input to the ice-sheet base are much higher than for single moulins fed by surface melting alone, although potentially less than integrated moulin drainage over a larger region (see e.g. Smith and others, Reference Smith2015). For example, North Lake on the western margin of the Greenland Ice Sheet (GrIS) drained at an average rate of 8700 m3 s−1 in <2 h (Das and others, Reference Das2008). The rapid input of such large volumes of water to the base of the ice causes significant pressurization, ice uplift on the order of >1 m and ice acceleration as basal friction is locally reduced (Das and others, Reference Das2008). This phenomenon has been referred to as a water blister and involves pressurized water spreading out radially from the hydrofracture as opposed to being directed downstream. The size of the blister is likely driven by the basal topography; at North Lake, a blister radius of ~2.5 km was recorded by a series of GPS receivers positioned around the drainage feature (Stevens and others, Reference Stevens2015).
The formation of a subglacial water blister was examined with the drainage of Lake F located on Russell Glacier on the GrIS, 70 km from the ice margin (Doyle and others, Reference Doyle2013). The ice thickness in this region was ~1200 m when the surface lake drained in 2 h and 10 min, pumping ~7.4 million cubic meters to the bed at a maximum rate of 3300 m3 s−1 (Doyle and others, Reference Doyle2013). Following the approaches of Tsai and Rice (Reference Tsai and Rice2012), the expansion of a water blister to a maximum radius of 2.8 km at Lake F was modeled by Dow and others (Reference Dow2015). Expansion of the blister during this lake drainage occurred at a rate of 1.7 m s−1 and the maximum radius was reached 30 min after lake drainage began. Downstream hydrology, which was simultaneously modeled to record the drainage of the blister, was found to be highly pressurized with limited efficiency over the 30 days following lake drainage. Active seismic-reflection lines collected immediately downstream of the lake demonstrated the presence of stiff sediment with a low water content (Kulessa and others, Reference Kulessa2017). The authors argued that the repeated drainage of the lake (which occurs almost annually) removed soft sediment and strengthened the remaining till over which the water blister expanded during drainage. Following lake drainage, the newly formed fracture continues to route water, but now in the form of a moulin (Doyle and others, Reference Doyle2013).
The application of extensive national airborne high-resolution light detection and ranging (LiDAR) scanning has made it possible to discover subtle geomorphological features in formerly glaciated regions. Recently, in Finland and Sweden, where LiDAR data are available over the whole country, numerous subglacial drainage features have been described and mapped, including murtoos, murtoo-related landforms and meltwater routes with different morphology (Mäkinen and others, Reference Mäkinen, Kajuutti, Palmu, Ojala and Ahokangas2017; Peterson and others, Reference Peterson, Johnson and Smith2017; Ojala and others, Reference Ojala2019; Ahokangas and others, Reference Ahokangas2021; Ojala and others, Reference Ojala2021; Peterson-Becher and Johnson, Reference Peterson-Becher and Johnson2021; Vérité and others, Reference Vérité2022). These landforms have been interpreted as representing a range of subglacial drainage conditions, from distributed to channelized systems and the transitions between them (Ojala and others, Reference Ojala2022). Murtoos are depositional landforms with erosional triangular-shaped tip (diagnostic feature in their recognition from LiDAR digital elevation models (DEMs)), pointing to the local ice flow direction (Ojala and others, Reference Ojala2021; Peterson-Becher and Johnson, Reference Peterson-Becher and Johnson2021). They are mostly <5 m in height and characterized by sandy diamictons interbedded with sorted sediments.
Channelized drainage represented by eskers and related glaciofluvial landforms has been widely studied, whereas published work on distributed drainage features is still limited. Similarly, the geomorphological signatures of water blisters have not previously been identified. However, with high-resolution LiDAR DEMs, there is a potential to identify these features in areas where the past subglacial bed of the FIS is exposed. Here, we investigate a part of the subglacial meltwater route (SMR) (Mäkinen and others, Reference Mäkinen, Kajuutti, Palmu, Ojala and Ahokangas2017) with a radial imprint of a possible water blister in SW Finland and provide the first geomorphic and sedimentological evidence that can be used to infer the location of water blisters within the beds of past ice sheets.
2. Study area and geomorphological setting
The study area is situated in SW Finland in association with the Poosjoki–Sääksjärvi SMR between 50 and 80 m a.s.l. (Mäkinen and others, Reference Mäkinen, Kajuutti, Palmu, Ojala and Ahokangas2017). The study area belongs to the Loimaa sublobe of the major Baltic Sea Ice Lobe (BSIL) (Fig. 1a), which separated from the main lobe during deglaciation after the Younger Dryas cold period. The sublobe is delineated by large interlobate eskers, the Pori–Säkylänharju esker and the Pyynikki–Kangasala esker (Mäkinen, Reference Mäkinen2003). Lake Sääksjärvi occupies the shallow, <10 m-deep remains of a meteorite crater formed in exposed crystalline basement rocks of the Baltic Shield at 608 ± 8 Ma ago (Kenny and others, Reference Kenny2020) (Fig. 1b). The continuation of the meltwater route on the SE side of the lake is less well represented, but there is a small field of murtoos revealing a connection to an esker. The meltwater route follows a NW–SE direction (330–150°), which is also depicted by the trend of the interlobate joint. However, the final ice-flow direction around the Lake Sääksjärvi region during the early Holocene was from the WNW (dominantly from 280–295°; Kejonen and others, Reference Kejonen, Sten, Moisanen and Paukola1988b), as indicated by glacial striations and lineations, as well as triangular murtoo tips along the meltwater route.
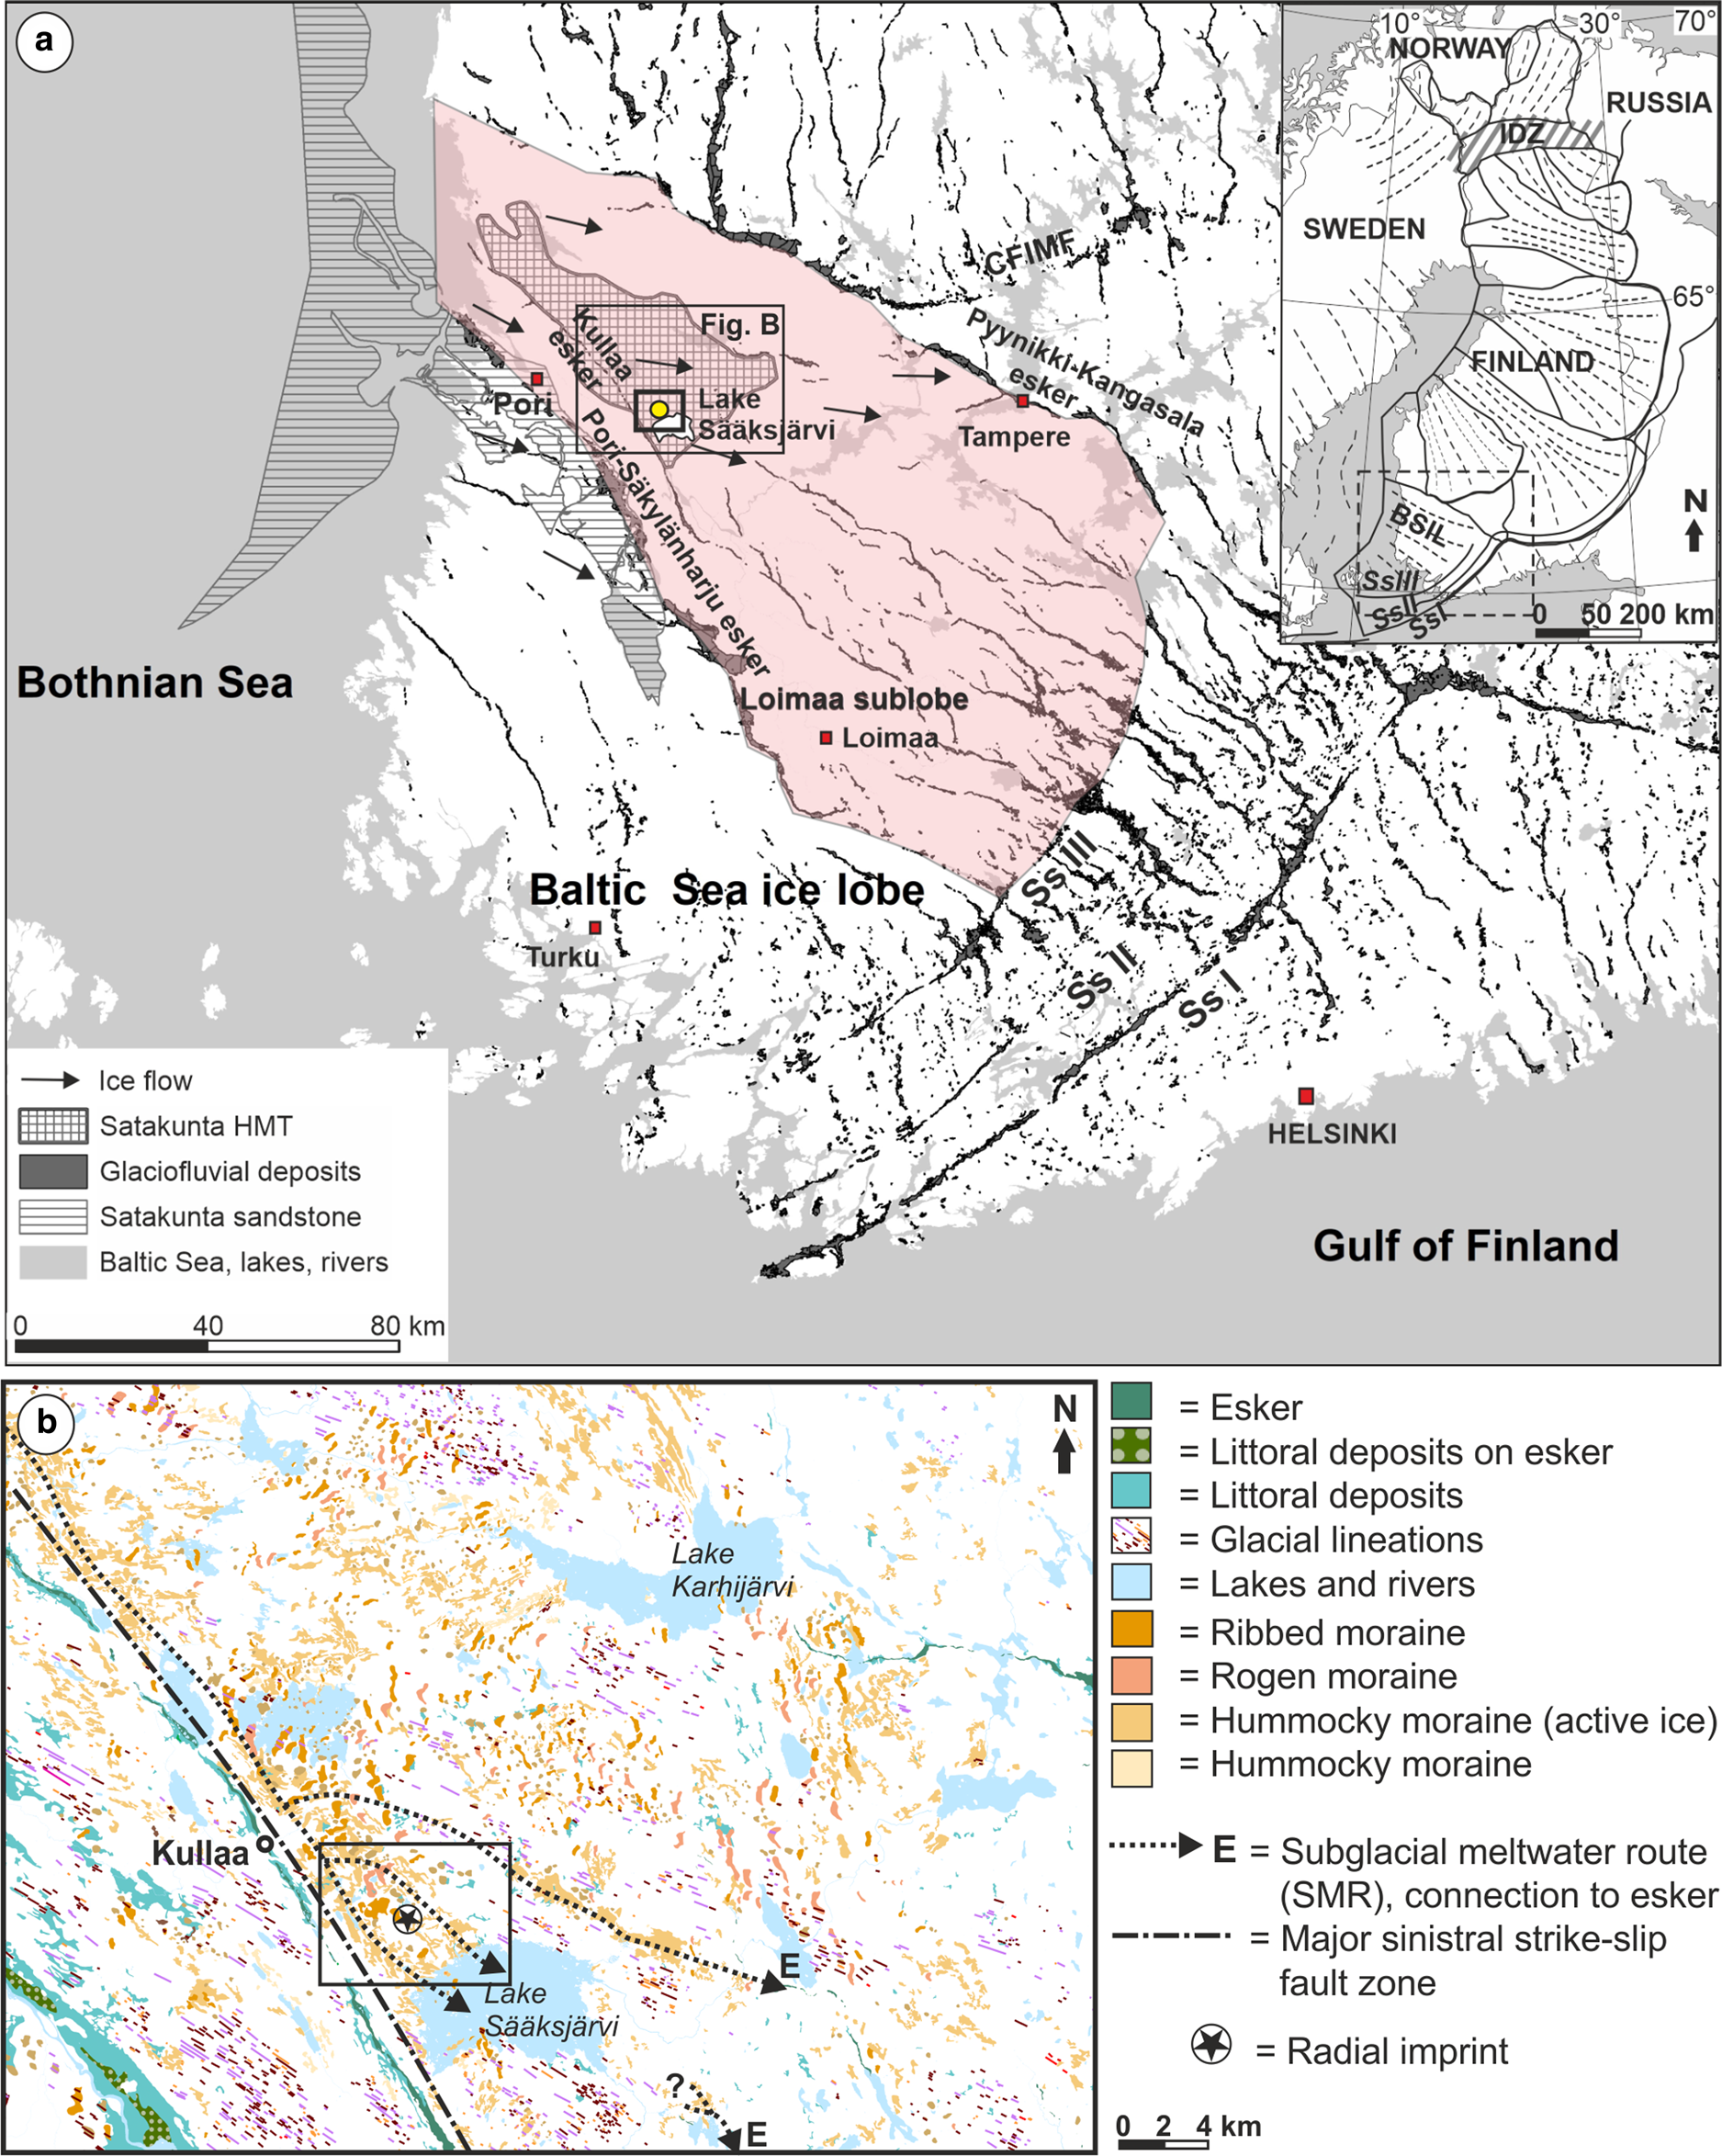
Figure 1. (a) Location of the study area within the Loimaa sublobe (colored area) of the major Baltic Sea Ice Lobe (BSIL). The radial imprint site is indicated by a yellow dot and the rectangle around it marks the position of Figure 2. Ice flow around the study area represents the latest ice-flow direction after the Younger Dryas period (Kejonen and others, Reference Kejonen, Sten, Moisanen and Paukola1988b). HMT refers to the Satakunta Hummocky Moraine Terrain (Geological Survey of Finland, 1984). The only bedrock depression with sandstone in SW Finland (Kohonen and others, Reference Kohonen, Pihlaja, Kujala and Marmo1993), delineating the western margin of the sublobe, is shown apart from the Svecofennian basement rocks. Ss I-III are major Younger Dryas ice-marginal complexes, CFIMF denotes the Central Finland Ice-Marginal Formation and IDZ represents the Ice Divide Zone in northern Finland. Glaciofluvial deposits by Geological Survey of Finland (1984). (b) Geomorphological setting of the study area with glacigenic landforms based on the Glacier Dynamic (GD) database (https://gtkdata.gtk.fi/maankamara, 12.04.2022) provided by the Geological Survey of Finland (cf. Putkinen and others, Reference Putkinen2017). The major sinistral strike–slip fault zone followed by the Kullaa esker divides the area into two geomorphologically distinct parts (https://gtkdata.gtk.fi/maankamara). The lower elevation western side is dominated by glacial lineations, whereas the eastern side, NW of Lake Sääksjärvi, shows a wide area of hummocky and ribbed/Rogen moraines cut by the branches of the Poosjoki–Sääksjärvi subglacial meltwater route (Mäkinen and others, Reference Mäkinen, Kajuutti, Palmu, Ojala and Ahokangas2017). In the present map, murtoos and murtoo-related landforms are categorized as hummocky moraines and appear along the subglacial meltwater routes. The rectangle with a radial imprint denotes to the area in Figure 2.
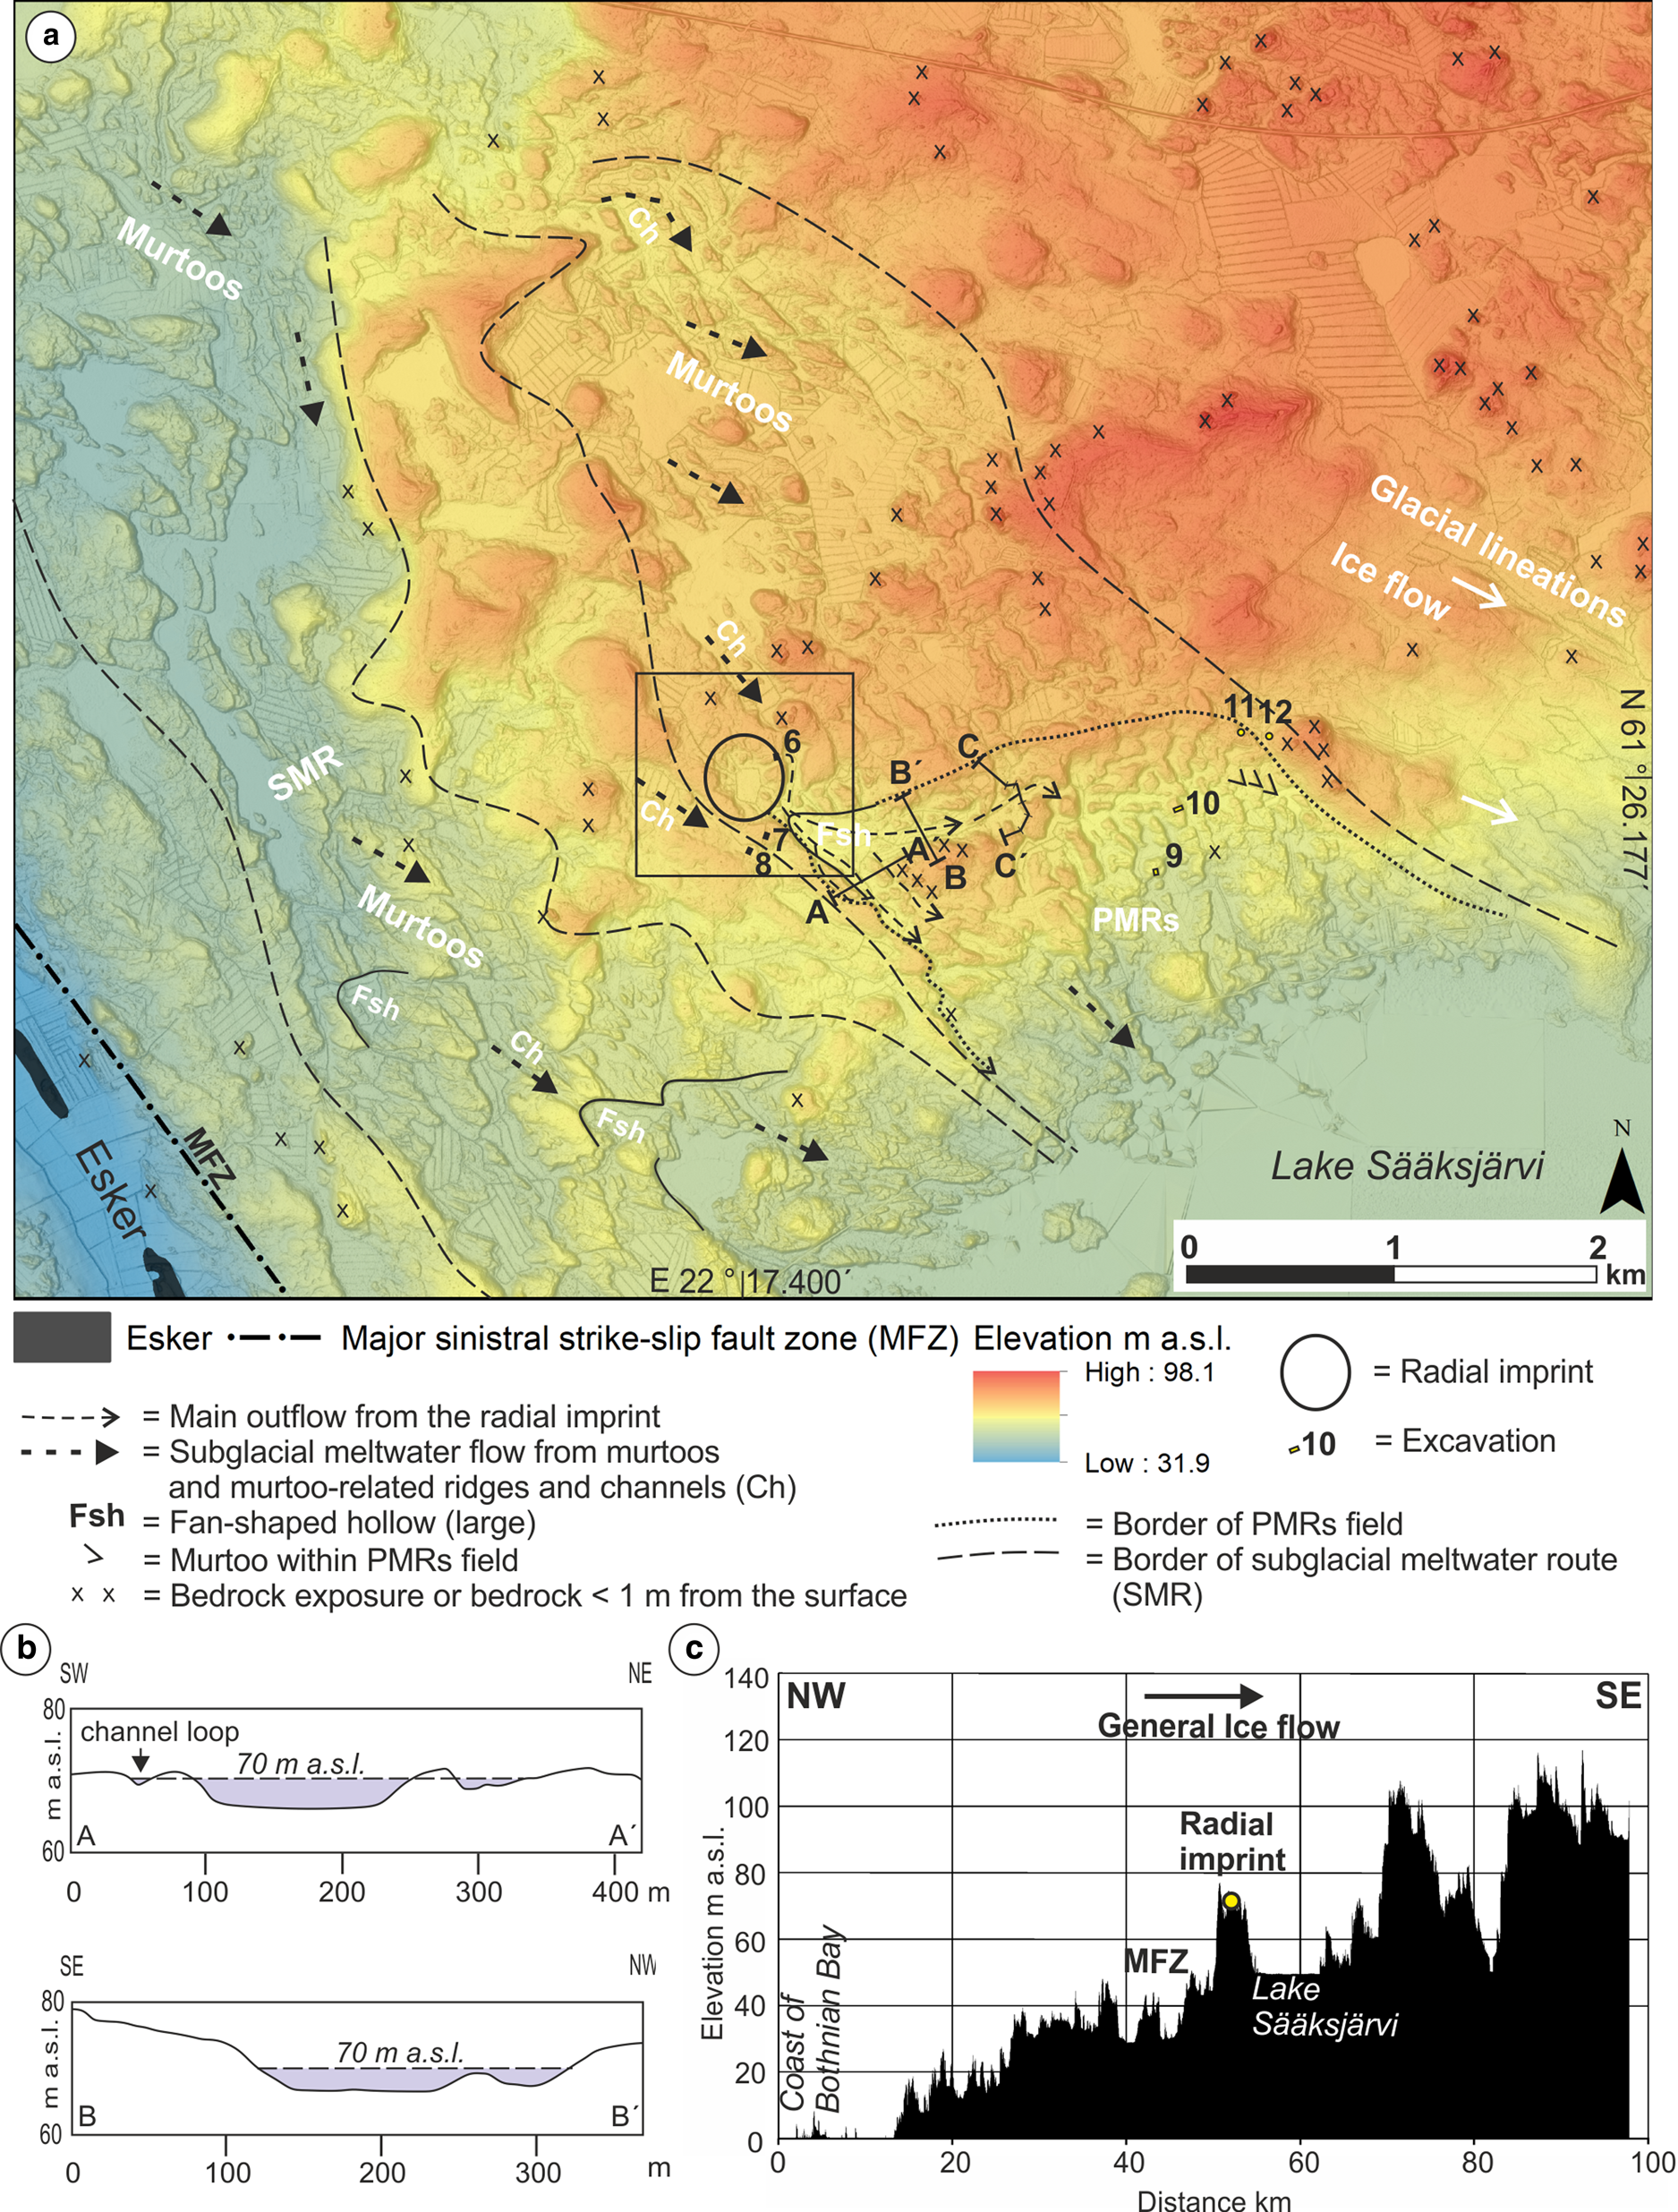
Figure 2. (a) Location of the radial imprint within the subglacial meltwater route and related down-flow geomorphology with a field of polymorphous mounds and ridges (PMRs). Note the southwestern escarpment (dotted arrow) within the branch of the main subglacial meltwater route (SMR). A possible fan-shaped hollow (Fsh) is located downstream (solid line). On the left, the main Poosjoki–Sääksjärvi subglacial meltwater route (SMR) with murtoos and large fan-shaped hollows (Fsh) adjacent to the Kullaa esker within the major sinistral strike–slip fault zone (MFZ). The rectangle refers to the area in Figure 3 (background map source: LiDAR digital elevation model, © National Land Survey of Finland, 2/2023). (b) The line segments A and B refer to cross-sections across the major outflow routes from the fan-shaped hollow next to the radial imprint. The maximum channel depths of the sections are 5 m (A) and 6 m (B), taking into account a peat thickness of 1 m. The line segment C denotes the position of the GPR profile in Figure 11. (c) Topographical position of the radial imprint. MFZ refers to the eastern margin of the major strike–slip fault zone.
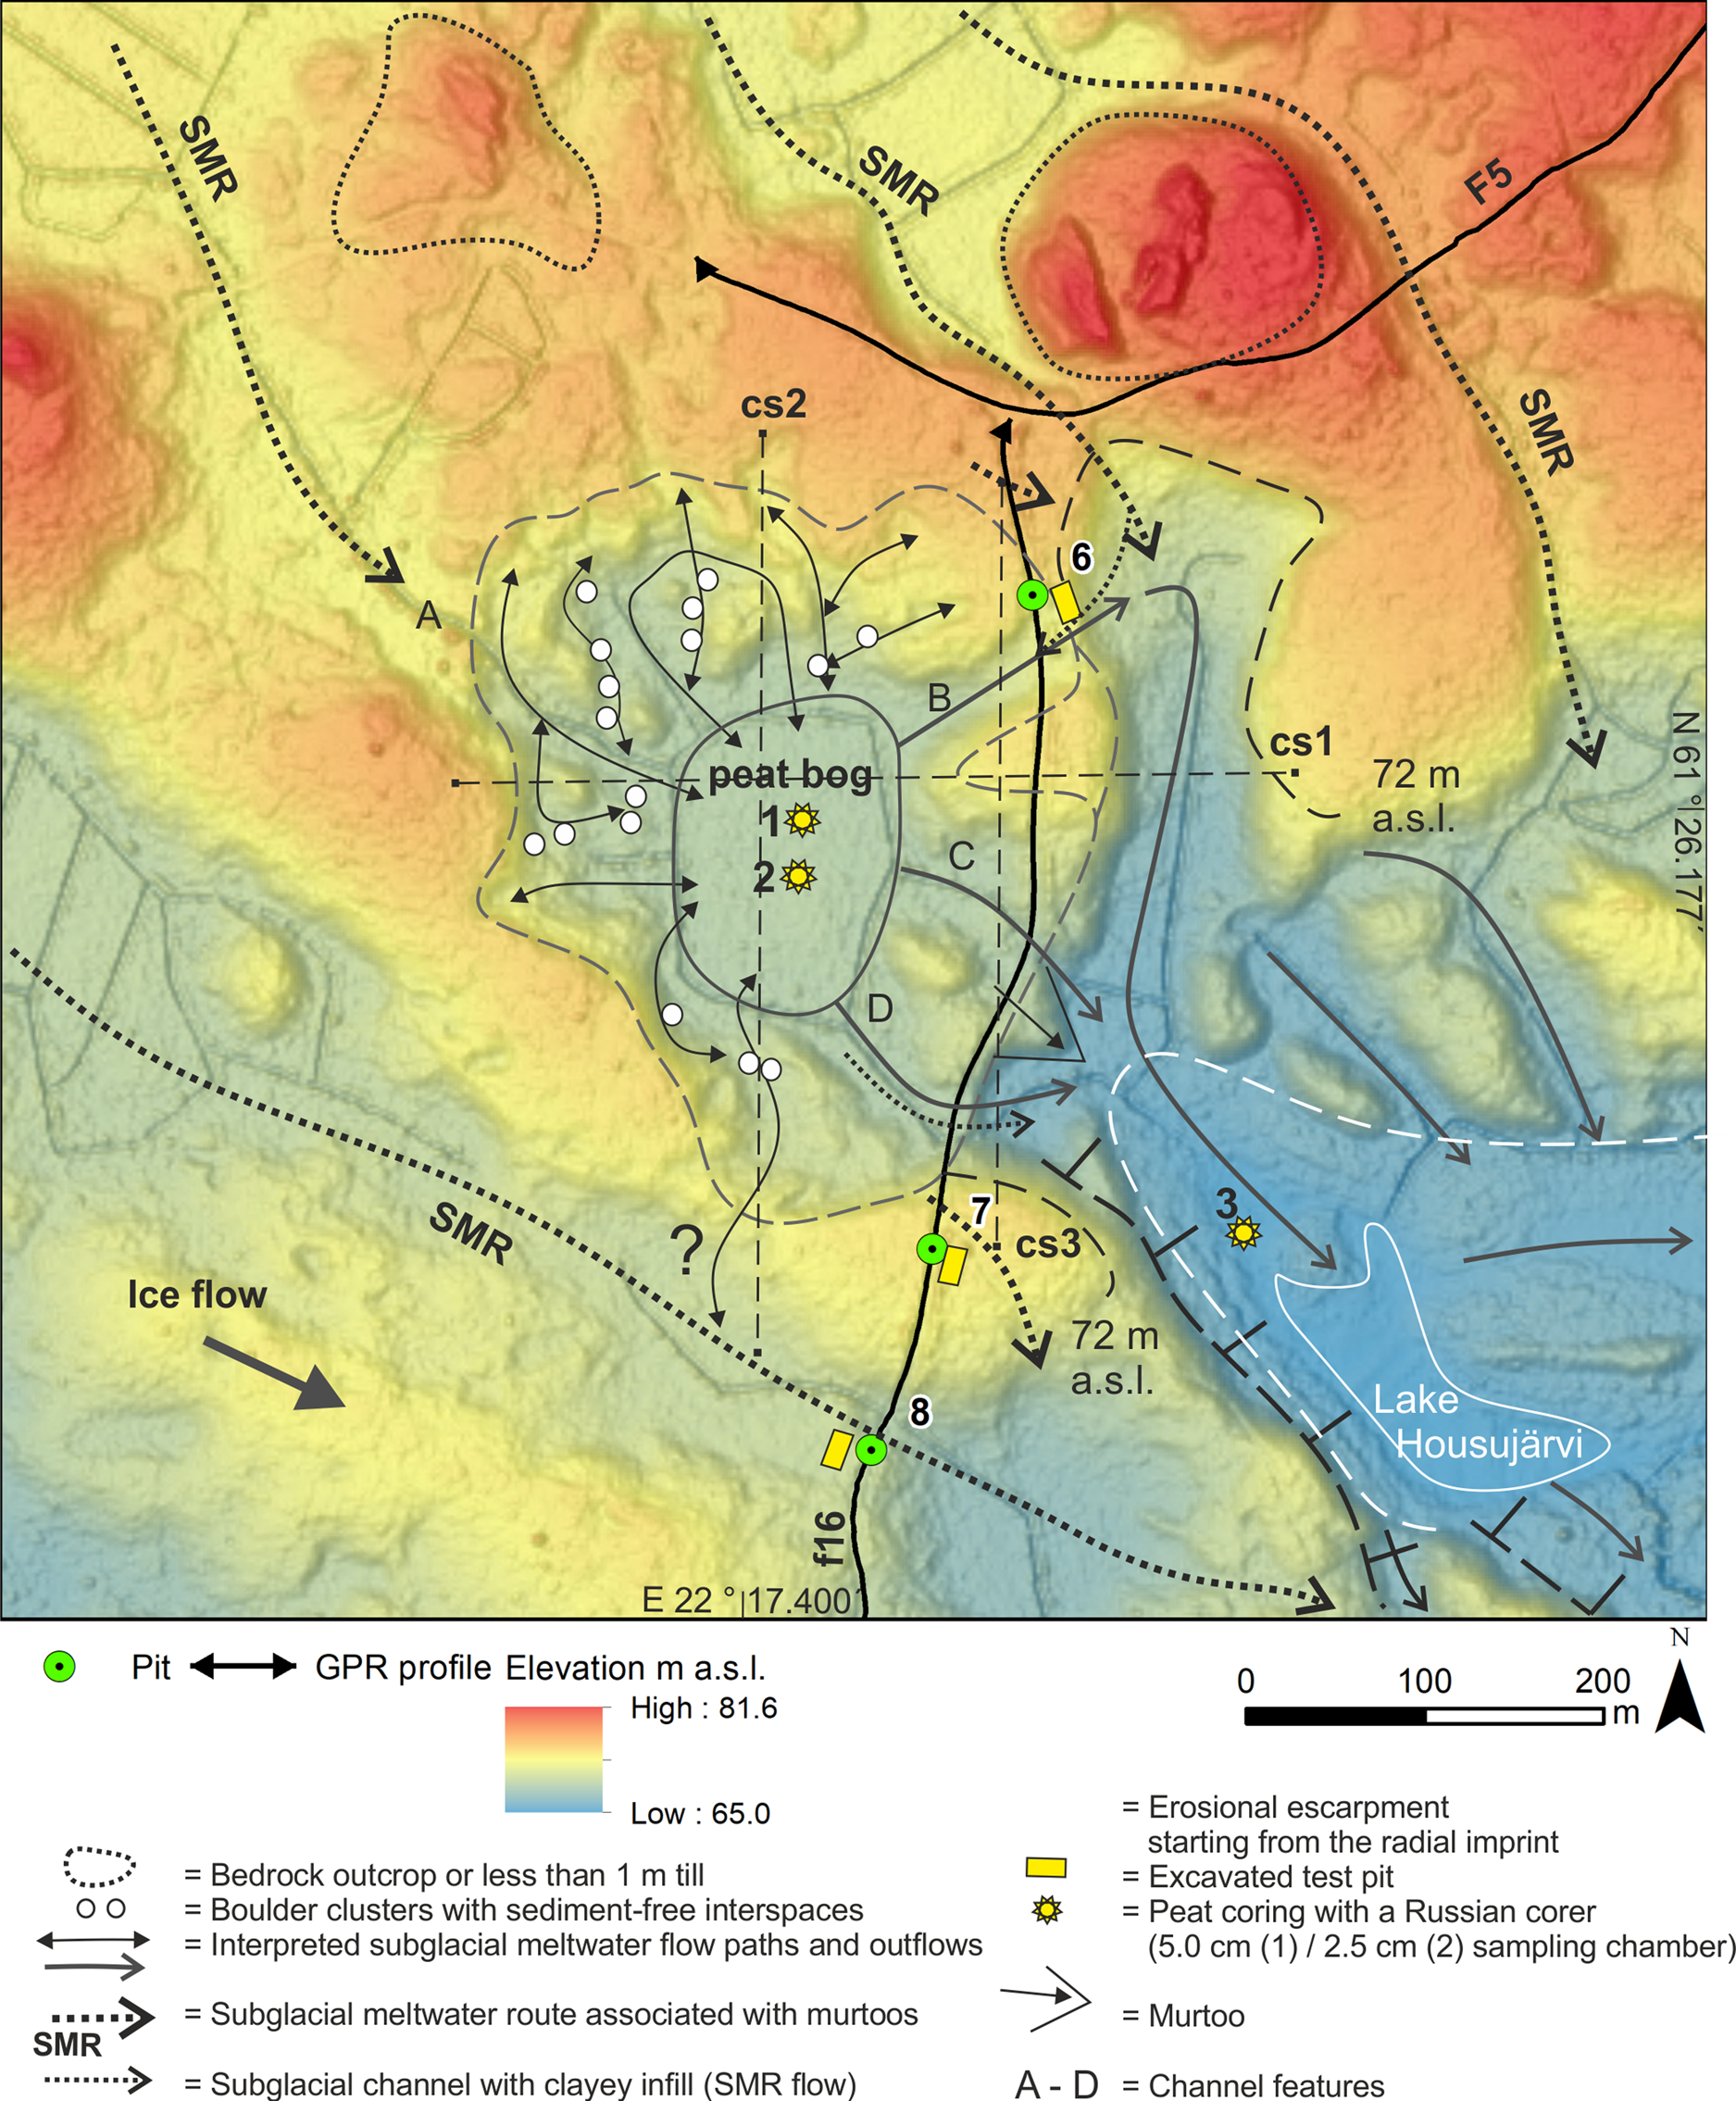
Figure 3. A radial imprint with radially spreading channels (gray dashed line) and a downstream erosional escarpment. The central pool is covered by a peat bog 3 m thick (gray solid line). Note the connection of the radial imprint to the subglacial meltwater route. The Lake Housujärvi depression might represent a fan-shaped hollow similar in size to the largest fan-shaped hollows within the main meltwater route (see Fig. 2). Cross-sections with dashed lines cs1–cs3 are presented in Figure 4 (background map source: LiDAR digital elevation model, © National Land Survey of Finland, 3/2023).

The Poosjärvi-Sääksjärvi SMR runs along the eastern side of a major sinistral strike–slip fault zone (Fig. 1b) within the Svecofennian basement rocks, mainly composed of tonalite and biotite paragneiss (Kohonen and others, Reference Kohonen, Pihlaja, Kujala and Marmo1993; Lahtinen, Reference Lahtinen1996). The fault zone is also occupied by the Kullaa esker (Figs 1b, 2a), which continues 90 km toward the NW until the coast of the Bothnian Bay. The SMR and the adjacent Kullaa esker, as well as the major bedrock fault zone, coincide with the western margin of the wide Satakunta hummocky moraine terrain (Geological Survey of Finland, 1984, Fig. 1a). The radial imprint that we discuss here is situated at the topographical ‘knick-point’ close to the major bedrock fault zone, where the basement rises from the sea level to ~80 m a.s.l. within 40 km along the ice-flow direction (Fig. 2c).
The fault zone divides the geomorphology of the study area into two distinct regions. The western region is dominated by glacial lineations, whereas the eastern side to the NW of Lake Sääksjärvi possesses a field of ribbed-type moraines and crescentic hummocky moraines cut by the two 1.5–2.0 km-wide western branches of the Poosjoki-Sääksjärvi SMR (Figs 1b, 2a). In addition, the fault zone lies ~5–10 km to the east of the contact with the Jothnian Satakunta sandstone depression (Fig. 1a), the eastern margin of which was also the locus for the interlobate joint between the Loimaa sublobe and the BSIL (Mäkinen, Reference Mäkinen2003).
The radial imprint investigated in the present study is located at the margin of the less well-developed branch of the main Poosjoki–Sääksjärvi SMR and within a slightly higher elevation bedrock area (Fig. 2a). The area north of this radial imprint is characterized by a small field of murtoos, whereas the downstream side has a field of polymorphous (murtoo-related) mounds and ridges (PMRs; cf. Ojala and others, Reference Ojala2021) (Fig. 2a).
3. Materials and methods
The mapping of landforms and compilation of topographic cross-sections was based on processed LiDAR DEMs (2 m horizontal resolution and vertical accuracy of ~0.3 m) at the scale of 1:5000 to 1:15 000 and the LiDAR imagery-based nationwide Glacier Dynamic database (GDdatabase) of glacial landforms (Putkinen and others, Reference Putkinen2017). We used several DEM visualizations, including a multidirectional oblique-weighted hillshade (Jenness, Reference Jenness2013) and slope derivatives (see, e.g. Palmu and others, Reference Palmu, Ojala, Ruskeeniemi, Sutinen and Mattila2015; Putkinen and others, Reference Putkinen2017). The landform classes of the GD database are available via the Hakku spatial data service (https://hakku.gtk.fi/en) and the Maankamara map service (https://gtkdata.gtk.fi/maankamara).
Sedimentological data were collected using existing pits and excavator-dug trenches (Figs 2a, 3), including one outflow channel from the central depression of the radial imprint, one meltwater channel outside the radial imprint, one glacial lineation between the channels, as well as two mounds of the polymorphous landforms located downflow from the radial imprint. The lithology and structure of the sediments were logged in the field, applying lithofacies coding supplemented with sketch drawings and photographs or photomosaics. Selected lithofacies were sampled for grain-size analysis in the laboratory using wet- and dry-sieving of material smaller than 64 mm and applying the Udden–Wentworth classification. The roundness of sediment clasts was visually determined by using the six-class classification scheme of Powers (Reference Powers1953). Sediments within peat-covered areas were examined using Russian peat corers (with 25 and 50 mm sampling chambers) (Fig. 4). Geomorphological and sedimentological data were supported by mapping of the open-framework boulder clusters of the radial imprint using a handheld GPS and by ground-penetrating radar (GPR) surveys along forest roads (Fig. 3). We used a GSSI SIR® 3000 single-channel GPR data acquisition system with 200 MHz antenna, the vertical resolution of which is 0.15 m (using a dielectric value of 6). The forest roads have primarily been constructed by removing the uppermost layer (~0.5 m thick) of the land surface. There is no buried infrastructure along the roads in this area. Radar profiles were prepared by using Geodoctor software without any postprocessing. The altitude of the excavations in relation to the nearby GPR lines was measured with a levelling instrument.
4. Results and interpretation
4.1. Sedimentary evidence of subglacial flooding
Here we describe the main sediment facies from pits 6–8, representing two channel forms separated by a glacial lineation next to the radial imprint (Fig. 3). The descriptions from more distal sites within the field of PMRs (pits 9–12, Fig. 2) are presented in the next section.
Pit 6 (18 m long and 3 m deep) was excavated to investigate the lithofacies and sediment structures of a possible outflow channel from the central depression of the radial imprint (Fig. 5). The pit reveals an exposed polished bedrock knob and can be divided into five main depositional units (Table 1). Units 1–2 (Figs 5a, b and Table 1) are interpreted to display a transition from hyper-concentrated flows to stream flows, representing decreasing flood flow. Unit 3 (Figs 5b, c and Table 1) exhibits channelized clayey gravels and laminated muds deposited after the flood. These sediments were likely eroded and deformed during the meltwater route flow (unit 4) (Table 1, Fig. 5c). Finally, a low topographical terrace formation indicates deposition by shore processes during the Litorina Sea phase (Ojala and others, Reference Ojala, Palmu, Åberg, Åberg and Virkki2013) of the Baltic Sea Basin (Fig. 5a and Table 1).

Figure 5. Sedimentary characteristics of pit 6. (a) Excavation transverse to the northern part of the northernmost outflow channel of the radial imprint with the main depositional units 1–4. The pit bottom was relatively rapidly filled with groundwater, covering subunit 1a. (b) Knob of polished bedrock exposed on the left covered by crudely bedded gravel (unit 1), including coarse-tail normal grading (arrow). Unit 2 is crudely stratified with vague troughs and cobble lags. The uppermost troughs show more sorted, sandy and stratified infills (dashed lines). The top of section consists of massive sandy gravel (SMR deposits, unit 4a) overlain by more sorted and sandy shore deposits (unit 5). (c) Channelized unit 3 is composed of very poorly sorted, massive to crudely bedded clayey pebble gravel eroded and mixed by cobbly gravel (4b), including partly preserved and deformed, laminated mud (dotted lines indicated by an arrow).
Table 1. Description and interpretation of the depositional units in pit 6

Pit 7 (13 m long and 5.5 m deep) is located in the glacial lineation oriented in the direction of ice flow (Fig. 3). The ridge is composed of highly sandy, massive/matrix-supported diamicton with a few interbeds of deformed, laminated silty fine sand (Figs 6, 7a). GPR reveals shallow channels in the upper part and along the margin of the ridge. Massive gravelly sands on top overlain by boulders have been observed throughout the meltwater route and probably represent meltwater route sedimentation and the subsequent deposition of boulders from the melting ice bed. Furthermore, the topmost sediments were probably flushed by waves and molded by forest bed processes.

Figure 6. Lithofacies logs from pits 6–8 and generalized stratigraphy of the subglacial meltwater route (SMR) on the right.

Figure 7. Sedimentary characteristics of pits 7 and 8. (a) Pit 7 in the tail of the lineation with possible bedrock just below the groundwater, (b) pit 8 into clayey channel sediments underlain by basal tills. The lower part exhibits bluish gray silty till on well-exposed polished bedrock covered by groundwater. Rods 4 m. For the location of the pits, see Figures 2 and 3.
Pit 8 (10 m long and 4.5 m deep) was excavated into a shallow channel outside the radial imprint next to the glacial lineation (Fig. 3). Polished bedrock is directly overlain by gray and bluish, clayey/silty and massive/matrix-supported diamicton (till) (Figs 6, 7b) with large boulders in the lower part. This diamicton has normal compactness and shows a diffuse contact to overlying sandy, massive/matrix-supported diamicton with boulders up to 2 m in diameter (Fig. 6). The sandy diamicton is eroded by a shallow, 5–10 m-wide channel filled with clayey, very poorly sorted gravel. The gravel includes some cobbles and small boulders. The lower contact of the channel is sharp and contains a high concentration of weathered biotite paragneiss. Due to perched groundwater influence within the channel, the sediments are black and rich in manganese and there was quite a strong smell of sulfur. The upper part contains poorly preserved laminations of mud. Laminated mud indicates deposition under tranquil flow conditions and later reworking by increased meltwater flow. The channel infill is covered by gravelly, poorly sorted sand with occasional boulders (Figs 6, 7b), which forms the forest bed.
4.2. Sedimentology of polymorphous mounds and ridges
Pits 9 and 10 were excavated within the field of PMRs, whereas the already available pits 11 and 12 represent the margin of the field (Fig. 2). Pit 9 is 16 m long and 3.5 m deep and is located in the southern margin of a small circular mound. Pit 10 lies 270 m NE of pit 9 in the middle of a small ridge. The excavation is 45 m long and 3.2 m deep. Pits 11 and 12 are borrow pits along the Takalantie road located some 520 m NE of pit 10. Pit 11 is 2.5 m deep and excavated into a 5 m-high hill. Pit 12 is 1.6 m deep and located 100 m east of pit 11, slightly outside the main PMRs field and on the stoss side of a bedrock hill within the eastern margin of the SMR (Fig. 2).
The bottommost deposits of pits 9–12 are all composed of sorted and stratified sediments from silty sands to sandy gravel with mainly subangular to subrounded clasts (Fig. 8). In addition, pits 9 and 10 contain current ripples and dunes, indicating the presence of stream flows. The stratified deposits of pits 9–11 are overlain by sandy, massive/matrix-supported diamictons with subangular to subrounded clasts mostly <150 mm in diameter. In pits 9 and 10, these diamictons have a low mud content (3.2 and 3.1%, respectively) and a high gravel content (70.7 and 63.3%, respectively) with clasts between 16 and 63 mm forming 50.0 and 43.4% of the sample. The content of very fine to fine sand is 10.3 and 13.0%, respectively. Therefore, the diamictons could be described as poorly sorted gravels. The diamictons also include occasional poorly preserved sand layers and clusters of coarse-grained sand and fine gravel. The distinction between sorted/stratified sediments and the overlying sandy diamicton becomes unclear in the western side of the pit 10, where the sediments are mixed and structureless showing some poorly preserved, disturbed sand beds. This change is associated with the lower-angle western side and steeper eastern side topography of the ridge, which is characteristic for most of the PMRs field. The steeper eastern side in pit 10 exhibits nearly vertical deformation of sand beds against the sandy and massive diamicton with an undulating contact, the lower part of which contains a few small rafts of sand beds. The topmost bed in pits 9 and 10 is composed of loose massive and matrix-supported sandy diamicton mixed with the upper forest bed. In pit 9, the lower part of the topmost diamicton has a sharp to partly diffuse contact to a 100–200 mm-thick light gray bed of stratified medium to coarse sand.

Figure 8. Sedimentology and stratigraphy of pits (logs) 9–11 (with photos), within the field of PMRs and pit 12, just outside the field within the margin of the SMR. Note the basal sorted and stratified sediments in all pits overlain by interpreted flood diamictons (lithofacies in bold) in pits 9–11. Stratified sediments in pit 12 outside the PMRs field are heavily glaciotectonized (GT). Small arrows in logs 9 and 10 indicate average paleoflow directions measured from stream-flow structures. For the location of the pits see Figure 2.
The sandy diamicton covering the sorted and stratified sediments in pit 11 is crudely stratified and more fine-grained. It contains 4.3% mud and 34.5% gravel, with clasts between 16 and 63 mm forming only 14.5% of the sample. The content of very fine to fine sand is 30.2%. This sandy diamicton is absent from the nearby pit 12, where stratified beds are heavily glaciotectonized (from the direction of 280°) by the overlying bouldery, massive/matrix-supported diamicton, which has a fissile structure within the lowest 0.3 m. The similar bouldery diamicton, with sediments deformed by boulders in the lower part, is also partly preserved in pit 11, where it is first covered by varved clays with large boulders and finally by sandy and bouldery, poorly sorted massive/matrix-to-clast-supported gravel (Fig. 8).
The deposits of pits 9–12 can be interpreted to exhibit the following depositional stages:
(1) Stream-flow deposition of sorted and stratified sediments in broad and low conduits within the SMR. Paleoflow directions to E–SE within pits 9 and 10, respectively.
(2) Flood event (hyper-concentrated flow, cf. Mulder and Alexander, Reference Mulder and Alexander2001; Pierson, Reference Pierson, Jakob and Hungr2005) with rapid deposition of sandy, massive diamictons or poorly sorted gravels (pits 9 and 10), changing to crudely stratified diamicton toward the margin of the PMRs field (pit 11). There is no corresponding diamicton outside the PMRs field (pit 12).
(3) Deformation of stage 1 and 2 deposits by the overriding ice from the western direction followed by the deposition of melt-out till (pits 9 and 10) and deposition of basal till at the margin of the PMRs field (pit 11) and glaciotectonized underlying stratified sediments outside the PMRs field (pit 12). Stratified sands between the flood diamicton and the uppermost till in pit 9 indicate stream flow after the flood event.
(4) Proglacial waterlain deposition of varved clays with erratics (pit 11) during the Yoldia Sea stage of the ancient Baltic Sea.
(5) Shoreline processes and deposition of beach gravels (pit 11) and partial reworking of the uppermost till bed. Finally, there was alteration of the uppermost till beds due to forest bed processes.
4.3. Geomorphology of the radial imprint
The geomorphological characteristics of the radial imprint (Figs 3, 4) are outlined by using radially spreading erosional marks or channels (~100–150 m long and 25–40 m wide) reaching 72 m a.s.l. The imprint has an area of ~0.11 km2 (long-dashed gray line, Fig. 3). The base of the main depression, mostly covered by a peat bog at 69 m a.s.l. (Figs 3, 4), is an almost circular depression that is 3 m deep with an approximate area of 0.025 km2. However, the margin of the radial imprint and its up-ice extent are somewhat difficult to delineate in detail, because the lower parts on the northern side are partly covered by beach deposits 0.5–1.0 m thick, as revealed by pit 6. The beach deposits were eroded from the nearby till-covered bedrock knobs during the regressive shoreline development of the Baltic Sea Basin. The up-ice rim of the radial imprint in the NW direction is associated with several exposed boulder clusters that have an open-framework texture with a maximum interspace depth of 0.5–1.0 m (Figs 3, 9a).

Figure 9. Radial imprint characteristics. (a) Eroded basal till with an open-framework boulder cluster (arrows) on the northern rim of the imprint. The depth of empty spaces between boulders reaches 0.5–1.0 m in places. (b) A core (number 2) from the lowest 0.5 m of the peat bog covering the center of the radial imprint. The total thickness of the core is 3 m. The hard bottom could not be penetrated using the Russian peat corer with a 25 mm sampling chamber. The bottommost 0.2 m displays upward fining from sandy clay to homogeneous clay covered by peat. The clays represent ice-marginal to proglacial deposition. (c) About. 2.5 m-deep northern outflow channel of the radial imprint (photo toward the south). The channel was excavated next to the forest road transverse to flow (pit 6). The road was also used for the GPR survey, revealing the channel dimensions. For location see Figure 10.
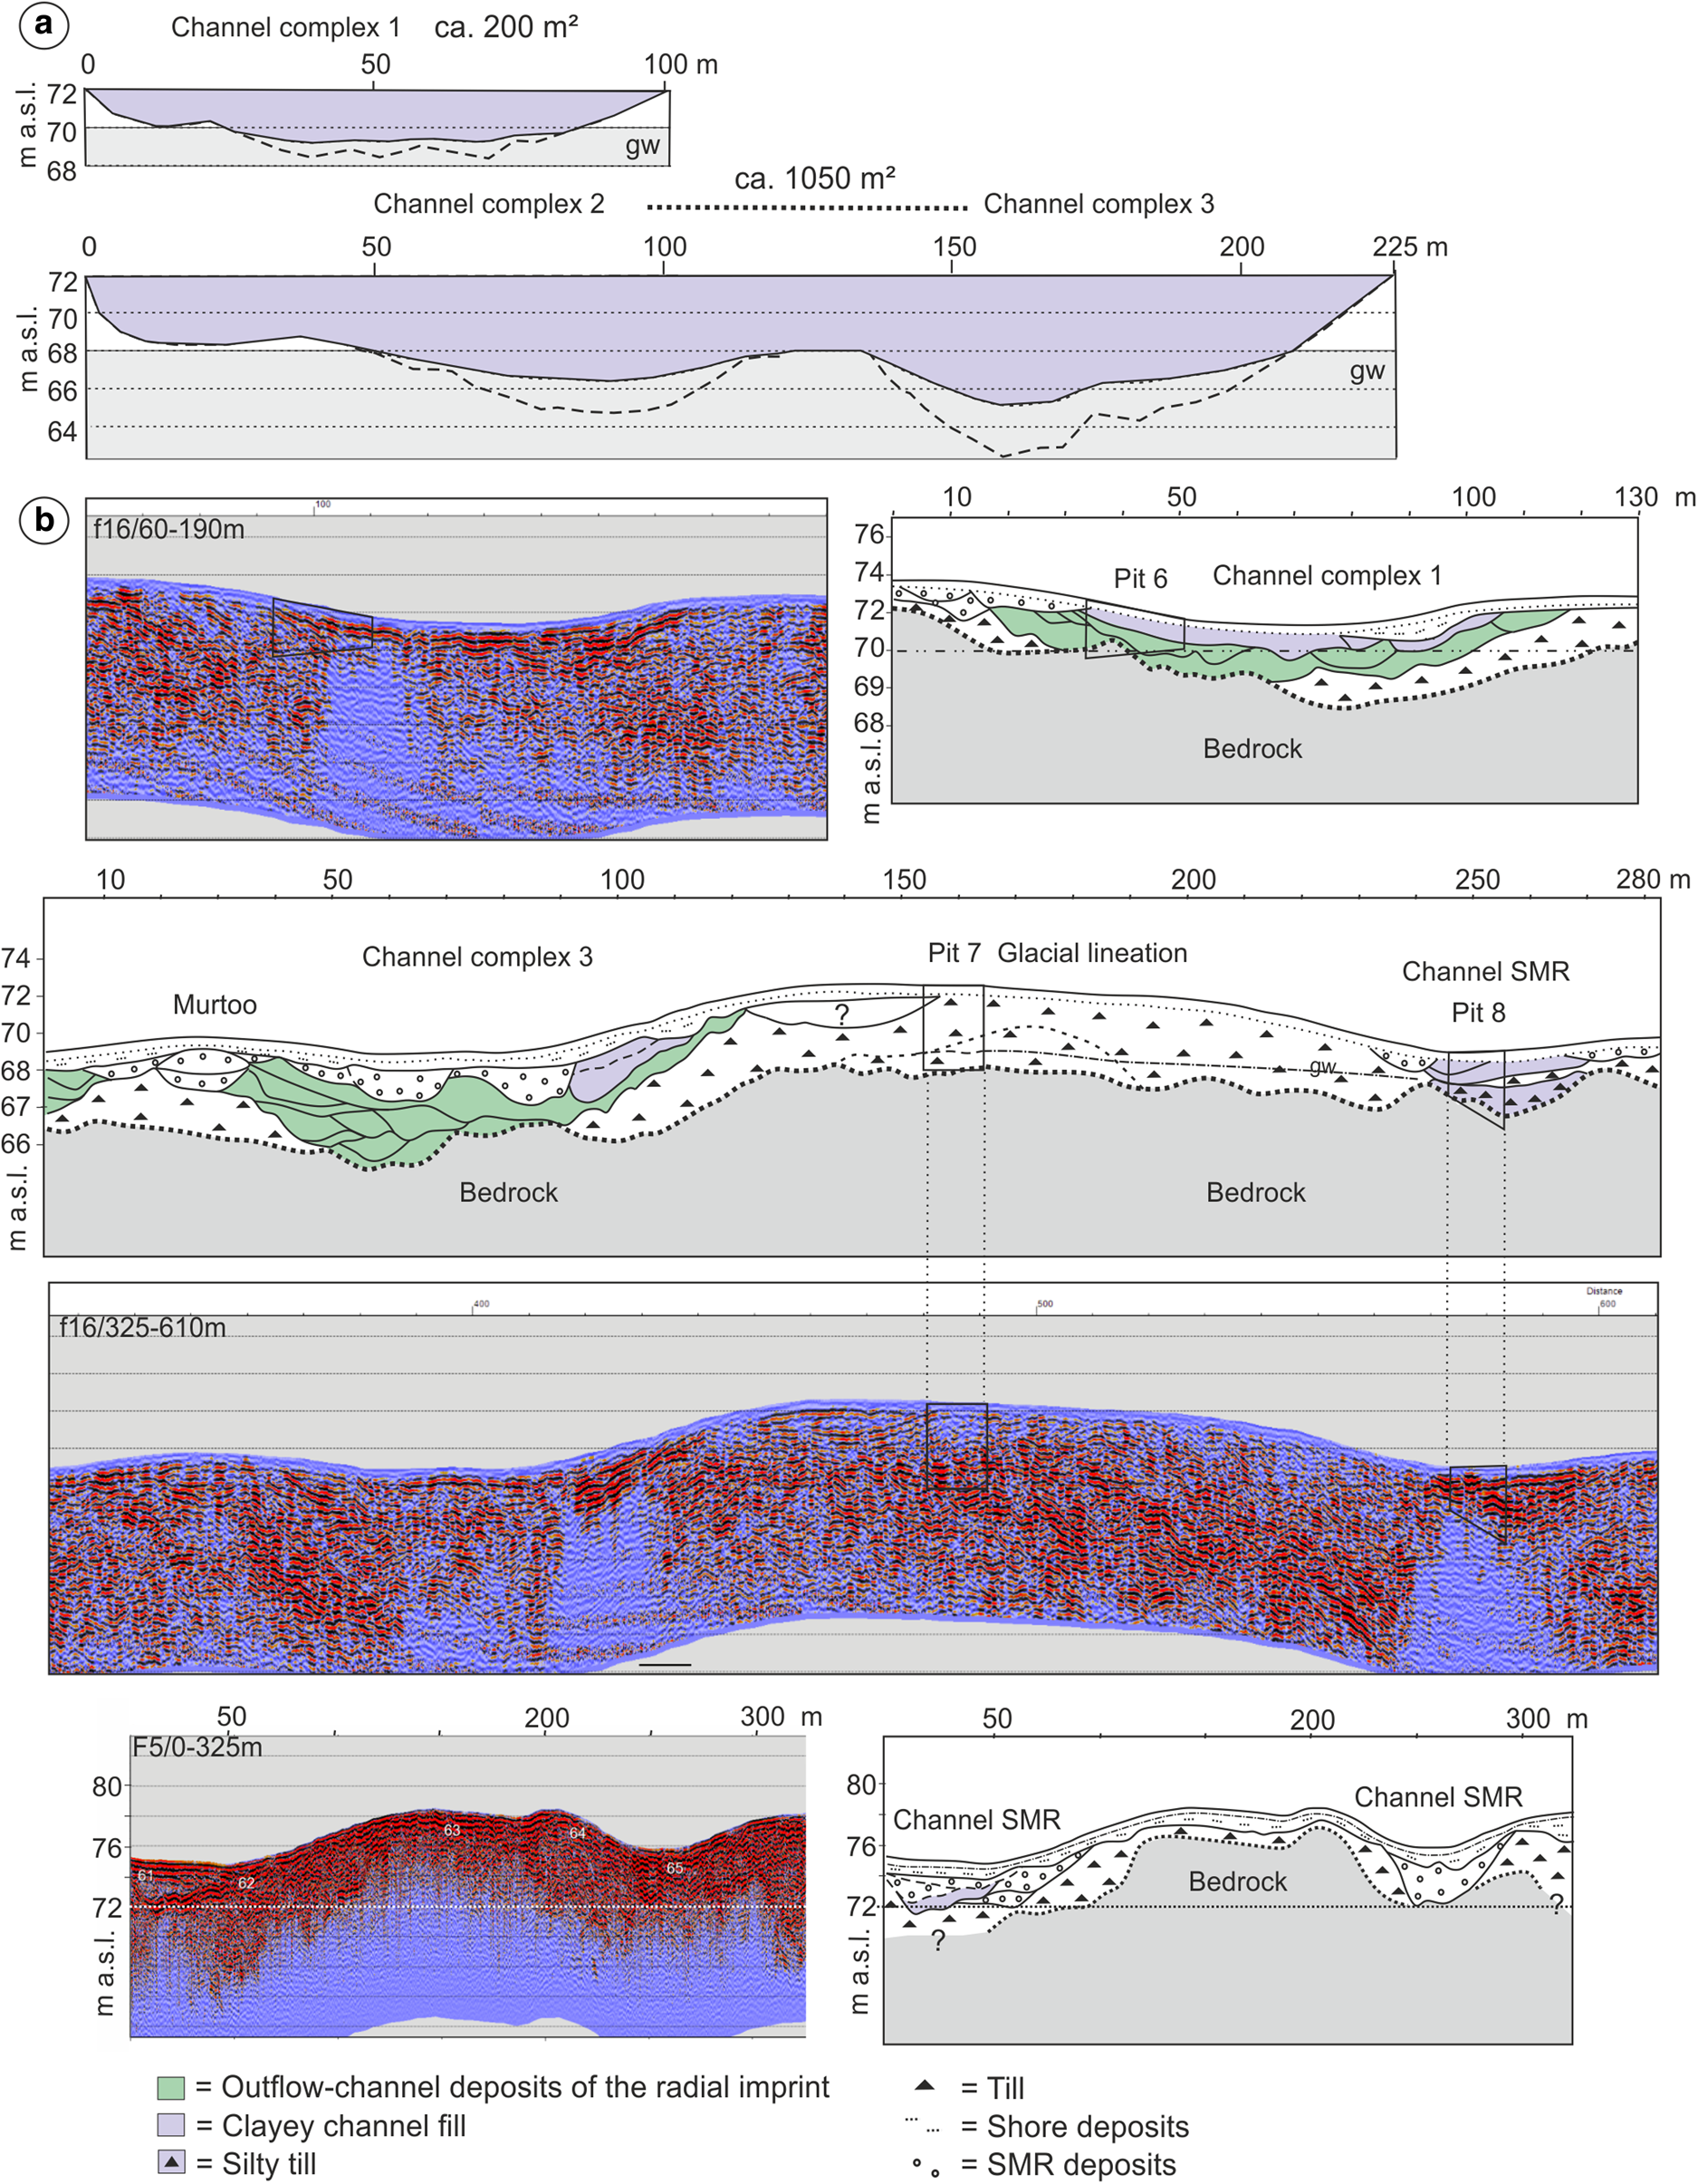
Figure 10. Interpretation of channel dimensions based on ground-penetrating radar surveys. (a) Cross-sections of the major outflow channels from GPR profile f16 along the eastern margin of the radial imprint. The groundwater (gw)-covered area is in gray and channel cross-sections in blue. The lower bottom of channel cross-sections represents the uncorrected depth from GPR profiles, (b) GPR profiles f16 (200 MHz), along the eastern margin of the radial imprint, and F5 (200 MHz), across the subglacial meltwater route (SMR) with channels.
The approximate volume of the radial imprint is 0.43 million cubic meters. To the NW of the central depression, there is a channel feature (A in Fig 3), which has a minimum elevation of 71.5 m a.s.l. If the radial imprint is related to upstream subglacial flooding, and given that the deepest region of the depression is 65 m a.s.l., and channels C–D (Fig. 3) to the SE have elevations of 65–66 m a.s.l., it is unlikely water would spread further up-glacier than the marked region in Figure 3 (long-dashed gray line), as it would require 6.5 m of water accumulation in the depression. Instead, it is more likely that the water drained out of the depression to the E–SE direction. This matches the measured paleoflow directions from our excavation sites from the field of PMRs (Fig. 8).
The northern side of the radial imprint is partly delineated by exposed bedrock or bedrock areas covered by a thin (<1 m) layer of Quaternary sediments (Kejonen and others, Reference Kejonen, Sten, Moisanen and Paukola1988a), as also confirmed by the GPR survey. The southern side of the imprint possibly exhibits partial breaching of a glacial lineation (pit 7) and subsequent channelized flow downstream (pit 8) (Figs 3, 4). The central peat bog has a hard bottom that could not be penetrated by peat corers. The bottom of the bog is covered by ~0.2 m of late- and postglacial clay with a transition from sandy clay to homogeneous clay (Fig. 9b). Such clayey lithofacies is typical for fine-grained sediment succession in southern Finland for sites that were initially part of the Baltic Sea Basin and were isolated during the early Holocene (e.g. Winterhalter, Reference Winterhalter1992; Virtasalo and others, Reference Virtasalo, Hämäläinen and Kotilainen2014; Ojala and others, Reference Ojala2022). These clay sediments are overlain by 2.8-m-thick layer of peat, representing postglacial paludification of the depression (Fig. 9b).
The downstream side of the radial imprint in the SE direction has erosional outflow channels, with the well-defined northernmost channel (B in Fig. 3) being ~130 m long, 30–40 m wide and 2.5 m deep (pit 6) (Figs 9c, 10a). The channel base rises downstream from 69 to 72 m a.s.l. However, the GPR data and observations from pit 6 indicate that the higher end of the channel is underlain by an 80 m-wide channel infill complex that has grown up to the general erosional level of the radial imprint, i.e. 72 m a.s.l. (Fig. 10b). The total thickness of the sediments within the channel complex is ~2–3 m, with the erosional base at ~69 m a.s.l., as interpreted from the GPR data and supported by the exposed polished bedrock in pit 6. Individual channel infills within the channel complex are ~1–2 m thick.
The GPR data also reveal two southern channel complexes 80–110 m wide (C and D in Fig. 3) separated by higher ground with a small triangle-type murtoo head in the middle (Figs 3, 10b). These channel complexes are 3 m deep and their erosional base lies at ~65–66 m a.s.l., corresponding to the base altitude of the peat bog in the center of the radial imprint. Individual channel infills are 1–2 m thick. The strong GPR reflectors along the margin of the southernmost channel complex at the level of ~67.5–69.0 m partly block the radar signal, implying clay-rich sediments (Fig. 10b). These sediments have been eroded by infilled channels 20 m wide and 1.0–1.5 m deep with an erosional base at 67 m a.s.l. The channels are located next to the murtoo, which is 2 m high and 50 m wide at the 68–70 m level. The base of the murtoo is formed by a 0.5 m-thick channel infill with the bottom at the 67.0–67.5 m level.
It is noteworthy that the murtoos and side-lapping channel sediments only occupy the lower-lying and downstream-descending outflow channels. Based on the GPR data, the maximum cross-sectional area of all outflow channels is 1250 m2 (Fig. 10a). These channels join a single SMR channel that is ~100 m wide. The upstream part of this channel, ~100 m north of the radial imprint, is 40 m wide and has its base at ~72 m a.s.l., corresponding to the uppermost erosional level of the radial imprint (Fig. 10b). Based on GPR data, the channel is filled with sediments up to 3.0 m thick (Fig. 10b). The sediment infill of the northernmost outflow channel in pit 6 is cut by meltwater flow along the SMR channel, as also revealed by the LiDAR DEM (Fig. 3).
The main outflow channels connect to the erosional southwestern escarpment leading downstream from the radial imprint along the western margin of the meltwater route (Figs 2, 3). GPR data from the wider area reveal that the sediments downstream from the polymorphous landforms become generally composed of more fine-grained sediments compared to the deposits upstream.
Further evidence of subglacial drainage erosion in the area is provided by appearance of a depression ~0.5 km down-ice from the radial imprint (Figs 2, 3). This depression is covered by a small lake (Lake Housujärvi at 65 m a.s.l.) and the surrounding peat bog located within the SW margin of the SMR. The peat bog at the margin of Lake Housujärvi exhibits a similar stratigraphy to the base of the radial imprint, but with thicker (10 cm), more sandy clay at the bottom overlain by 0.5 m of homogeneous clay covered by 2.4 m of peat. The hard bottom of the peat bog is at the level of 63 m (core 3, Fig. 3) 3 m lower than the base of the radial imprint.
The Lake Housujärvi depression has two outflow routes divided by an exposed bedrock high. The outflow routes are connected to the downstream field of PMRs (Fig. 2). The >2.0 km long southwestern escarpment of the depression is distinct and has a narrow erosional channel loop downstream from Lake Housujärvi (Fig. 2). Based on this channel, the water level reached an elevation of ~70 m a.s.l. The total cross-sectional area of these routes 600–800 m downstream from the radial imprint margin is ~1400 m2, with 5–6 m channel depths, assuming an approximate peat layer thickness of 1 m, evaluated from the map of Quaternary deposits (Kejonen and others, Reference Kejonen, Sten, Moisanen and Paukola1988a) (Fig. 2).
The outflow routes differ in their downstream topography. The base of the northern route rises downstream, whereas the southern route associated with the erosional escarpment has a downstream-declining base level until the basin of Lake Sääksjärvi. Furthermore, the GPR profile across the northern outflow route 1.3 km from the radial imprint margin, just before the appearance of the PMRs field, reveals a clear channel infill composed of two superimposed coarse-grained to fine-grained sediment sequences that reach the level of 69 m a.s.l. (Fig. 11).

Figure 11. Interpretation of the GPR profile (200 MHz) across the northern outflow route that begins from the Housujärvi fan-shaped hollow toward the PMRs field (see Fig. 3 for the location and position of turns). The depth scale is corrected below 69 m a.s.l. due to the groundwater-saturated sediments. The cross-sectional area of the outflow route is ~420 m2. Note the two main fine-grained units within the channel separated by boulder sediments. The contact between till and bedrock is mostly difficult to interpret. However, the more sorted sediments (SMR) are relatively well definable.
5. Discussion
Based on the sedimentology of the excavated channels and their relationship with the sediment infill and erosional pattern of the upstream radial imprint, it is evident that water flow processes were responsible for the origin of the radial imprint that is discussed in the present study. We consider three possible environments related to the formation of the radial imprint, which are (i) postglacial, referring to that occurring after the retreat of the FIS from the area, (ii) proglacial and ice-marginal and (iii) subglacial.
Postglacial environments would include shoreline processes during the regressive shoreline displacement, such as raised ancient shoreline formations like shore terraces and beach ridges (e.g. Ojala and others, Reference Ojala, Palmu, Åberg, Åberg and Virkki2013). These are absent from the study area. Furthermore, a radial pattern of shore erosion without any shore deposits in the depression is unlikely and the sediments in the main channels are glaciofluvial. Another post- or proglacial sedimentary environment potentially represented by the depression is filled and/or drained lake basins due to natural processes or by anthropogenic activities, such as ditching and land-use. However, there are no lacustrine sediments below the peat, which would indicate lake phases. Peat only fills the depression in the central part and there is no indication of rhythmically laminated clastic sediments or organic lacustrine sediments anywhere in the sequence (e.g. Zolitschka and others, Reference Zolitschka, Francus, Ojala and Schimmelmann2015). Furthermore, there are multiple meltwater outflow paths, indicating sudden and massive flooding, which is unlikely in Boreal lacustrine environment without any major rivers entering the basin. Additionally, there are no indications of human-made excavations along meltwater flow paths.
Regarding an ice-marginal environment, the depression of the radial imprint could be associated with a buried ice block, which melted away slowly. However, multiple meltwater flow paths indicate sudden flooding instead of a single channel flow related to slow melting. Boulder concentrations along the depression rim, channel infill sediments and washed diamicton instead support flooding followed by rapidly diminishing drainage event. Moreover, ice blocks often appear buried in glaciofluvial material, which is not the case here (Ahokangas and others, Reference Ahokangas, Mäkinen, Artimo, Pasanen and Vanhala2020). Ice-marginal fluvial processes are not likely, because there are no fluvial sediments, aside from upwards fining strata in the meltwater outflow channels.
We examine whether a subglacial origin is the most feasible explanation for the formation of the radial imprint. A subglacial origin could include a rhombohedral pattern of crevasse-fill ridges but because there is only a single landform, this explanation is very unlikely (e.g. Evans and others, Reference Evans, Storrar and Rea2016). The radial imprint could also be related to landforms formed through material being squeezed up into basal crevasses. However, ice disintegration or lateral pressure-induced ridging typically occurs under passive ice conditions and without significant volumes of meltwater at the bed, which is not the case in the present study area. Other possible origins to consider are Veiki and Pulju moraines. Pulju moraines in particular are geomorphologically the closest features to the presently described landform, because they are characterized by chaotic ridges with winding, hummocky appearance (Aartolahti, Reference Aartolahti1974; Alexanderson and others, Reference Alexanderson, Hättestrand, Lindqvist and Sigfúsdóttir2022). However, the present study site has only a single morphological form that is associated with warm and wet basal conditions instead of frozen bed conditions (e.g. Kleman and Hättestrand, Reference Kleman and Hättestrand1999), and shows glaciofluvial channels. Puljus also form <200 km from the ice divide and are found in valleys. Pothole origin is not evident, because the radial imprint is not eroded into the bedrock and does not imply rotational erosion. However, there might be a pothole covered by peat bog but the whole imprint cannot be treated as pothole. Potholes usually occur in a ribbon-like chain (e.g. Rosberg, Reference Rosberg1925; Jantunen, Reference Jantunen1996) and in narrow zones related to eskers (channelized flow) closer to the ice margin and therefore do not represent the radial feature that we are examining here.
Finally, we consider whether processes that formed the radial imprint are due to subglacial meltwater drainage, which is supported by the occurrence of the imprint in close association with an SMR (Mäkinen and others, Reference Mäkinen, Kajuutti, Palmu, Ojala and Ahokangas2017; Ahokangas and others, Reference Ahokangas2021). Confluence of subglacial channels is an unlikely explanation, because the channel infills indicate decreasing flood flow event and their base altitudes, as well as location of channels in relation to the hydraulic gradient inferred from the nearby murtoos do not support this. Furthermore, erosional features and channel infills indicate flooding that is apparently connected to the downstream meltwater route and hummocky landforms that reveal sediment deposition by flooding. The volume of the radial imprint as well as inflow and outflow channels (e.g. Nitsche and others, Reference Nitsche2013; Kirkham and others, Reference Kirkham2020) are within the same order of magnitude as some small subglacial lakes (Livingstone and others, Reference Livingstone2022). However, the radial pattern of erosional channels does not support a subglacial lake origin. The location of the imprint within the semi-distributed SMR drainage system does not infer extreme subglacial flooding from upstream and the blockage of the channels by ice is not likely, because there is no indication of deformed or consolidated sediments within the system. Furthermore, the small volume of the lake, without additional water input able to lift-up the ice, would unlikely be enough to sustain a subglacial outburst with related down-flow channels and hummocky terrain described herein. Therefore, our interpretation is that the most probable origin for the radial imprint is a subglacial environment with water input from the ice surface through a fracture or moulin. The hollow in the middle of the radial imprint implies that water was entering the central part of depression and evacuated in all directions, forming a water blister mark.
Subglacial water blisters have been recognized as features related to the rapid supraglacial drainage. Their subglacial traces or injection point marks have not so far been documented from the regions covered by past ice sheets, although there is an increasing coverage and availability of high-resolution LiDAR data from glaciated areas in the Northern Hemisphere. To our knowledge, we provide the first geomorphic and sedimentological evidence of a water blister in the FIS area that formed during the rapid Late Pleistocene to early Holocene deglaciation.
The area of the studied water blister (0.11 km) is considerably smaller than, for example, reported by Dow and others (Reference Dow2015, blister radius 2.8 km) or reported by Stevens and others (Reference Stevens2015, blister radius 2.5 km) from different regions of the western GrIS. As the area of a supraglacial lake (and therefore volume) is largely dictated by the basal topography (Dow and others, Reference Dow2015; Ignéczi and others, Reference Ignéczi, Sole, Livingstone, Ng and Yang2018), this difference in radius between the Greenland examples and the currently studied blister site might be driven by topography. However, the radial area of this depression and limited elevation change (~7 m) suggests it is unlikely to translate to a surface depression, which would prohibit the formation of a supraglacial lake (Gudmundsson, Reference Gudmundsson2003; Ignéczi and others, Reference Ignéczi, Sole, Livingstone, Ng and Yang2018).
An alternative explanation for the formation of a blister is the input of water from the surface via a moulin or hydrofracture of a crevasse with sufficient water supply to form a blister. At the beginning of the melt season, moulin input would be into an inefficient system and, during the time it would take for channel growth, a blister could form in the depression. Although too small to translate to surface topography, the depression containing the blister could be deep enough to prevent further radial expansion beyond the observed diameter of the feature. In the upstream direction, there is an increase of elevation by ~7 m and in the downstream direction, there are similarly elevated regions (5–6 m above the blister base) aside from channels that likely became increasingly efficient (due to R-channels melting into the ice base) and drained the blister water, preventing sufficient water depth to expand the blister beyond the 0.1 km radius.
Our earlier results (Mäkinen and others, Reference Mäkinen, Kajuutti, Palmu, Ojala and Ahokangas2017) at the FIS blister site suggest the presence of a semi-distributed (and therefore more efficient) drainage system prior to the formation of the blister. This system likely consisted of low and wide channels (up to 40 m wide), broad and low conduits (cf. murtoo formation with semi-sorted deposits; Mäkinen and others, Reference Mäkinen, Kajuutti, Palmu, Ojala and Ahokangas2017; Ojala and others, Reference Ojala2021) and fan-shaped hollows (Mäkinen and others, Reference Mäkinen, Kajuutti, Palmu, Ojala and Ahokangas2017) ~5.0 m-deep. These hydrology routes may have been sufficiently established to either persist over-winter from the previous melt-season or to reinitiate more rapidly than the blister could establish efficient drainage. However, once the blister connected to these more efficient routes, it would have drained rapidly. The hydrology routes with floods were probably similar to hydraulically connected distributed drainage described by Lewington and others (Reference Lewington, Livingstone, Clark, Sole and Storrar2020).
Based on the sedimentological evidence, the outflow channels from the blister show rapid deposition by subglacial debris flows and hyper-concentrated flows. The semi-sorted sediments were more easily saturated and eroded by the outflow joining the pre-existing drainage system. As suggested by the interpreted flood deposits within the PMRs field (Fig. 3), it is likely that one peak discharge flow event rapidly occupied the maximum cross-section of the broad and low outflow channels (cf. Russell and others, Reference Russell2010) (Fig. 8b). Russell and others (Reference Russell2010) considered that floodwater drained via an anastomosing system of broad low conduits, which later became choked with flood-transported sediment. This system would be comparable with the semi-distributed drainage system (with sorted sediments and water flow structures) described for the meltwater route herein, overlain by the sandy diamictons of PMRs. Evolution of the hydrological system would also have been partially controlled by rates of melt upwards into the ice, which would increase the rate of water evacuation from the area.
Following the surface-to-bed connection, it is reasonable to assume that supraglacial drainage continued through the subglacial drainage system after blister formation. However, if blister expansion rapidly reached the more efficient drainage system, the continued water input from the surface would have routed through the southern, downstream-inclined channel complexes where the water level after the peak flow was close to 70 m a.s.l. (i.e. the highest level of major outflow routes downstream) leading to a reduced cross-sectional area of ~600 m2. The distal infill of the northern outflow route implies that there were two main subsequent flow stages. These could represent blister flood peak discharge followed by continued drainage through the system (Fig. 9). Furthermore, the downstream-increasing base level and the associated distal channel infill of the northern outflow route (Fig. 11) probably indicate filling of the route in relation to diamicton infills of the more distal broad and low conduits forming PMRs (Fig. 8). Instead, the southern route remained more erosive, forming the final main outflow route from the blister site.
The base level of the blister outflow channels reduces southwards, which might indicate a shifting location of drainage following the short-lived peak discharge. Moreover, the base of the northernmost channel rises down-flow and the channel became rapidly filled with sediments eroded from the blister mark, reaching the erosional level of the blister at 72 m a.s.l. It is likely that the highly sediment-concentrated discharge through the subglacial system was a gradual process with limited outflow rates replacing turbulent sheet flow over a stiff bed with a low water content, as proposed by Dow and others (Reference Dow2015). The saturation and mass flow of subglacial sediments probably slowed down the expansion of the blister before the highest water pressure and related maximum uplift of the ice. Kulessa and others (Reference Kulessa2017) and Christoffersen and others (Reference Christoffersen2018) have emphasized the importance of subglacial sediment for the impact of supraglacial lake drainage.
The deposition within the outflow channels next to the blister probably occurred rapidly and during the culmination of the flood stage (cf. Salamon and Mendecki, Reference Salamon and Mendecki2021). The infill in outflow channels represents a rapid transition with a decreasing sediment load from debris flows to hyper-concentrated flows, transforming to flood or stream flows (cf. Pierson, Reference Pierson, Jakob and Hungr2005; Calhoun and Clague, Reference Calhoun and Clague2017). The sandy, massive and matrix-supported diamictons (or poorly sorted gravels) covering the stratified and better-sorted sediments of PMRs might be associated with the blister outflow occupying the entire width of the pre-existing SMR. This would be similar to spreading of subglacial flood flow from the central conduit (esker) to surrounding hummocky terrain, possibly akin to murtoos, as proposed by Lewington and others (Reference Lewington, Livingstone, Clark, Sole and Storrar2020), although in our case the apparent central conduit is missing. Massive gravels indicate rapid deposition from hyper-concentrated flows (cf. Salamon and Mendecki, Reference Salamon and Mendecki2021), with movement ‘en masse’ and the suspension of coarse sediment and gravel clasts (cf. Calhoun and Clague, Reference Calhoun and Clague2017). It should also be noted that the material characteristics of SMRs with murtoos and murtoo-related landforms increase the subglacial transmissivity when compared with areas composed of more consolidated, poorly sorted and less permeable basal tills. The overall downstream fining of sediment grain sizes within the PMR field could be related to the increasing transport distance from the blister. Moreover, it is also possible that the flows from the blister terminated in a subglacial lake occupying the basin of Lake Sääksjärvi.
The location of the proposed blister was probably influenced by the change in bedrock topography and structure (major fault zone) and the related change in glacial dynamics between the BSIL and the adjacent Loimaa sublobe (Mäkinen, Reference Mäkinen2003). This could have potentially allowed faster ice flow which, combined with ice flow from a lower to higher region, could have supported surface crevasse and moulin formation. These changes are supported by the glacial landforms, which display a transition from glacial lineations to ribbed/hummocky moraines, respectively. Based on the geomorphic evidence, and characteristics and distribution of flood-related sediments, we propose the following stages in the hydrological behavior of the currently studied blister (Fig. 12):
(1) Prior to blister surface-to-bed connection, a semi-efficient meltwater route with canals, broad and low conduits and fan-shaped hollows existed to the SE of the future blister site, representing a drainage transition 40–70 km from the ice margin (cf. Mäkinen and others, Reference Mäkinen, Kajuutti, Palmu, Ojala and Ahokangas2017; Davison and others, Reference Davison, Sole, Livingstone, Cowton and Nienow2019; Ahokangas and others, Reference Ahokangas2021; Ojala and others, Reference Ojala2021).
(2) Phase 1 in Figure 12: When water first reached the bed from the surface likely through a moulin or crevasse hydrofracture, the higher-than-overburden pressure drove the radial flow of the water rather than directing it downstream due to limited subglacial hydraulic efficiency. During this phase, there was limited outflow and erosion of the basal till.
(3) Phase 2 in Figure 12: As the blister expanded, there was minor uplift of the ice and water could overspill from the basin downstream. There was a gradually increasing outflow of highly sediment-concentrated flows.
(4) Phase 3 in Figure 12: Supraglacial drainage continued. The water flows entrained and transported increasing volumes of sediment as the discharge increased. The water flow then connected to the pre-existing channels of the semi-distributed drainage network of the adjacent SMR. The meltwater flow along the SMR became dammed. The outflow channels expanded due to the evacuation of sediments and accommodated the peak discharge from the blister. There was erosion of the fan-shaped hollow and downstream sediment transport through the semi-distributed system in the form of hyper-concentrated flows. Blister growth stopped, because of efficient subglacial drainage. As the peak flow and blister drainage ended, the decreasing meltwater flow caused rapid sedimentation from debris flows and hyper-concentrated flows and finally from channelized flood flows with a flow space of 0.5–1.0 m. The continued decrease in discharge produced stratified sand beds.
(5) Phase 4 in Figure 12: The high concentration of suspended mud deposited very poorly sorted, massive clayey pebble gravels by the meltwater flow after the blister event. Following blister drainage, it is likely that water continued to flow into the moulin and accessed the bed and into the formed subglacial channels.

Figure 12. Schematic representation of blister stages, with the in-plan view in the middle.
Blister formation was followed by the following stages:
(6) Laminated mud deposition by the limited water supply within the meltwater route margin toward the end of the melt season.
(7) The redeposition and deformation of laminated muds by renewed meltwater flow during the next spring. The moulin reformed in the same location, implying a surface velocity of <200 m per year. The moulin could persist in this region for about a year at this velocity before moving downstream of the blister.
(8) The deposition of SMR gravels, including murtoo and lateral channel sediments, eroding clayey sediments on the lowest lying outlet channel during the increased meltwater flow along the SMR and later deposition of surface boulders from the melting ice bottom.
(9) Ice-marginal to proglacial deposition of upward-fining clays in the blister.
(10) Wave-reworking and local deposition by shore processes during the Yoldia Sea phase.
(11) Peat deposition in the blister. The deformation of the uppermost sediments by forest bed processes.
Finally, we note that based on the preliminary screening of the LiDAR DEM from SW Finland, water blister marks similar to the one described here appear to be scarce. However, we provide two LiDAR DEM examples of radial imprints similar to the one described herein (Fig. 13). These examples are located within the SMRs of the Finnish Lake District Ice Lobe in central Finland. The scarcity of blister marks can be partly explained by the fact that most of the possible blister sites are now covered by peat bogs or lakes. Furthermore, it could be that blister marks have a poor preservation potential, as they became deformed by the overriding ice and subsequent deposition of subglacial and marginal tills. However, the study area experienced a rapid (350–400 m a–1) withdrawal of the ice margin (Sauramo, Reference Sauramo1923), which might have enhanced the preservation of the blister.

Figure 13. Two examples of radial imprints (potential water blister marks) within subglacial meltwater routes (SMR) of the Finnish Lake District Ice Lobe, central Finland. (a) Radial imprint from Kutunkylä, Suonenjoki (62°41,90326′/27°21,90747′). (b) Radial imprint from Oravasalo/Mikkeli (62°3,52955′/26°53,16143′). In both figures, solid arrows indicate SMR water flow direction and dashed lines display channels of the potential blister mark (background map source: LiDAR digital elevation model, © National Land Survey of Finland, 4/2023).
6. Conclusions
• This is the first sedimentological and LiDAR-based description of a water blister from a past ice-sheet bed. It was caused by early Holocene supraglacial drainage accessing the bed along an SMR within the transition from distributed to channelized drainage within the Fennoscandian Ice Sheet.
• The size of the blister was reduced by the pre-existing SMR with a semi-distributed and relatively efficient drainage system and related semi-sorted sediments, promoting rapid drainage.
• There was downflow (1–3 km) reworking of PMRs by flood-deposited sandy diamictons or poorly sorted gravels.
• The preservation potential or exposure probability of blister marks is presumably low, but they are possibly more common along SMRs.
Acknowledgements
This work is part of the RewarD project (MUST consortium), funded by the Academy of Finland (grant numbers 322243/Joni Mäkinen, University of Turku and 322252/Antti Ojala, University of Turku). Christine Dow was supported by the Canada Research Chairs Program (950–231237). We thank Juha Davidila and Juha Majaniemi from the Geological Survey of Finland for acquisition and processing of GPR data. We also acknowledge the landowners Ahlström Capital, Päivi Hallamaa-Tupi and Mikko Servo for granting permissions to excavate trenches. Special thanks to reviewer J.D. Kirkham and one anonymous reviewer, who considerably improved the quality of the manuscript.


 Open access