


Introduction
Across Asia and the Russian Far East the number of wild tigers Panthera tigris has declined by an estimated 50% since 1998 (Seidensticker et al., Reference Seidensticker, Christie and Jackson1999), and the species now occupies a mere 7% of its historical range (Dinerstein et al., Reference Dinerstein, Loucks, Wikramanayake, Ginsberg, Sanderson and Seidensticker2007). A report in 2016 suggested there had been a recent rise in tiger numbers, generating significant interest from governments, NGOs, donors and the media (WWF, 2016). Although this appears to be good news, it may reflect improved calculations based on more robust and widespread site-based monitoring, rather than a real increase in the overall population size (Karanth, Reference Karanth2016; Karanth et al., Reference Karanth, Miquelle, Goodrich and Gopalaswamy2016). This emphasizes the importance of obtaining reliable tiger population estimates to avoid unreliable reporting that draws attention away from other conservation goals or leads to the development of poorly informed strategies (Karanth et al., Reference Karanth, Nichols, Seidensticker, Dinerstein, Smith and McDougal2003).
Tigers are threatened primarily by habitat loss, illegal killing for international trade, and poaching of their ungulate prey base for domestic consumption (Bennett, Reference Bennett, Wuerthner, Crist and Butler2015). Despite these prevailing threats, a range-wide analysis found that given strong protection and management, enough wild habitat still remains to support a viable number of tigers (Joshi et al., Reference Joshi, Dinerstein, Wikramanayake, Anderson, Olson and Jones2016). Successful conservation of the species will require securing the 42 identified population source sites, which are considered to contain concentrations of tigers that, if well protected, have potential to repopulate larger landscapes (Walston et al., Reference Walston, Robinson, Bennett, Breitenmoser, da Fonseca and Goodrich2010). Most of these sites are within protected areas but this does not guarantee their safety, as many protected areas are under threat from downgrading, downsizing or degazettement (Mascia & Pailler, Reference Mascia and Pailler2011).
The UNESCO World Heritage Site tropical cluster of protected areas in Sumatra contains the three flagship national parks of Bukit Barisan Selatan (3,650 km2), Kerinci Seblat (13,895 km2) and Gunung Leuser (7,927 km2). These protected areas contain c. 60% of the Sumatran tiger Panthera tigris sumatrae population, which underlines their importance not only to the survival of this subspecies but also to tigers in general (Linkie et al., Reference Linkie, Wibisono, Martyr and Sunarto2008; HarimauKita, Reference HarimauKita2016). Despite the conservation efforts being implemented by the protected area management authorities, however, the parks face ongoing challenges and are on UNESCO's List of World Heritage In Danger (UNESCO, 2011).
In Kerinci Seblat a multi-agency law enforcement strategy has successfully tackled poaching of tigers and their prey (Linkie et al., Reference Linkie, Martyr, Harihar, Risdianto, Nugraha, Leader-Williams and Wong2015a; Risdianto et al., Reference Risdianto, Martyr, Nugraha, Harihar, Wibisono and Haidir2016). However, conservation gains are jeopardized by a recurring proposal by the local government to build a road that would bisect core tiger habitat and open it up to wildlife poachers and encroachers (ALERT, 2016). The Wildlife Crime Unit operating in Gunung Leuser since 2008 has disrupted a major trafficking network and facilitated the prosecution of 24 tiger poachers and traders operating in the Leuser landscape (Wildlife Conservation Society, unpubl. data). In parallel with this effort an adaptive management patrol system, SMART, has been fully operationalized during 2014–2017, with 21 ranger teams conducting frequent de-snaring patrols. This has led to the removal of hundreds of snare traps (Wildlife Conservation Society, unpubl. data). These law enforcement efforts have been supported by the government of Aceh province, in which 74% of the Park is located. In 2016 the provincial government declared a moratorium on oil palm development, which should protect critical forest habitat outside the Park (InfoSawit, 2016), and the government has also signalled its intention to withdraw support for the planned construction of a geothermal plant inside the Park (Hanafiah, Reference Hanafiah2017). This comes at a crucial time, as Gunung Leuser was downsized by 20% in 2013.
The recent history of Bukit Barisan Selatan National Park offers many salutary lessons in protected area management. The Park underwent 3 decades of relatively high forest loss, starting in the 1970s (Gaveau et al., Reference Gaveau, Wandono and Setiabudi2007). During 1998–2002 the first camera-trap surveys of Sumatran tigers were conducted. These yielded a Park-wide density of 1.6 tigers per 100 km2 but found lower densities in the central and more heavily deforested northern sections of the Park (O'Brien et al., Reference O'Brien, Kinnaird and Wibisono2003). In 2008 a survey of indirect sign across the Bukit Barisan Selatan landscape indicated a widespread tiger population (Wibisono et al., Reference Wibisono, Linkie, Guillera-Arroita, Smith, Sunarto and Pusparini2011). The central and southern sections were found to have higher tiger occupancy and were thus designated a tiger source site (Walston et al., Reference Walston, Robinson, Bennett, Breitenmoser, da Fonseca and Goodrich2010), and a Tiger Conservation Landscape (Global Tiger Initiative Secretariat, 2012). In 2008 the southern section came under the private management of the Tambling Wildlife Nature Conservation Area, where a strict approach to law enforcement has yielded the highest recorded tiger density on Sumatra: 6 tigers per 100 km2 (Maulana et al., unpubl. data; ScienceDaily, 2013).
The central forest block of Bukit Barisan Selatan contains the Park's entire population of Critically Endangered Sumatran rhinoceroses Dicerorhinus sumatrensis (Pusparini et al., Reference Pusparini, Sievert, Fuller, Randhir and Andayani2015) and was formally designated an Intensive Protection Zone in 2015 (PHKA, 2015). The 1,000 km2 Intensive Protection Zone covers seven resorts (Sukaraja, Pemerihan, Ngambur, Biha, Balai Kencana, Balik Bukit and Suoh), which are the smallest administrative units of the Park, and is prioritized for more intensive management, with the primary aim of protecting the small population of Sumatran rhinoceroses (PHKA, 2015). This type of zonation is a new concept for protected area management in Indonesia. It offers benefits to other priority species because it overlaps with core habitat for tigers and elephants Elephas maximus, which also rely on ranger patrols. Thus, the concept has potential as a replicable model for securing populations of threatened wildlife in other protected areas. Here we provide the first assessment of the Intensive Protection Zone in its efforts to secure threatened wildlife, specifically the Critically Endangered Sumatran tiger. We use new and enhanced field survey and data analysis techniques to investigate spatial and temporal associations between tigers and prey and the anthropogenic threats they face, particularly poaching.
Study area
Bukit Barisan Selatan National Park is located in the provinces of Lampung and Bengkulu. It is one of 23 landscapes in which the Sumatran tiger is still present (HarimauKita, Reference HarimauKita2016), and is designated a long-term priority Level III Tiger Conservation Landscape (Sanderson et al., Reference Sanderson, Forrest, Loucks, Ginsberg, Dinerstein and Seidensticker2006), and a priority site for tiger population recovery (Global Tiger Initiative Secretariat, 2012). The Park is at 0–1,964 m altitude and thus supports various rainforest types, from lowland to montane. The Park is surrounded by smallholder farms, cultivating mainly coffee and cocoa (Gaveau et al., Reference Gaveau, Wandono and Setiabudi2007). These farms comprise c. 17% of the Park, mainly in the eastern section, in the Sekincau region, and are inhabited by 16,522 families (TFCA Sumatera, 2010). The Park's elongated shape makes it easily accessible to wildlife poachers, collectors of non-timber forest products (NTFPs) and illegal loggers and encroachers (Gaveau et al., Reference Gaveau, Epting, Lyne, Linkie, Kumara, Kanninen and Leader-Williams2009). Our camera-trap survey focused on the middle section of the Park, which overlaps with 51% of the Intensive Protection Zone (Fig. 1). This area is the focus of long-term ranger patrols conducted in partnership with the Rhino Foundation of Indonesia (Yayasan Badak Indonesia).
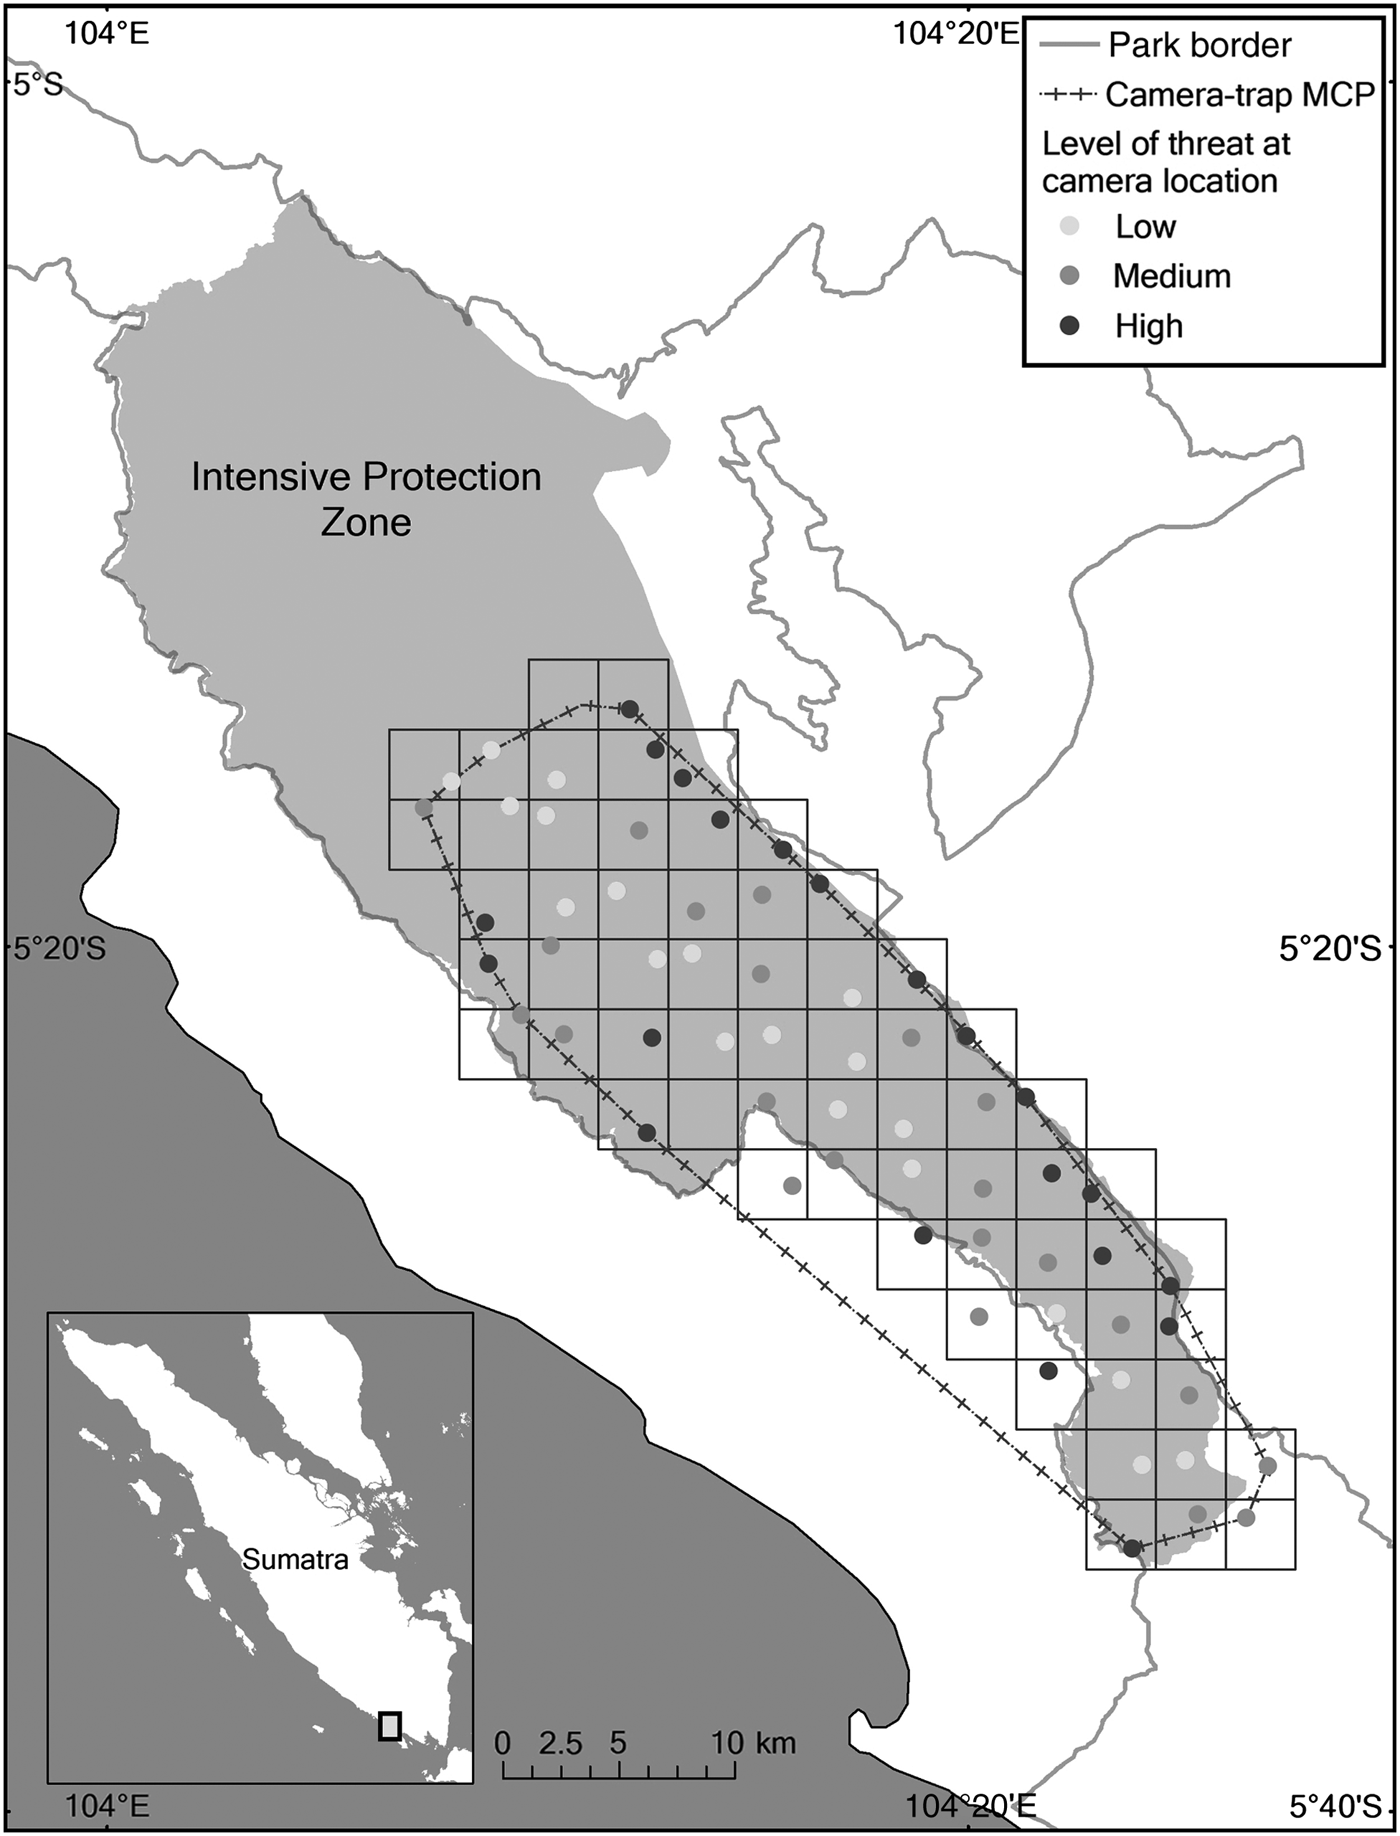
Fig. 1 Spatial distribution of the grid cells used in a camera-trap survey conducted in Bukit Barisan Selatan National Park, Sumatra, Indonesia, in two 90-day sessions during 21 May–20 November 2015, with the minimum convex polygon (MCP) of camera traps (Table 1) and the level of threat based on illegal human presence.
Methods
Data collection
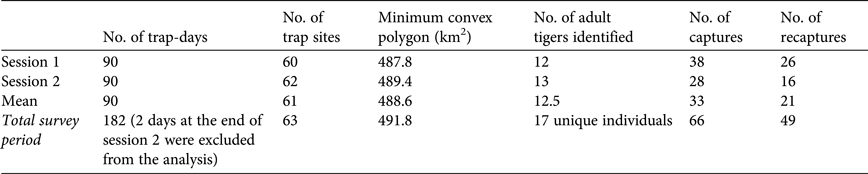
During 21 May–20 November 2015 (182 days) camera-trap surveys were conducted in 65 grid cells in a chequered arrangement. A pair of cameras was set in each cell (130 cameras in total), and each cell was 3 × 3 km, for a target trap spacing of 2–3 km (Pickles et al., Reference Pickles, Smith and Goodrich2014). Two pairs of cameras were stolen, and therefore data from 63 grid cells were analysed. In 20 other cells, one camera from the pair was lost. The camera-trap survey was conducted predominantly inside the Intensive Protection Zone, which is located between the roads of Sanggi-Bengkunat and Krui-Liwa, which bisect the Park. Four cameras were set in the bordering Protection Forest (Hutan Lindung), which falls under the jurisdiction of the provincial Forestry Agency, and the 61 set inside the Park were in the resorts of Biha (10 grid cells), Suoh (11), Ngambur (17), Sukaraja (17) and Pemerihan (6). Panthera V3 and V4 camera traps were set c. 45 cm above ground level at a mean distance of 2.2 m from the target forest trail. The cameras were set to be active for 90 days and were checked every 45 days. Each camera was equipped with a standard date–time stamp. To increase the probability of detecting tigers, a reconnaissance survey was conducted prior to camera-trap placement to identify candidate locations based on the presence and frequency of tiger signs encountered in the grid cells.
Data analysis
Camera-trap data were compiled to investigate the abundance, occupancy (probability of site use), and spatio-temporal interactions between tigers, prey and people. We divided our sampling period into two 90-day sessions (Table 1). Individual tigers were assigned unique identities based on their stripe markings on both sides. The tiger population was estimated using a spatially explicit capture–recapture technique, which is a development of the classical capture–mark–recapture approach, in which spatial data are included explicitly in the abundance estimation model (Efford et al., Reference Efford, Dawson and Robbins2004). Using secr 2.10.3 (Efford, Reference Efford2015a) in R 3.3.3 (R Development Core Team, 2016) we investigated the effect of session, sex and behaviour on capture probability at activity centre (g0), density, and the parameter of movement (σ). We ran the model in two steps, following the approach of Jędrzejewski et al. (Reference Jędrzejewski, Puerto, Goldberg, Hebblewhite, Abarca and Gamarra2017). A finite mixture model (Efford, Reference Efford2015b) was employed to estimate the population sex ratio. The model estimate pmix parameter is a mixing proportion of the various classes (i.e. sexes) and facilitates complex model structures such that the encounter probability can be modelled as class specific (Efford, Reference Efford2015a,Reference Effordb). Parameters for the spatially explicit capture–recapture model were estimated within a maximum likelihood framework, and models were selected using an information theoretic approach, with the Akaike information criterion corrected for a small sample size (AICc; Burnham et al., Reference Burnham, Anderson and Huyvaert2011).
Table 1 Details of a camera-trap survey of the Sumatran tiger Panthera tigris sumatrae conducted in Bukit Barisan Selatan National Park, Sumatra, Indonesia (Fig. 1), in two sessions during 21 May–20 November 2015, with number of trap-days, no. of trap sites, minimum convex polygon, number of adult tigers identified, number of captures, and number of recaptures.
To examine the factors driving the habitat use of four prey species (muntjac Muntiacus muntjak, sambar Rusa unicolor, wild pig Sus scrofa and pig-tailed macaque Macaca nemestrina) and tigers, and illegal human presence in the Park, single-species occupancy models were used, with covariates on detection (p) and occupancy (Ψ) (MacKenzie et al., Reference MacKenzie, Nichols, Lachman, Droege, Royle and Langtimm2002). The relationships between tigers and individual prey species, and between tigers and people, were investigated based on their spatial and temporal patterns. Spatial overlap was used as the first means of assessment. If two species were detected at the same camera station, the temporal overlap was also investigated. The models were run using trap-days as temporal replicate sampling occasions, with a constant total sampling occasion of 151 days across 63 sites. Some sites had fewer trap-days than others, and for these grids a missing value was assigned.
For the single-species occupancy model we tested three covariates for detection and 11 for occupancy. The covariates for detection were forest (binary), canopy openness and understorey cover, and those for occupancy were distances from forest edge, river and road, slope, elevation, distance from village, ruggedness index (the difference in elevation between adjacent cells of a digital elevation model, based on Riley et al., Reference Riley, DeGloria and Elliot1999), forest (binary), canopy openness, understorey cover, and number of independent instances of human presence detected (only in the sambar–tiger model). The forest covariates were generated from spatial analysis of a layer from Direktorat Jenderal Planologi Kehutantan dan Tata Lingkungan (2016). Canopy openness and understorey cover were the two covariates measured at each camera location. Canopy openness was measured using a densiometer, and understorey cover using a 100 × 100 cm quadrat frame sheet divided into 16 25 × 25 cm squares, to visually estimate the percentage cover of understorey vegetation in each cell; both were measured as the mean of readings from four cardinal points of a 10 × 10 m plot, per camera location. The human presence layer was derived from camera-trap data, and the remaining covariates were generated from the Wildlife Conservation Society's geographical information system database. Presence of multicollinearity between the independent covariates was tested using a Pearson correlation test and, using a threshold of > 0.7 (Gerstman, Reference Gerstman2003), none were found to be correlated.
Six models of single-species occupancy were run for the prey species, tigers and illegal human presence. In the first step of the modelling the detection parameters were fitted with covariates and the occupancy parameter was kept constant, and in the second step the top-ranking detection model from the first step and fitted covariates to several competing candidate occupancy models were used. The model selection procedure involved selecting the most parsimonious model based on the lowest AICc value (Burnham et al., Reference Burnham, Anderson and Huyvaert2011). The analysis was conducted using wiqid v. 0.0.403 (Meredith, Reference Meredith2015) in R.
To investigate temporal overlap we followed the approach developed by Linkie & Ridout (Reference Linkie and Ridout2011), conducting the analysis using overlap v. 0.2.6 (Meredith & Ridout, Reference Meredith and Ridout2016). For each species the number of independent photographs (detections) was calculated based on photographs of the same species taken at least 30 minutes apart at the same camera-trap location. The time stamp of each independent photograph was then used to estimate the activity pattern for each species, including people entering the study area. Temporal overlap was measured by constructing a probability distribution for each species and then overlaying this for two focal species to calculate a coefficient of overlap (Weitzman, Reference Weitzman1970), with 0 indicating no overlap, and 1 indicating complete overlap. This was defined as the area under the curve formed by taking the minimum of the two density functions at each time point. Confidence intervals were obtained as percentile intervals from running 9,999 bootstrap samples.
Records of people in the forest were grouped into five categories: National Park patrol team; researcher/survey team; armed poacher (i.e. carrying a gun); bird poacher (carrying bird cage traps); and NTFP collector (including fishers and resin collectors). We used the camera-trap records to estimate the temporal overlap between people entering the Park illegally and Park patrol teams. People were identified individually, to estimate the total number of people who entered the Park during the study period.
Results
Of the 130 cameras set, 23 were stolen and one was trampled by an elephant. With the remaining 106 cameras a mean survey effort of 1,584 trap-nights per 100 km2 over 7,774 trap-nights was achieved, with an effective sampling area of 969.5 km2 and mean camera spacing of 2.1 km. We recorded 3,280 independent photographs of 35 species from 23 families, including three Critically Endangered, three Endangered and six Vulnerable species (Table 2). From the photographs we identified 141 people who entered the Park illegally during the survey period.
Table 2 Records of tigers, their prey species, other Vulnerable, Endangered and Critically Endangered species, and illegal human presence captured by camera traps in Bukit Barisan Selatan National Park, Sumatra, Indonesia (Fig. 1), in two 90-day survey sessions during 21 May–20 November 2015.
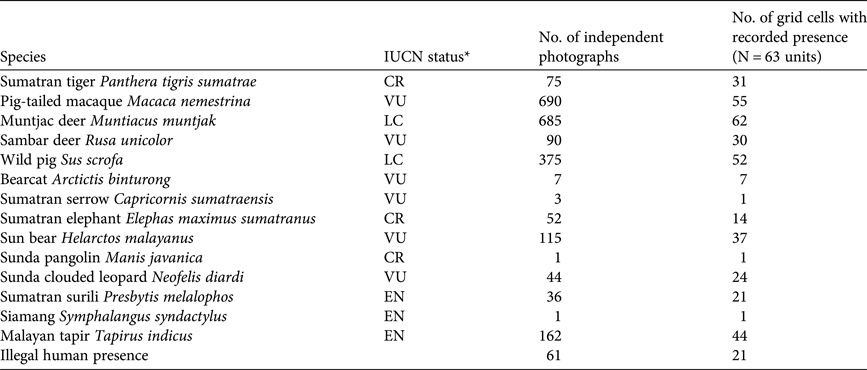
* CR, Critically Endangered; EN, Endangered; VU, Vulnerable; LC, Least Concern
Tiger abundance
Twelve individual tigers were identified in the first session and 13 in the second session (17 individuals in total; Table 1). As not all individuals could be sexed from the camera-trap photographs (10 females, four males and three of unknown sex), the hcov function in secr was used to fit a hybrid mixture model, to allow for missing categorical covariates (Efford, Reference Efford2015b). Of the various candidate models run, the most parsimonious model included sex as affecting tiger capture probability (Table 3). Males were detected more frequently (p̂ = 0.016) than females (0.003), with a male : female ratio of 1 : 3.3. There was no difference in the movement parameter (σ) between male and female tigers; detection of both sexes decreased rapidly at a distance of 3.4 km (σ) from the activity centre. The most parsimonious model yielded a density estimate of 2.8 adult tigers per 100 km2 (95% CI 1.7–4.4) in both 90-day sessions, with an estimated abundance (realized N) of 28 adult tigers (95% CI 22–38) in the first session and 29 (95% CI 23–39) in the second session. Neither learned response nor survey session affected estimates of density, capture probability or the movement parameter.
Table 3 Model selection results for spatially explicit capture–recapture models analysed in secr 2.10.3, with two sessions, learned response (b, behaviour) and two sex state groups as covariates.
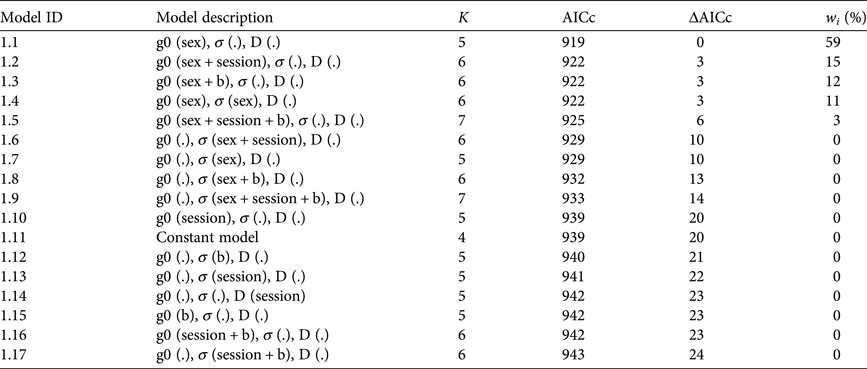
1K, number of parameters
2AICc, Akaike information criterion corrected for small sample size
3ΔAICc , difference between AICc of the model and that of the top-ranking model
4 w i , Akaike weight
Spatial patterns
We found widespread occurrence of muntjac ( $\hat \psi $
0.98, 95% CI 0.08–0.99), wild pigs (0.85, 0.67–0.94) and pig-tailed macaques (0.89, 0.68–0.96), whereas sambar were less widespread (0.61, 0.40–0.67), occurring in just over half of the grid cells (Supplementary Table S1). Wild pigs were found to occupy areas closer to the edge of the Park, muntjac were found to occupy areas closer to the road, and sambar and pig-tailed macaques were found to occupy areas further from the road. Muntjac were also found to be associated with thick understorey growth, sambar were found in flatter areas, and pig-tailed macaques were found away from the river. The cameras also detected people present illegally in the Park (0.38, 0.23–0.56), and their presence overlapped with that of tigers (0.65, 0.45–0.81) in 17% of the grid cells. Tiger occupancy was not influenced by any covariates, whereas human presence was influenced by distance to settlements. People were found to occur in 36% of the cells, and most were detected within 1.5 km of the Park border.
$\hat \psi $
0.98, 95% CI 0.08–0.99), wild pigs (0.85, 0.67–0.94) and pig-tailed macaques (0.89, 0.68–0.96), whereas sambar were less widespread (0.61, 0.40–0.67), occurring in just over half of the grid cells (Supplementary Table S1). Wild pigs were found to occupy areas closer to the edge of the Park, muntjac were found to occupy areas closer to the road, and sambar and pig-tailed macaques were found to occupy areas further from the road. Muntjac were also found to be associated with thick understorey growth, sambar were found in flatter areas, and pig-tailed macaques were found away from the river. The cameras also detected people present illegally in the Park (0.38, 0.23–0.56), and their presence overlapped with that of tigers (0.65, 0.45–0.81) in 17% of the grid cells. Tiger occupancy was not influenced by any covariates, whereas human presence was influenced by distance to settlements. People were found to occur in 36% of the cells, and most were detected within 1.5 km of the Park border.
Based on the camera-trap results, illegal presence inside the forest was divided into two main categories: armed poachers (in nine cells), and people who did not carry a gun (NTFP collectors and bird poachers; in 21 cells; Table 4). Some people (12%) covered their faces to hide their identity when passing the camera traps; however 88% did not, and were recorded moving back and forth through the same locations several times, at 2-hour intervals, on average. Armed poachers were recorded only in the resorts of Biha and Ngambur, whereas unarmed people were recorded in all five of the resorts surveyed. Of the 31 sites where tigers were recorded, the presence of people was recorded at 11 (35% overlap), and sambar were recorded at 10 (33% overlap).
Table 4 Details of human presence recorded by camera traps in Bukit Barisan Selatan National Park, Sumatra, Indonesia (Fig. 1), in two 90-day survey sessions during 21 May–20 November 2015, with number of people recorded, number of incidents, and number of grid cells in which people were recorded.

Temporal patterns
Temporal activity patterns revealed that tigers were mostly crepuscular and had the highest overlap with muntjac ( $\hat \Delta $
= 0.79, 95% CI 0.69–0.86), followed by sambar (0.71, 0.60–0.84), pig-tailed macaques (0.61, 0.50–0.70) and wild pigs (0.57, 0.44–0.65) (Fig. 2). The overlap between tigers and people in the Park was 0.62 (95% CI 0.49–0.73). Disaggregating between the types of people revealed that the patrol personnel recorded in the camera traps were active mostly during the daytime (Fig. 3), overlapping most with bird poachers (0.66, 95% CI 0.43–0.89) and NTFP collectors (0.60, 0.32–0.82), and least with armed poachers, who were active mostly at night (0.31, 0.12–0.59).
$\hat \Delta $
= 0.79, 95% CI 0.69–0.86), followed by sambar (0.71, 0.60–0.84), pig-tailed macaques (0.61, 0.50–0.70) and wild pigs (0.57, 0.44–0.65) (Fig. 2). The overlap between tigers and people in the Park was 0.62 (95% CI 0.49–0.73). Disaggregating between the types of people revealed that the patrol personnel recorded in the camera traps were active mostly during the daytime (Fig. 3), overlapping most with bird poachers (0.66, 95% CI 0.43–0.89) and NTFP collectors (0.60, 0.32–0.82), and least with armed poachers, who were active mostly at night (0.31, 0.12–0.59).
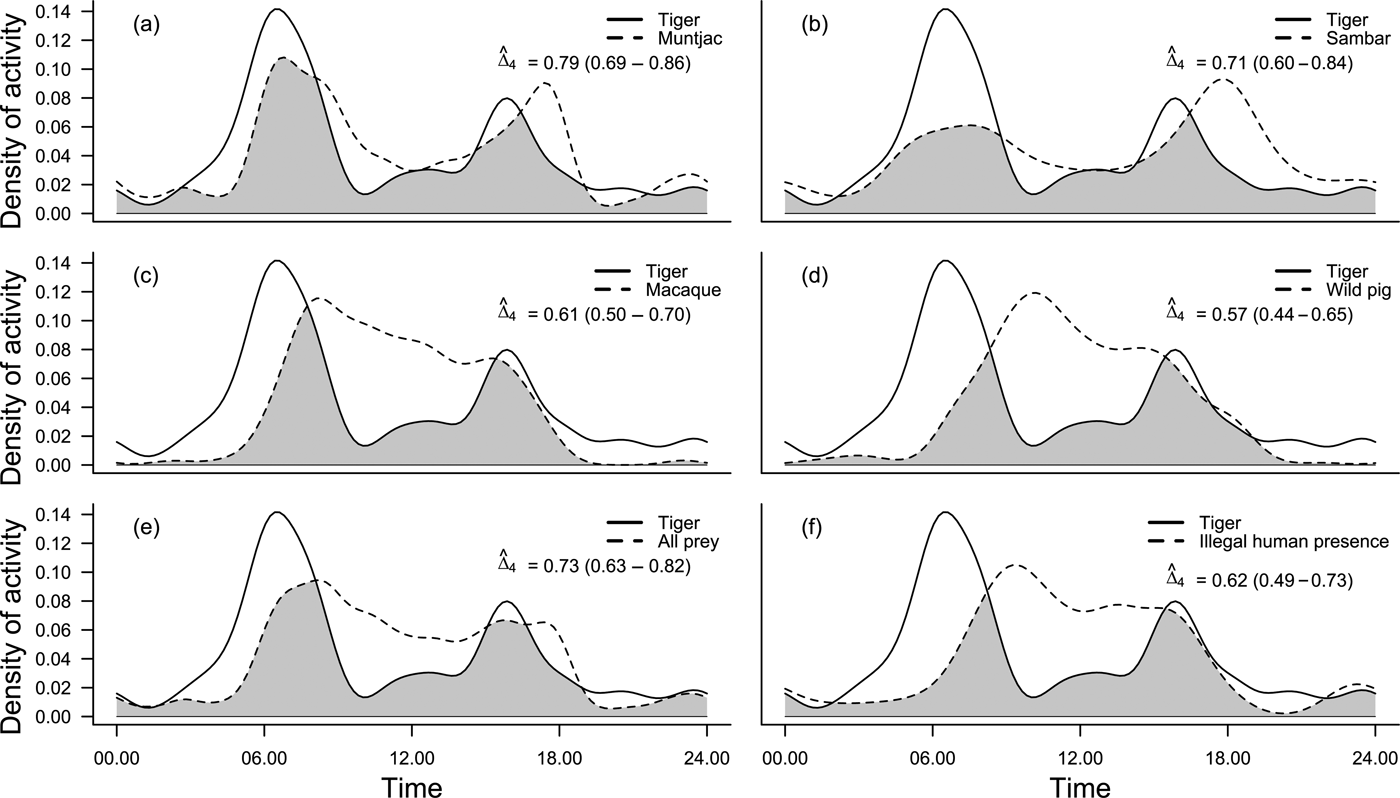
Fig. 2 Estimates of the daily activity patterns of tigers Panthera tigris sumatrae and their principal prey species, and illegal human presence, in the Intensive Protection Zone of Bukit Barisan Selatan National Park, Sumatra, Indonesia (Fig. 1). The solid and dashed lines are kernel density estimates based on the timing of individual photographs. The estimate of overlap is indicated in each plot, with 95% bootstrap CI.
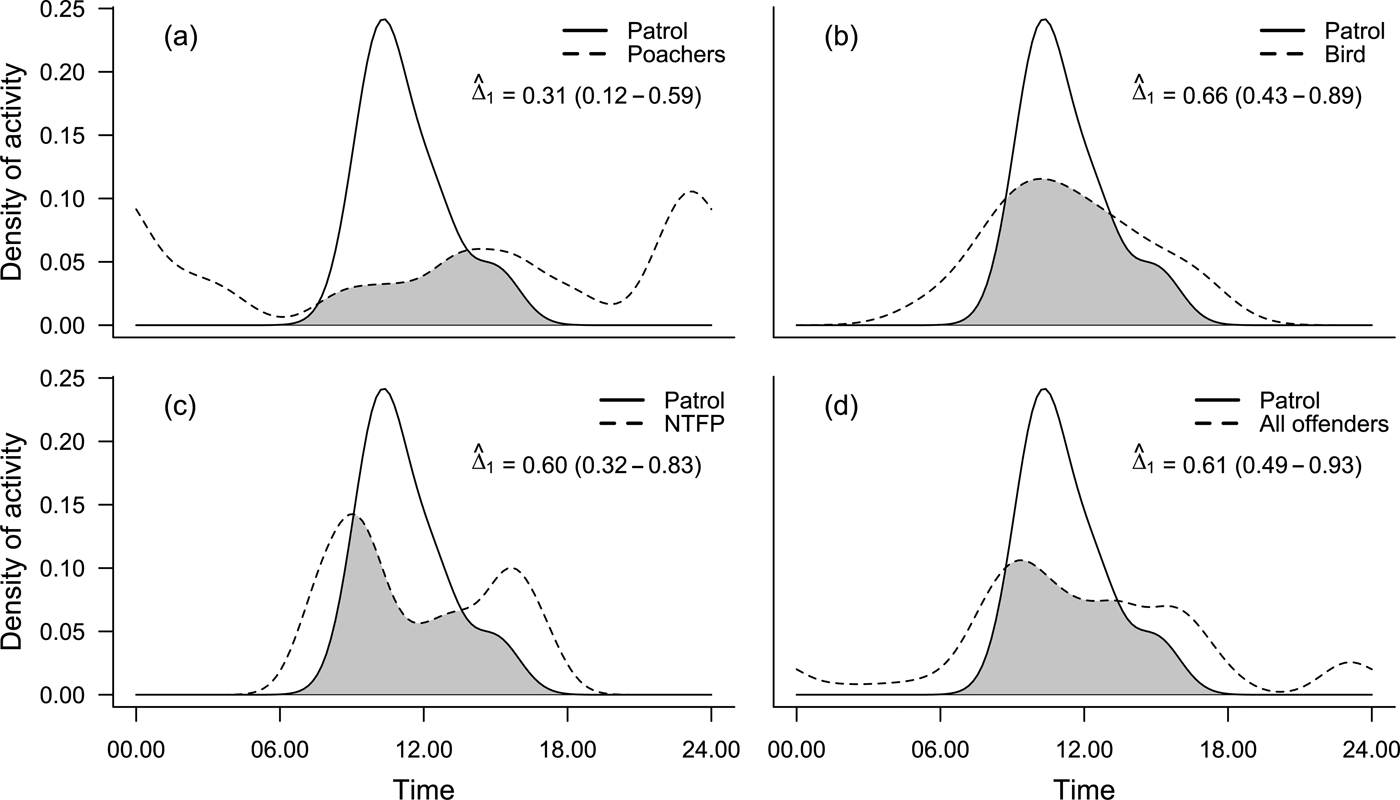
Fig. 3 Estimates of the daily activity patterns of (a) patrol teams and poachers, (b) patrol teams and bird collectors, (c) patrol teams and NTFP collectors, and (d) patrol teams and all people conducting illegal activities in the Intensive Protection Zone of Bukit Barisan Selatan National Park, Sumatra, Indonesia (Fig. 1). The solid and dashed lines are kernel density estimates based on the timing of individual photographs. The estimate of overlap is indicated in each plot, with 95% bootstrap CI.
Discussion
Our density estimate for the tiger subpopulation in the Intensive Protection Zone of Bukit Barisan Selatan National Park, as well as the widespread prey base recorded, offers hope for a site on UNESCO's List of World Heritage In Danger (UNESCO, 2011). Our density estimate is towards the upper limit for tigers occurring in South-east Asia (Rayan & Linkie, Reference Rayan and Linkie2015; Duangchantrasiri et al., Reference Duangchantrasiri, Umponjan, Simcharoen, Pattanavibool, Chaiwattana and Maneerat2016), and suggests an increasing population trend in comparison to earlier estimates from the Park, making it a rarity amongst range-wide source sites. These results are initially surprising given the relatively high number of armed poachers, and people in general, found inside the Park, but the Intensive Protection Zone also has one of the highest densities of rangers in Sumatra (Linkie et al., Reference Linkie, Nugraha, Hardiana, Prayitno, Rubianto and Sectionov2015b) and is connected to the strictly protected Tambling Wildlife Nature Conservation Area, which has an even higher density of tigers (Maulana et al., unpubl. data; ScienceDaily, 2013).
Tiger abundance
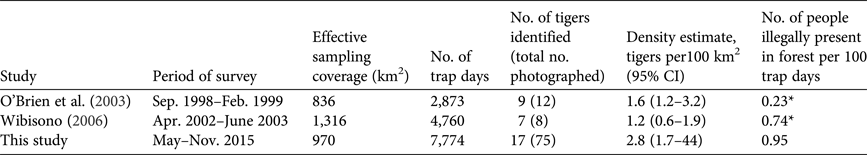
Previous tiger density estimates for Bukit Barisan Selatan National Park were 1.6 (1.2–3.2) tigers per 100 km2 in 2002 (O'Brien et al., Reference O'Brien, Kinnaird and Wibisono2003) and 1.2 (0.56–1.87) tigers per 100 km2 in 2006 (Wibisono, Reference Wibisono2006). These estimates were derived using a non-spatially explicit capture–mark–recapture analytical technique, which tends to produce elevated estimates with lower precision in comparison to the spatially explicit capture–recapture approach used here (Rich et al., Reference Rich, Kelly, Sollmann, Noss, Maffei and Arispe2014). The 2002 and 2006 studies were both Park-wide, whereas our study focused only on the Intensive Protection Zone (Table 5). Although we cannot therefore directly compare the previous studies with ours, the previous studies recorded no tigers inside what has since become the Intensive Protection Zone. Regardless, the high number of individuals we recorded (17) and frequent recaptures (75 independent photographs) is indicative of a healthy resident population. Our density estimate is similar to that from a study in Kerinci Seblat National Park (2.0–3.3 tigers per 100 km2), which shares both a similar hill forest habitat type and a successful long-term law enforcement intervention (Linkie et al., Reference Linkie, Chapron, Martyr, Holden and Leader-Williams2006, Reference Linkie, Martyr, Harihar, Risdianto, Nugraha, Leader-Williams and Wong2015a).
Table 5 Comparison of this study with previous studies of the tiger population in Bukit Barisan Selatan National Park, Sumatra, Indonesia (Fig. 1).
* Calculated for the same area covered by this study
The comparison of encounter probabilities between male and female tigers indicated a difference in movement, with males requiring more frequent movement to maintain their larger territories against competing males. We found the sex ratio of the tiger population in our study area to be skewed towards females, as is typically found in other tiger populations (Smith & McDougal, Reference Smith and McDougal1991). Many previous camera-trap studies have not included the estimation of sex ratio in their analysis. A hybrid mixture model such as that used here is useful because the presence of various groupings within the data, such as the sexes, can be modelled explicitly for varying capture probabilities.
The widespread and varied tiger-prey base was another encouraging sign from the Intensive Protection Zone, with wild pigs, muntjac, and pig-tailed macaques predicted to occupy nearly every grid cell, and sambar, which is the most sought-after wild meat (IRF, 2013), occupying c. 50% of the grid cells. The crepuscular tiger showed high temporal overlap with muntjac and sambar, indicating the importance of these two prey species. Thus, with the high availability of a diverse prey base, there is the potential to increase the tiger subpopulation within the Intensive Protection Zone and for it to expand to the northern section.
Threats
From an intense sampling effort within the Intensive Protection Zone and adjacent protected forest, tigers were recorded in c. 65% of the area and almost 30% of the records were from the edge of the Park. This is in stark contrast to findings from Bukit Barisan Selatan in 2002, when tigers were found to avoid edge areas by up to 2 km (O'Brien et al., Reference O'Brien, Kinnaird and Wibisono2003). The large number of cameras stolen during this study is one indicator of the high level of illegal activity in the forest and, by extension, pressure on the Park. This is confirmed by the large number of people photographed, many carrying firearms, presumably with the intention of hunting large mammals such as elephants, rhinoceroses and tigers. Armed poachers were detected mainly at the edge of the Park. Only 18% of the people recorded covered their faces while passing a camera trap. Those who did not shy away from the camera traps were often recorded making funny faces or waving at the camera, a show of bravado that suggests that the Park and its strategy are not having the desired deterrent effect. Those carrying guns were recorded mostly at night (Fig. 3), whereas patrol activity takes place mostly in the daytime. Most poachers with guns were recorded in Biha and Ngambur resorts.
Law enforcement inside the Park is primarily conducted by Rhinoceros Protection Units (a partnership between the Park authorities and the local NGO Yayasan Badak Indonesia), and these were the only law enforcement teams recorded by the camera traps. However, these patrol efforts are supported by teams that patrol along the Park border and the periphery of the Intensive Protection Zone (a partnership between the Park authorities and the Wildlife Conservation Society). All patrol units are active during the day, when they are likely to encounter NTFP collectors and bird poachers but less likely to apprehend armed poachers hunting the species that the teams are trying to protect. The situation underlines a complex challenge, given the inherent risks associated with searching for armed poachers in the dark.
Increasing the spatial coverage of patrols and the frequency of visits to sites is a realistic strategy to enhance patrolling of the Park. We therefore recommend increasing the law enforcement presence to 0.07 rangers per km2, based on a ranger density that proved to be sufficiently high for protecting tigers in a World Heritage Site in Thailand (DNPWPC, 2012). For the 1,000 km2 Intensive Protection Zone this would require the addition of 17 new rangers (in four new teams), assuming that the existing 54 rangers and 12 teams remained wholly focused on the Intensive Protection Zone. To complement this, we make a more general recommendation of working with community and government stakeholders to identify local solutions to restore the degraded forest inside the Intensive Protection Zone, and to implement these to create a fully forested area. This dual approach could see the removal of Bukit Barisan Selatan National Park from UNESCO's List of World Heritage In Danger, and its progression to becoming a model protected area for Indonesia.
Acknowledgements
The Wildlife Conservation Society authors are grateful to the Indonesian Ministry of Environment and Forestry, especially the Bukit Barisan Selatan National Park (BBSNP) Management Authority, for granting permission to conduct the field surveys, and Park staff for assisting with the data collection. We thank Panthera for funding the camera-trapping work, and U.S. Fish & Wildlife Service for its long-term species conservation support in BBSNP, Matthew Linkie for reviewing and supporting the development of this article, Mike Meredith for discussions about statistics, and Andi Cahyana for preparing the map.
Author contributions
WP conceived and designed the survey and wrote the article. WP, FS, A, and TS conducted the survey. WP and A analysed the data. TB, MS, FA, MM, WMR and NA contributed study/analysis tools.
Biographical sketches
Wulan Pusparini has been studying Sumatran tigers since 2009 and her interest is in ecology and population modelling of large tropical mammals. Timbul Batubara has more than 30 years’ experience in biodiversity conservation in Indonesia, and is interested in effective implementation of protected areas. Fahrudin Surahmat has broad research interests, including insects and plants. He coordinates the WCS South Sumatra biodiversity survey. Ardiantiono studies interactions between people and wildlife, and conflict mitigation strategies. Tri Sugiharti is a forest ecosystem conservation coordinator in Bukit Barisan Selatan National Park and has extensive experience in managing wildlife population surveys. Muhammad Muslich is interested in implementing effective conservation management. Fahrul Amama is interested in developing community support for conservation through education and outreach. William Marthy’s research interest is in ecological modelling of bird communities in Sumatra. Noviar Andayani is a senior conservation geneticist and has led the WCS Indonesia Program since 2004.


