


1. Introduction
A new Antarctic subglacial drilling rig (ASDR) has been developed in the Polar Research Center at Jilin University, China. The electrical and electronic control system plays one of the key roles in drilling operations. The reliability of the control system determines the performance of the drilling process, and is a critical factor of success for the ice and subglacial bedrock drilling project (Fujii and others, Reference Fujii2002; Mortensen and others, Reference Mortensen, Sendelbach and Shturmakov2007; Panichi and others, Reference Panichi2007).
Recent experience with deep electromechanical drilling has shown that the main actions for future improvements should be aimed at increasing the production rate and safety of the drilling process and decreasing the accident rate (Talalay, Reference Talalay2016). This aim could be achieved mainly by using an advanced monitoring and control system for the drilling process.
The drilling process proceeds without visual access of the operator, and the information is obtained from sensors, which send special signals through the communication channel (cable) to the transmission and amplification system and then to the display and recording devices. An effective data acquisition and drilling process control is the guarantee for the quality of the borehole and core samples. The control system was tested during the 2018–2019 summer season near Zhongshan Station, East Antarctica in a course of drilling to the bedrock at a depth of 198 m. Three related papers describe the general concept of the drilling rig (Talalay and others, Reference Talalay2021a), Ice and Bedrock Electromechanical Drill (IBED) (Talalay and others, Reference Talalay2021b) and auxiliaries (Fan and others, Reference Fan2021).
2. Composition of electrical and electronic control system
The control system of the ASDR can be subdivided into three subsystems: surface, borehole and software. The overall schematic representation of the control system is shown in Figure 1.
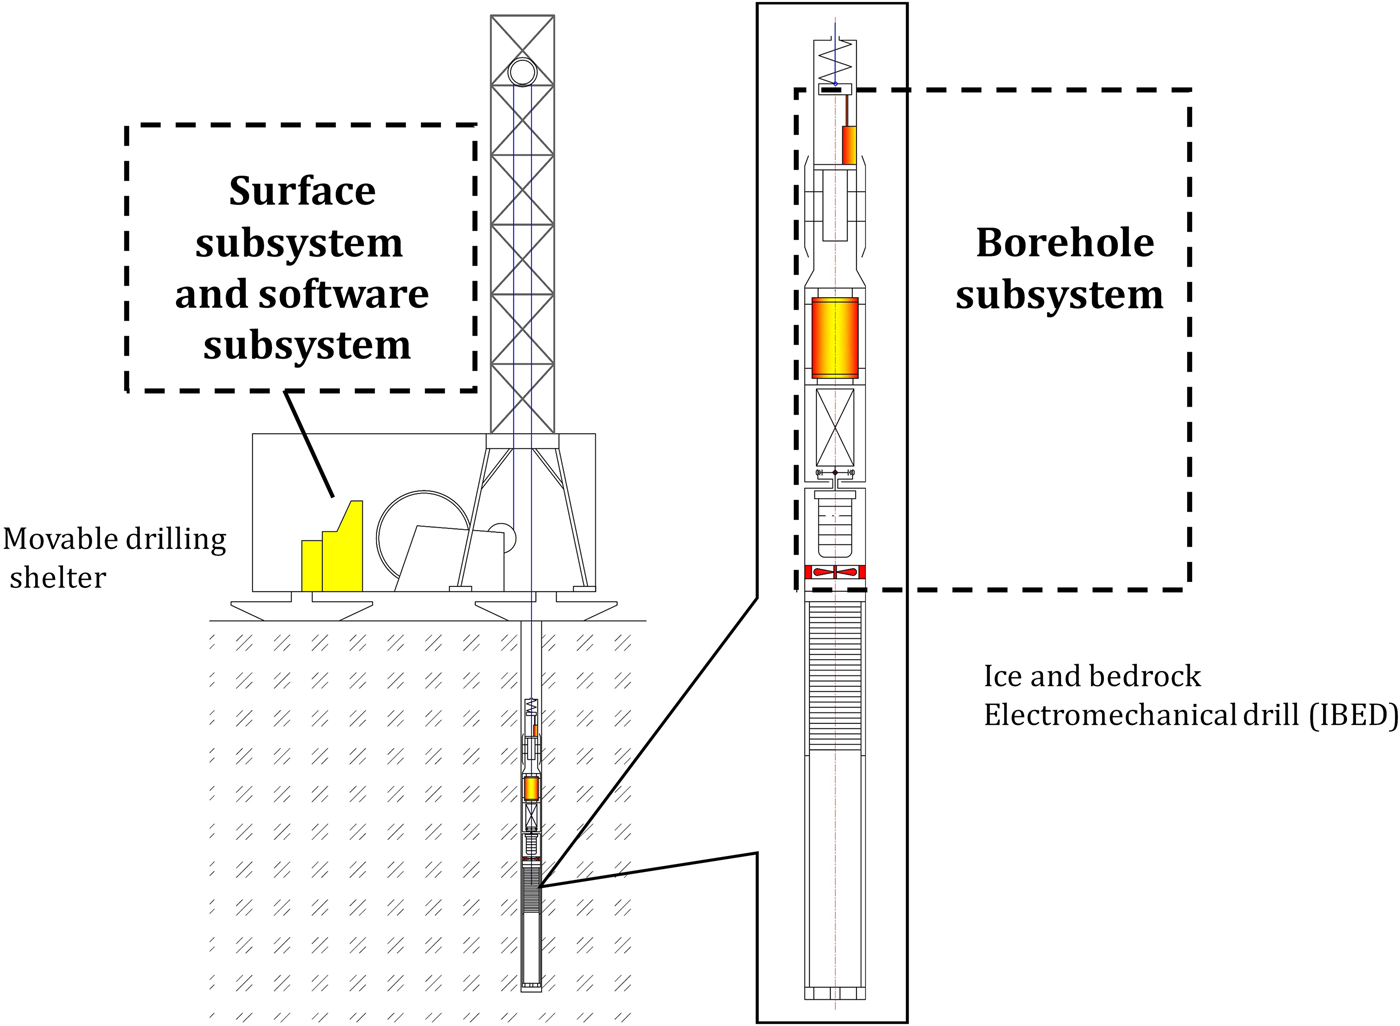
Fig. 1. Overall schematic representation of the ASDR control system.
The functions of the surface subsystem are as follows: (1) measurement and control of the surface winch and drilling parameters; (2) recording and storage of drilling data from the borehole subsystem and environmental parameters outside of the drilling shelter; (3) power supply and regulation for the drill motor, electrical pressure chamber in the borehole and sensors; (4) long-distance signal transmission.
The functions of the borehole subsystem are as follows: (1) measurements and signal collection of real-time temperature and pressure in the electronic pressure chamber, current drill azimuth, inclination and angular acceleration, real-time cutter load, real-time temperature in the borehole, real-time flow rate of drilling fluid circulation, and rotational speed and electric current of the drill motor; (2) conversion and uploading of all borehole signals to the surface subsystem via the data bus.
The functions of the software subsystem are as follows: (1) human–computer interaction (host computer interface programs); (2) data processing and operation of running parameters of the drilling equipment (signal processing programs); (3) signal conversion and communication (CPU and data sending unit programs).
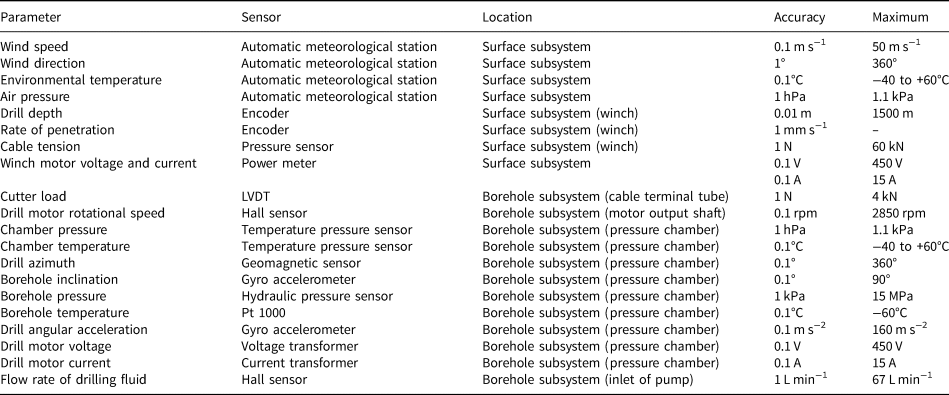
The chosen parameters are detected by various sensors (Table 1), and detailed designs and specifications will be described in subsequent sections.
Table 1. Sensors and technical data
3. Surface subsystem
3.1. Schematic design
The surface subsystem is designed according to the scheme shown in Figure 2. The host computer in the surface subsystem collects the environmental parameters that are detected by an automatic meteorological station, the drilling parameters that are transmitted from the data sending unit in the borehole subsystem, and the winch motor parameters via a 485 bus. The drill depth, penetration speed and cable tension are collected by the winch controller. Considering the voltage loss in a 1500 m-long cable, the voltage of the three-phase supply power for the drill motor is stepped up by a voltage regulator prior to supply (Erickson and Maksimovic, Reference Erickson and Maksimovic2001). For electric circuit simplification, independent 220 VAC power is supplied to the borehole for the DC power of electronic components, which is transformed in the borehole pressure chamber. All the parameters of the drill system are displayed on an interface setup in the host computer after decoding.
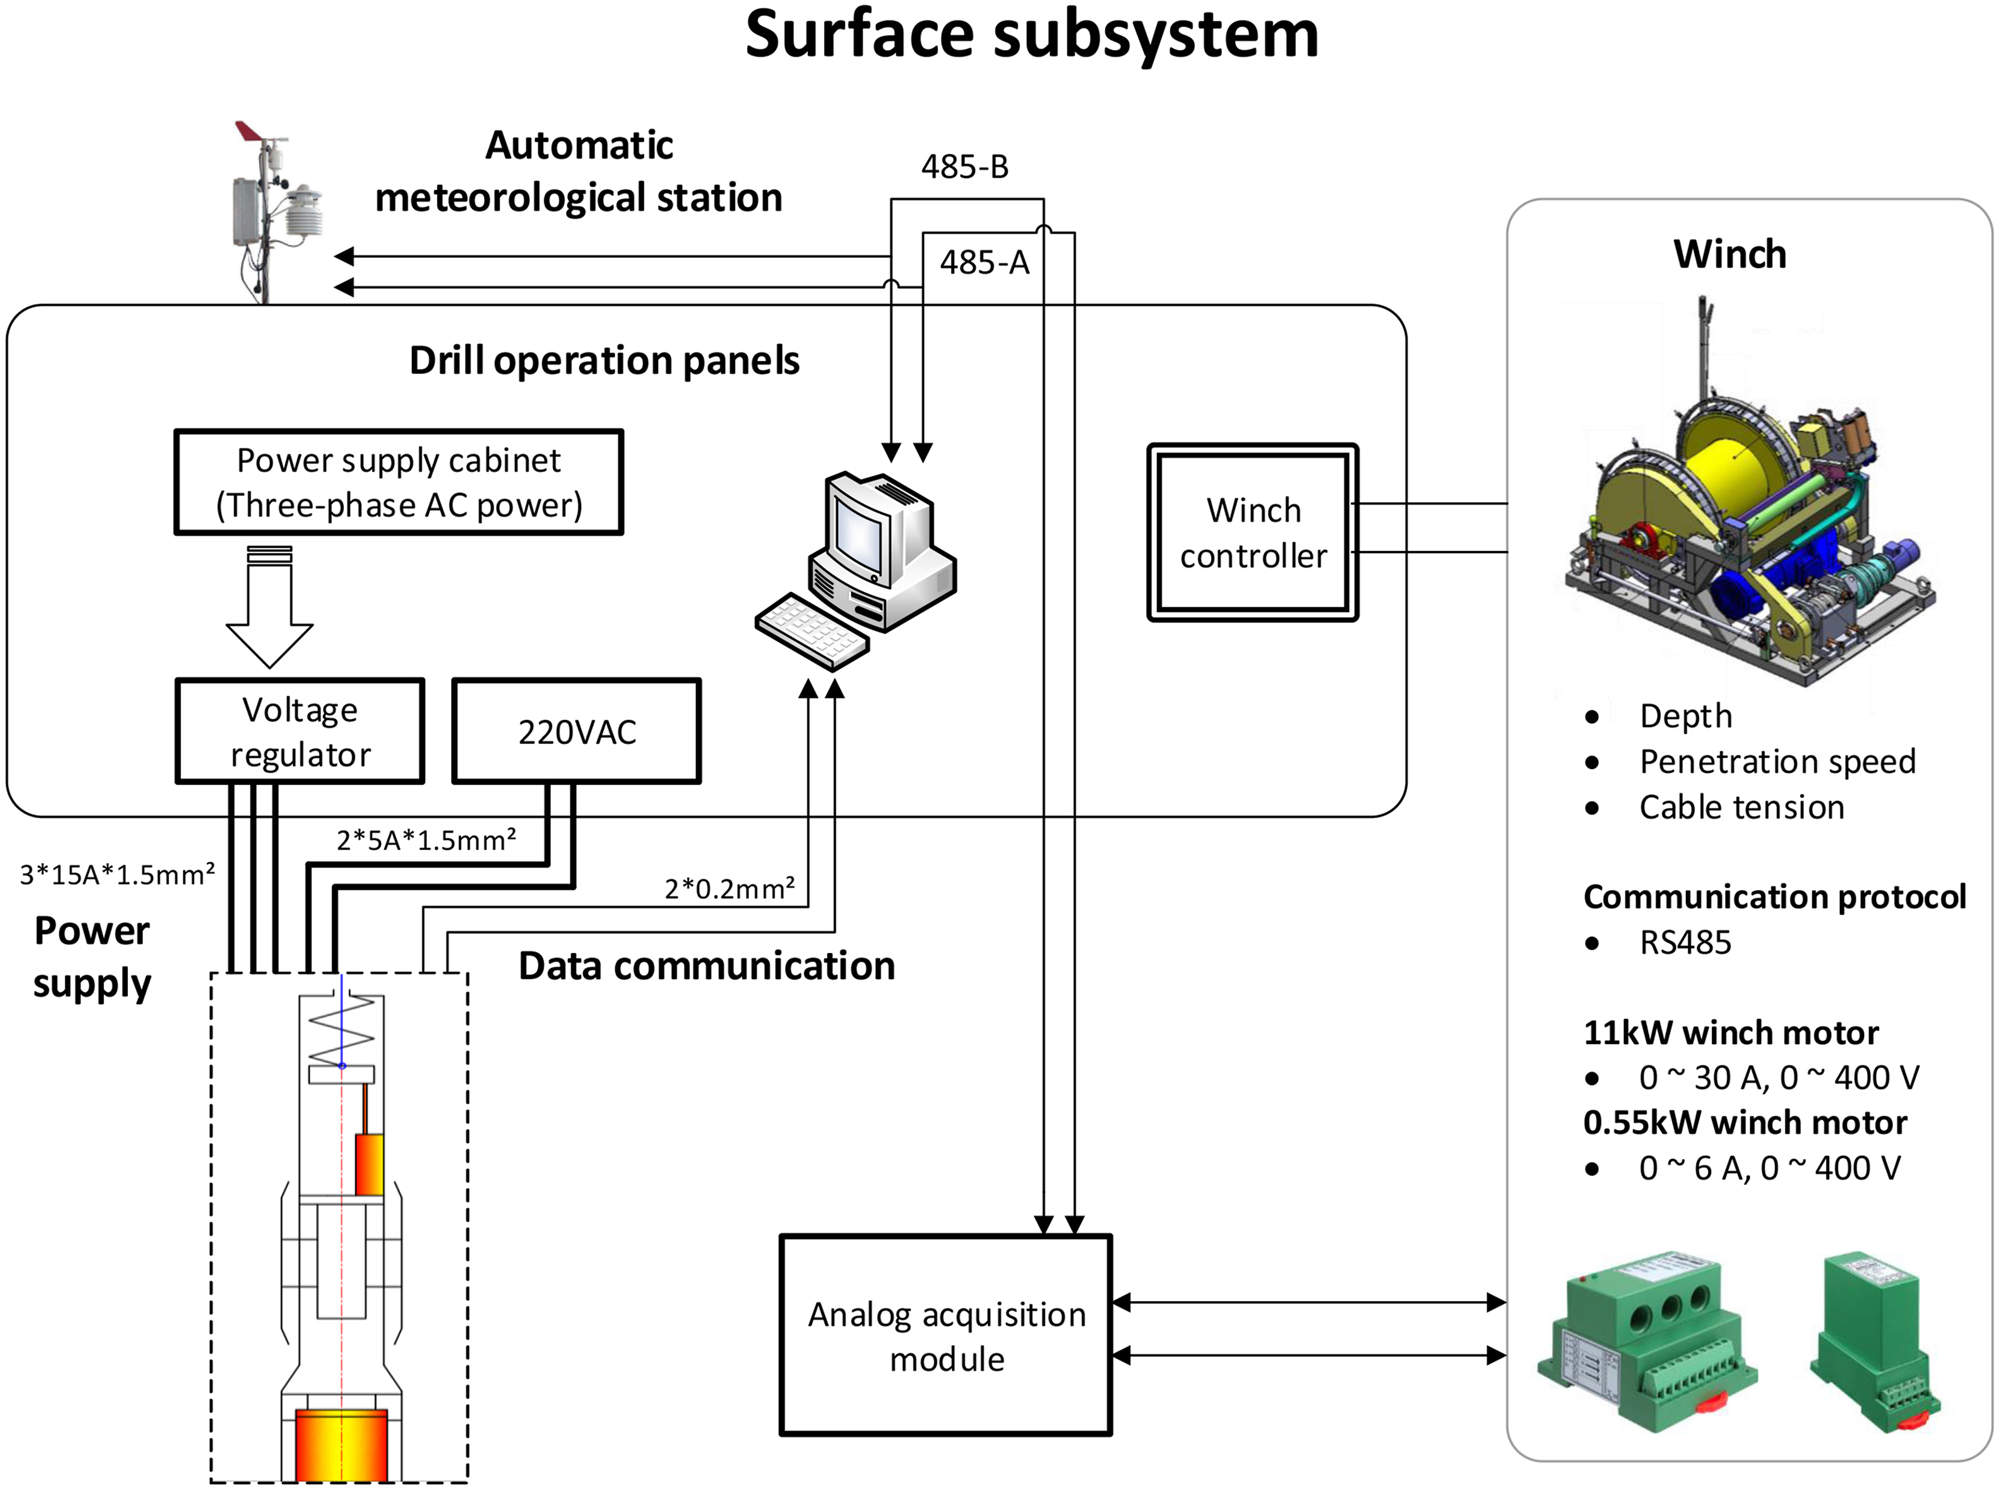
Fig. 2. Schematic representation of the surface subsystem.
3.2. Environmental parameter measurement
During fieldwork in Antarctica, environmental conditions are important factors for the implementation of the project. The frequently severe weather conditions in the polar region can influence drilling production. Temperature, air pressure, wind direction and speed need to be considered and monitored during drill site selection and field operation. The environmental parameters are detected by a WH2310 commercial-type automatic meteorological station, which connects to the host computer via an RS485 serial port. The data are displayed and stored in a PC.
3.3. Winch parameter measurement
During the drilling and hoisting processes, the drill is suspended on a cable. The current borehole depth and rate of penetration or tripping speed can be determined by detecting the accumulative angular displacement and angular velocity of the guide pulley on the cable traverse unit of the winch. Then, an encoder connected with the pulley via a coupler outputs the pulse signal along with the cable linear motion. Additionally, a pressure sensor is set under the pulley shaft to test the cable tension by converting the pressure on the shaft from the cable, so that the drill weight and force while breaking the core can be detected. There are two motors on the winch, which are used for lifting and lowering the drill (high power and speed) and core drilling (low power and speed). A clutch is used to switch the function between the two motors. The electrical parameters of the two motors are detected by two sets of power meters, which connect the PC through a serial port via an RS485 bus, and are displayed on the interface.
3.4. Networking of surface devices
The surface subsystem exhibits the features of a variety of devices and sensors, and their dispersive location. A network with a uniform communication form, which is built up by using an RS485 bus, is a requisite for data gathering and transmitting. According to the practical situation, data gathering nodes are set at certain device or neighbor locations during application. The mark numbers of the net nodes are distributed in the software for distinguishing the different devices and types of sensors. During system design and device selection, the 4–20 mA output type of sensor and RS485 communication serial port were unified, and a communication protocol based on MODBUS-RTU was selected. The output signal of 4–20 mA was collected and transmitted by an ADAM Module-4117, which is a type of industrial analog signal acquisition module. The module is composed of eight differential input channels and one 485 communication port. The two main data output facilities of the surface subsystem are the automatic meteorological station and the winch (Fig. 3). The network mode is opened, and other facilities are allowed to access it according to further requirements.
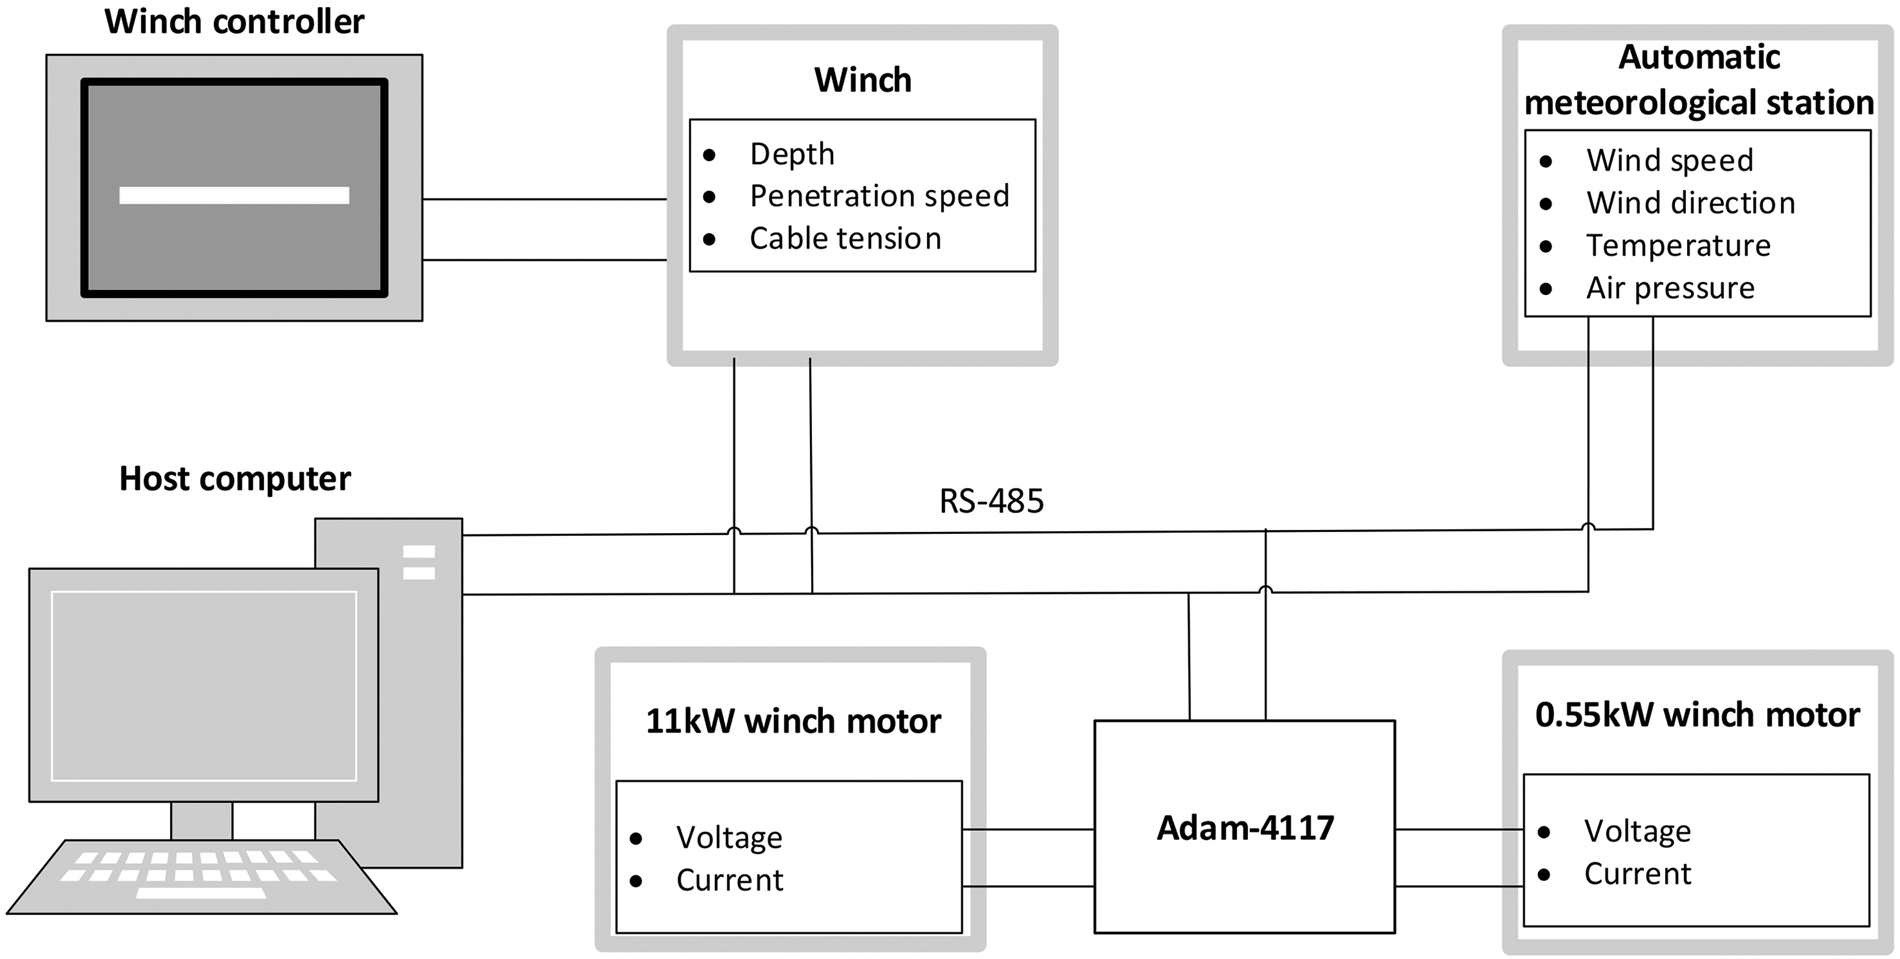
Fig. 3. Surface subsystem networking.
3.5. Voltage regulation control of AC voltage supply
The high AC voltage regulator is used for the drill motor AC power supply. The rated power of the motor is 3 kW, and the steady operating electrical current is ~6 A. Considering the high starting current and voltage loss on a 1500 m-long cable, a voltage regulator of 750 VAC and 15 kVA was selected. The motor can be started normally under a voltage of 380–400 VAC by this means, and the voltage can be regulated in steps by using the control panel, to adapt the changing drill load during the cutting process. The selected voltage regulator has the advantages of self-protection of overcurrent, overvoltage and overload, and a rapid response.
4. Borehole subsystem
4.1. Schematic design
The borehole subsystem, which is set in the drill, includes the power processing unit, MCU main processing unit, drill data and borehole data detection unit, analog signal conversion unit and data communication unit. In the borehole subsystem, the three-phase AC electric power is sent to the motor, and the individual single-phase AC power is transformed to 24 VDC by a rectifier filter and DC–DC power conversion module for the power of circuits and sensors. The drill and borehole data are sent to the MCU main processing unit via an analog acquisition circuit after detection by various sensors. The data are sent to the surface subsystem through an armored cable via a 485 communication bus. The location of the borehole subsystem elements is shown in Figure 4. The borehole subsystem is divided into the power, CPU, sensor and communication circuits. Figure 5 shows a schematic representation of the circuits of the borehole subsystem.
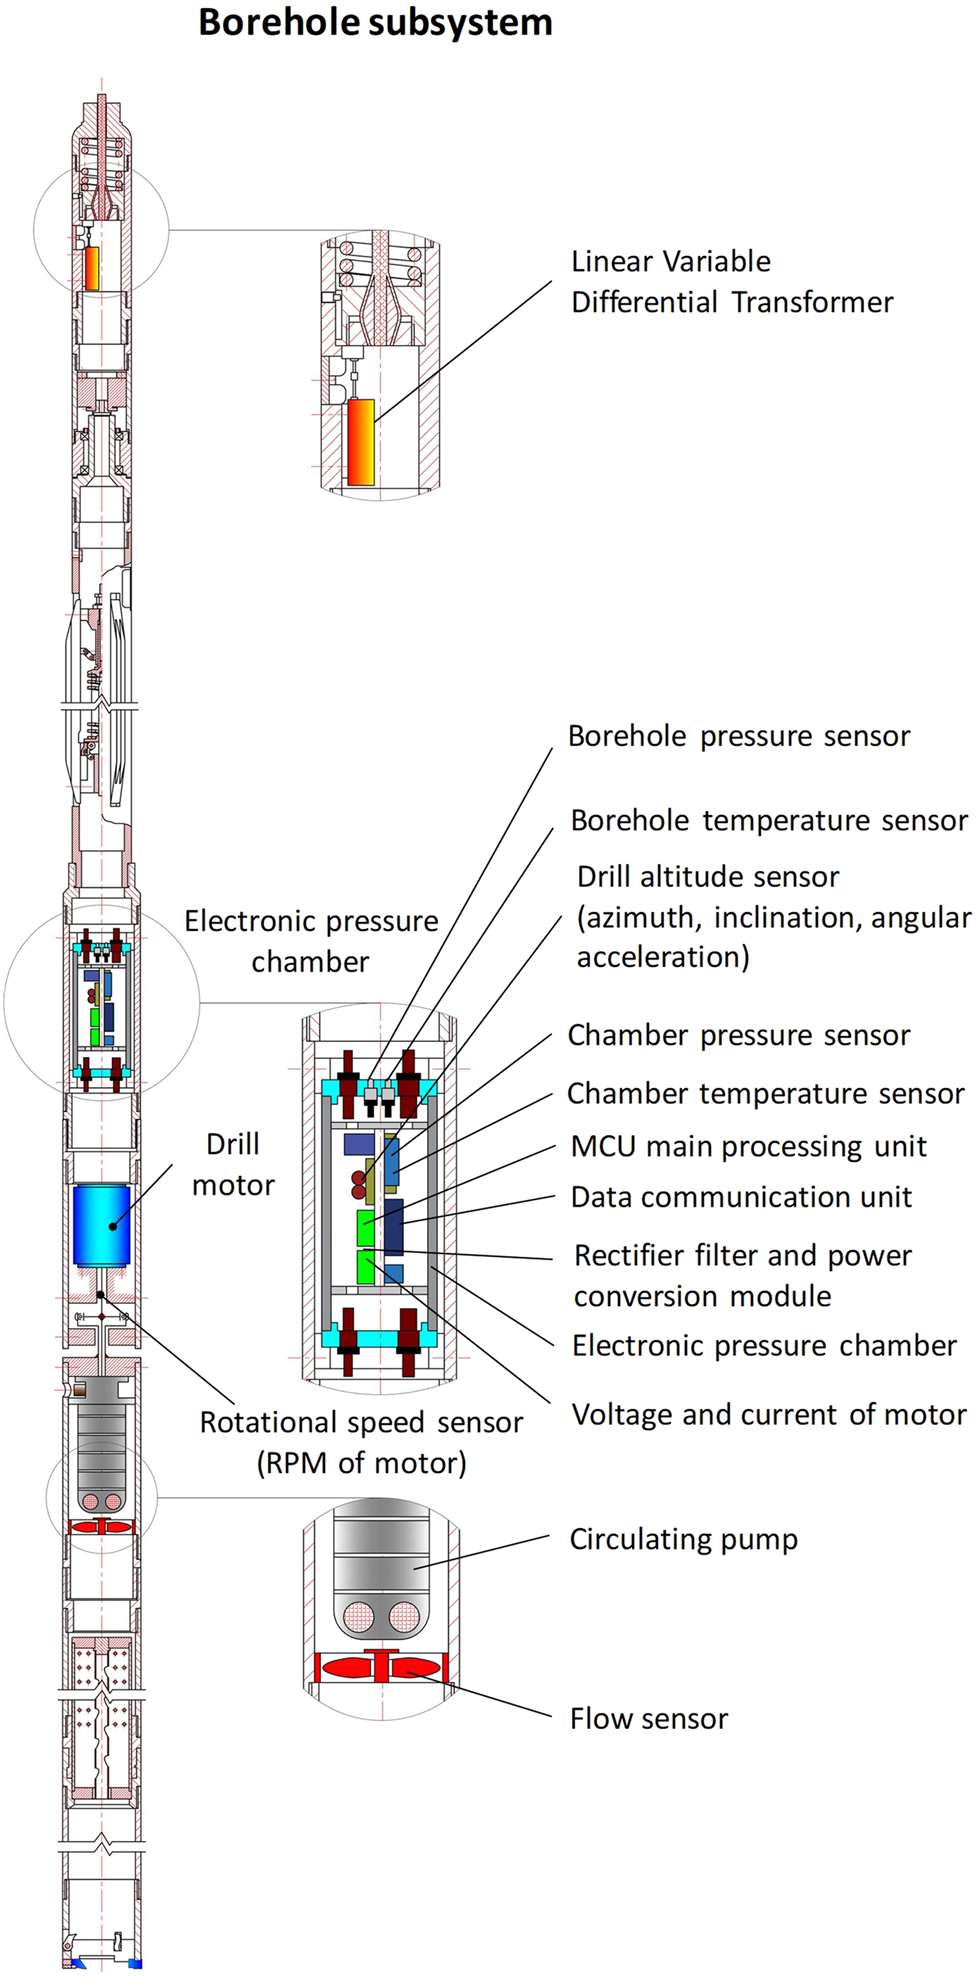
Fig. 4. Location of elements of the borehole subsystem.
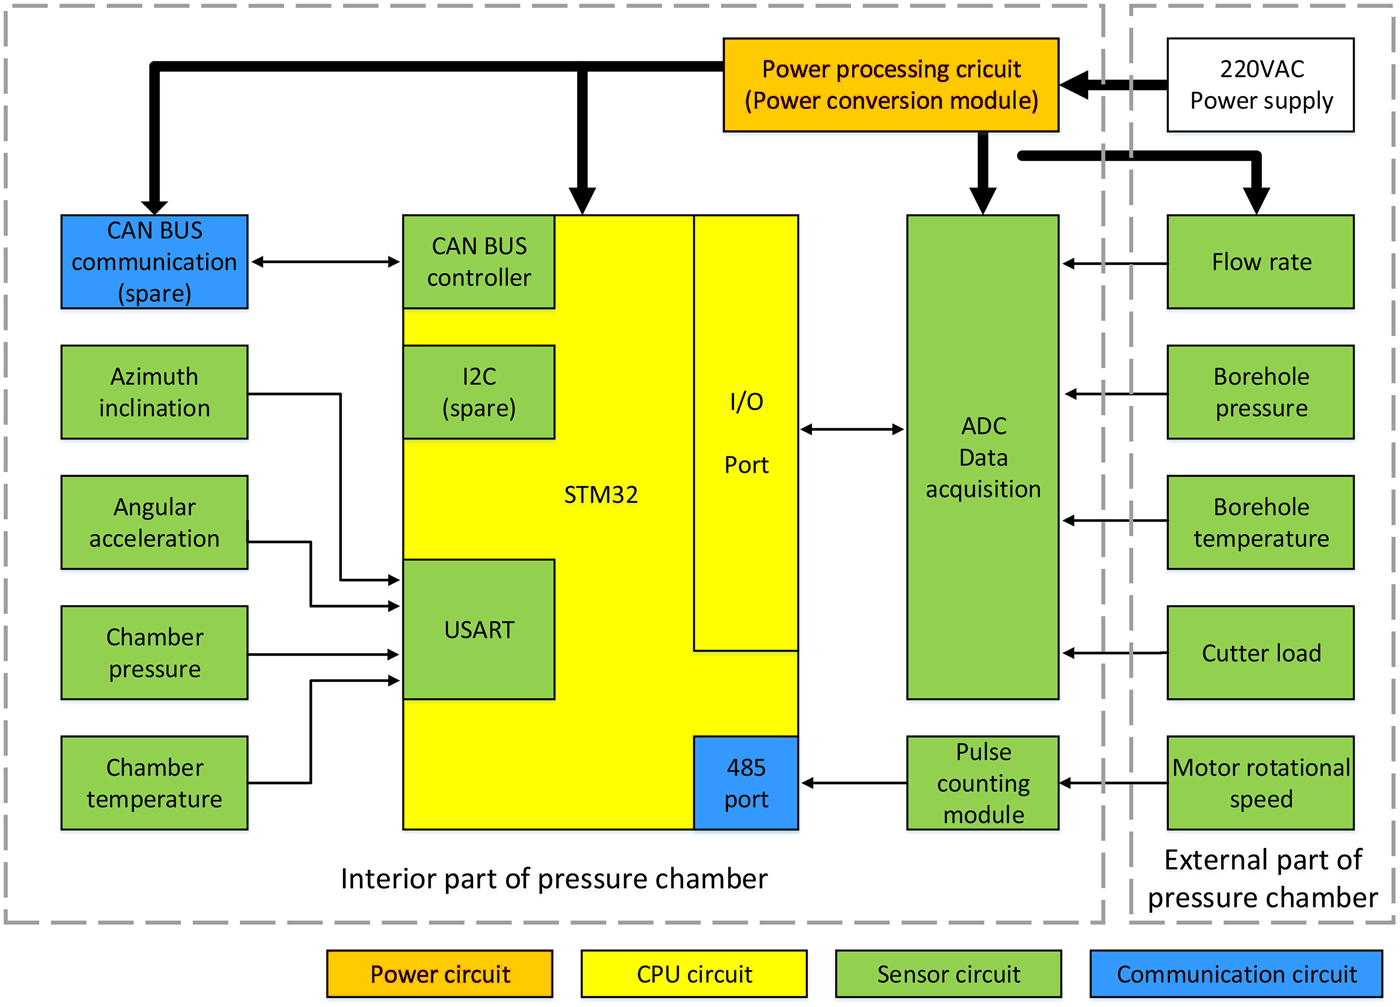
Fig. 5. Schematic representation of the borehole subsystem circuits.
4.2. Elements outside the electronic pressure chamber
4.2.1. Cutter load measurement
A high-strength pressure spring connected with the cable is set in the termination of the drill (Fig. 6). The pressure spring is compressed while the drill is suspended in a vertical position; if the drill bit touches the bottom, the cutter load is raised and the spring is released. The length of the spring corresponds to the value of the cutter load. A linear variable differential transformer (LVDT) with performance parameters of 8–30 VDC power supply, 0–50 mm measuring range and 4–20 mA output is used for detecting the spring elongation. The signal from the LVDT was calibrated with the weight of the drill using an electronic balance.
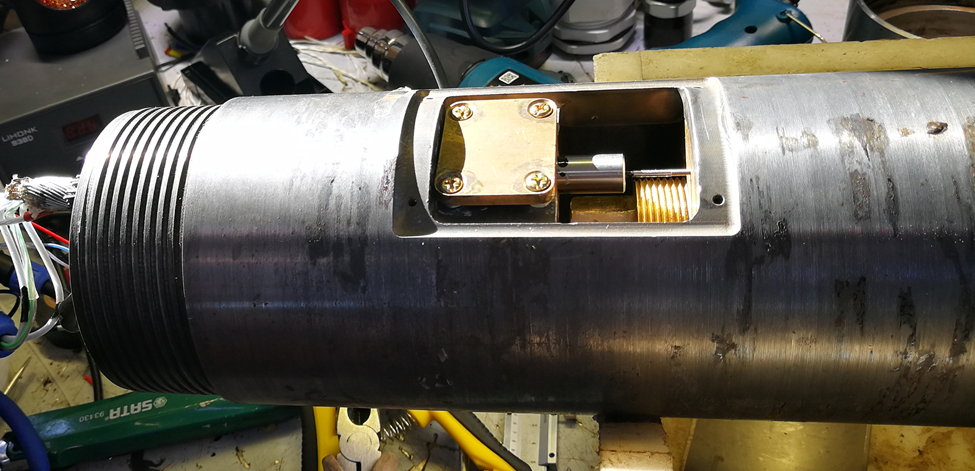
Fig. 6. LVDT installation (cutter load sensor).
4.2.2. Borehole pressure and temperature measurement
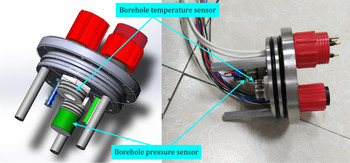
Hydrostatic pressure and temperature sensors are installed at the top cap of the electronic pressure chamber (Fig. 7). A PT1000 temperature sensor of CWDZ11-Z-05 type was selected for borehole temperature measurements. It can measure the temperature from −50 to 100°C with a precision of 0.5% of the full scale. A mini pressure sensor of PCW14-200 bar-IM8 type was selected for borehole hydrostatic pressure detection. It can measure the pressure from 0 to 20 MPa with a precision of 0.5% of the full scale in an operating temperature range of −50 to 80°C. These sensors have a supply voltage and output signal of 24 VDC and 4–20 mA, respectively, which are the same as those of the LVDT.
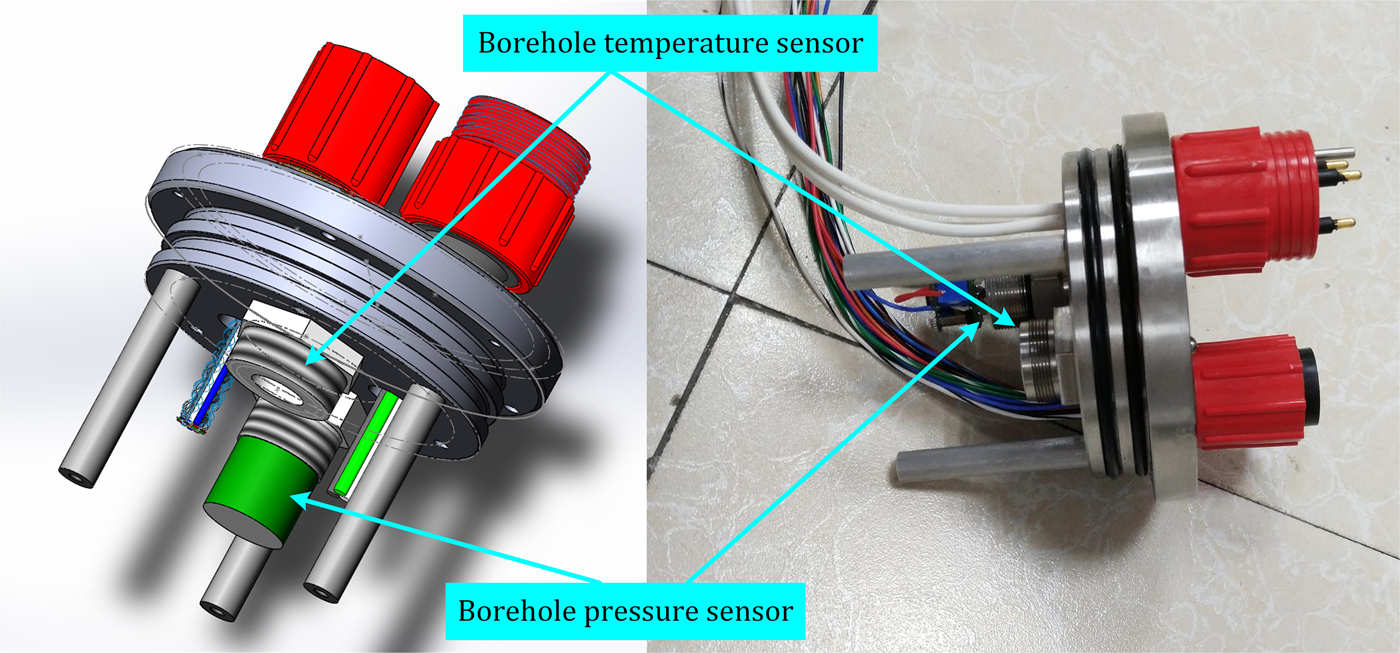
Fig. 7. Installation of borehole pressure and temperature sensors.
4.2.3. Motor rotational speed measurement
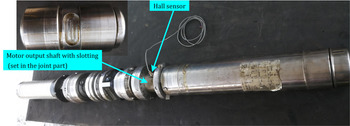
The drill motor drives the rotating drill bit to cut the ice during the core drilling process. The rotational speed of the drill bit is proportional to that of the motor, according to the reduction ratio of the reducer gear in the drive unit. A Hall effect sensor with measuring frequency range of 1–45 kHz, power supply of 5–24 VDC and sensitive distance ⩽4 mm was installed on the motor support close to the output shaft, which has a slot. When the slot rotates with the output shaft, the Hall effect sensor can obtain a pulse signal from the alternating high and low voltage because of the different gap switching between the sensor and slot on the shaft. The pulse signal is transformed to a differential signal for transmission and is collected by the pulse counting module. Then, the rotational speed can be determined by counting the quantity of pulses in a certain time interval. Finally, the signal is sent to the CPU for processing via the 485 port. A test of the motor rotational speed measurement is shown in Figure 8.
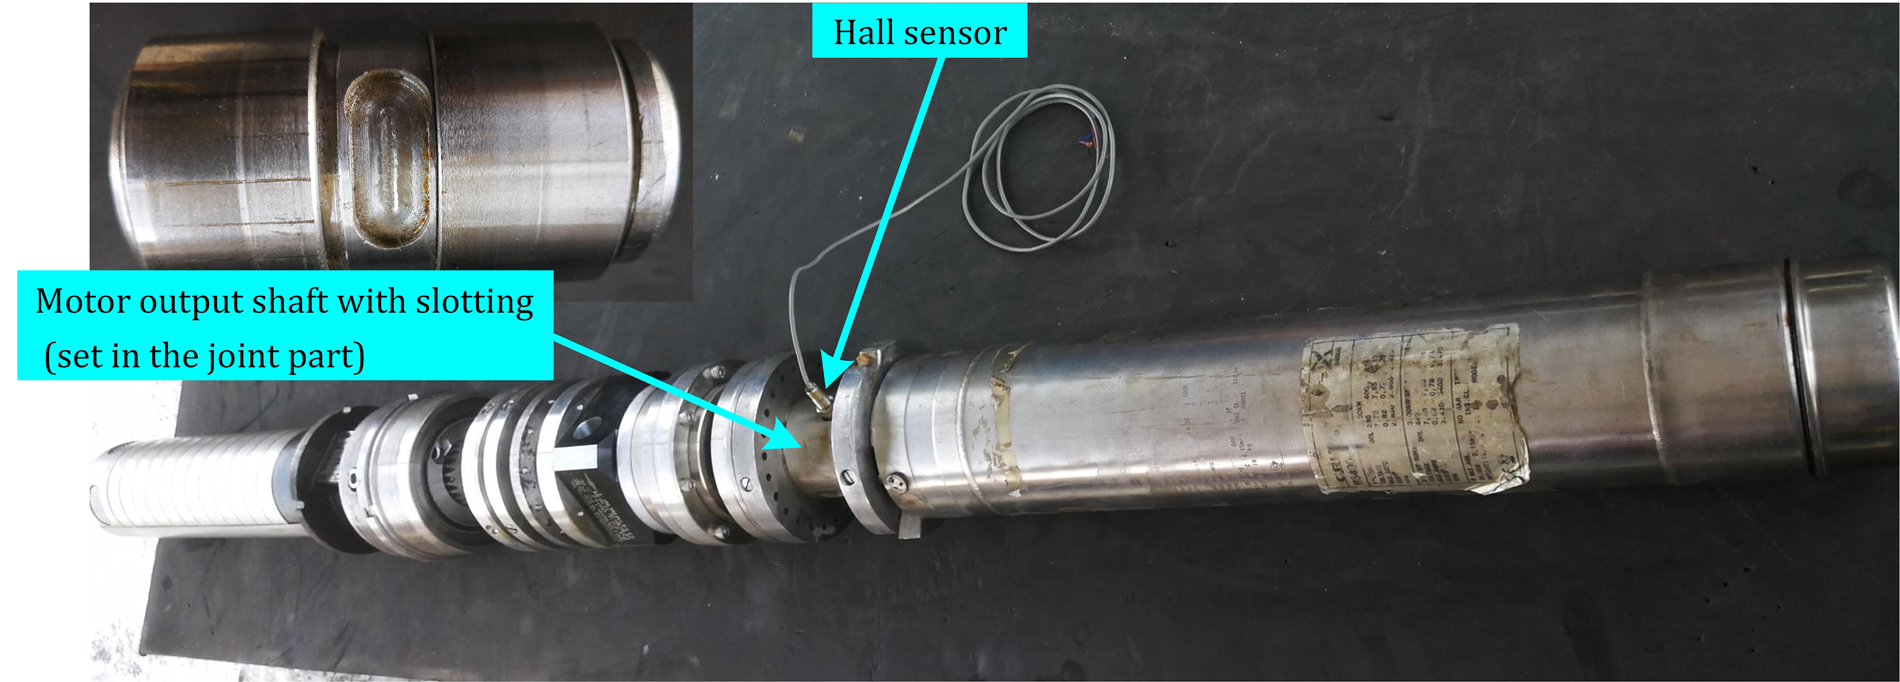
Fig. 8. Test of motor rotational speed measurement.
4.2.4. Flow rate measurement
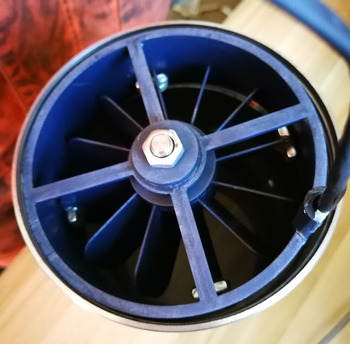
The flow rate is also a crucial parameter during the drill process. The IBED is a downhole assembly that can be used with ASDR. It uses a bottom reverse circulation system with a downhole pump and a chip chamber for filtering the fluid and collecting the cuttings. The flow rate indicates a circulation status, which can be applied to detect a pump fault or drilling sticking. Such abnormal conditions can cause serious drilling accidents. Not all types of standard flow sensors can be used in the IBED because of the peculiar size of this drill. Therefore, a customized flow sensor with 12 vanes and a stainless-steel shaft has been designed. Four pieces of ferromagnetic steel were set uniformly distributed on the edges of the 12 vanes, and a Hall effect sensor was set on the external support frame (Fig. 9). The pulse signal is detected by the Hall effect sensor along with the rotation of the vanes driven by the circulation of the liquid in the center channel. The flow data are sent to the main circuit board in the electronic pressure chamber via the 485 port. The sensor was calibrated through pumping of a known fluid volume during a certain time interval.

Fig. 9. Customized flow sensor.
4.3. Elements inside the electronic pressure chamber
The electronic pressure chamber has inner/outer diameters of 101/115 mm and a total length of 600 mm (without the seal joint). It was made of 304 stainless steel and can withstand pressure up to 20 MPa. The 3D model and hardware of the electronic pressure chamber are shown in Figure 10.
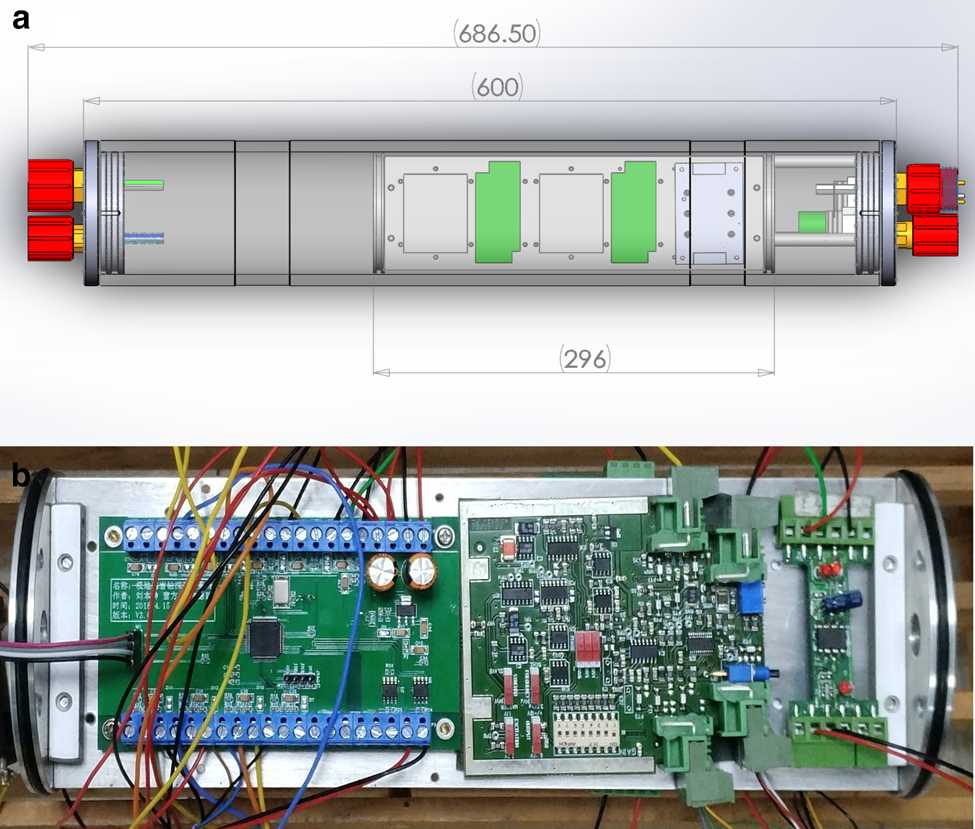
Fig. 10. 3D model (a) and hardware (b) of the electronic pressure chamber.
4.3.1. Electric circuit power supply
The power of the electric circuit in the pressure chamber is supplied by 220 VAC from the surface subsystem through the 1500 m-long armored cable, and the AC power is transformed to 300 VDC after rectification and filtering (Fig. 11). A DC–DC switching power module manufactured by VICOR was selected, which reduces 300 VDC to 24 VDC for the different voltage levels required by the circuit boards and sensors. Considering the potential breakdown of the system caused by an unexpected accident, the different types of voltage (220 VAC, 300 VDC, 24 VDC) are isolated from each other. The operating voltage of the main circuit board is 24 VDC. For unification of the component power supply, the voltage of the power supply for the temperature, cutter load, rotational speed and flow rate sensors was selected as 24 VDC, whereas the voltage of the power for the main control processor, 485 chip and drill tilting (azimuth and inclination) sensor was selected as 3.3 V, which is reduced from 24 VDC.
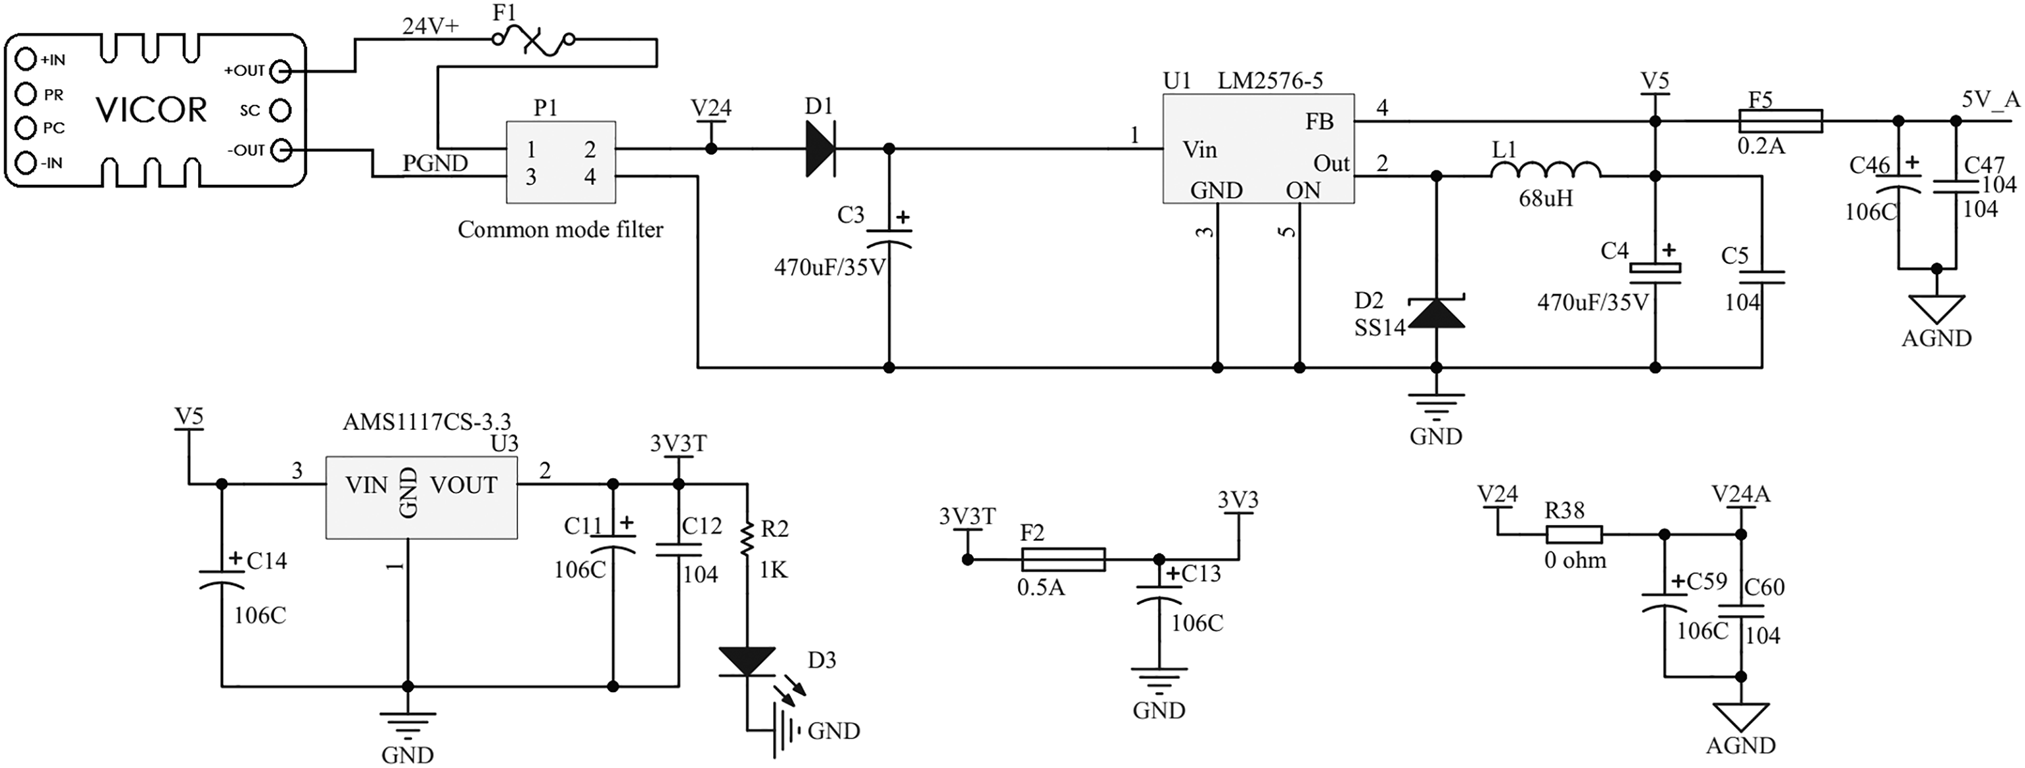
Fig. 11. Schematic representation of power supply electric circuit in borehole subsystem.
The DC–DC switching power module, which has wide voltage input (180–375 VDC) and steady output power (150 W), can export 24 VDC with high electromagnetic compatibility and stability by isolating the input and output through its own isolation transformer and filtering through a common-mode filter of ZJYS51R5 type manufactured by TDK.
The voltage of 24 VDC is reduced to 5 V by a switching regulator (LM2576) after noise suppression, and two diodes (D1 and D2) are added in the circuit for avoiding circuit damage due to potential voltage overload or incorrect connection of the power supply polarity. To prevent high transient voltages appearing at the input terminal, a tantalum capacitor (C3) of large capacitance and low equivalent series resistance (ESR) was added as a shunt capacitor (470–10 000 μF). Its rated withstand voltage can reach 150% of the maximum input voltage. To improve the loop stability, a Schottky diode, a kind of free-wheeling diode (ss14) with rapid switching speed and short reverse recovery time, was selected. Another tantalum capacitor (C4) of low ESR and 1–470 μF capacitance was added in the follow-up circuit. The capacitance should be selected appropriately. First, if the capacitance is too high, the electronic components will be damaged in case of an open circuit at the output end or abnormal disconnecting at the input end. Second, if the ESR of the capacitor is excessively low, the stability of the loop will be reduced.
Considering both conditions, tantalum capacitors of 470 μF/35 V were selected, and two fuses (F2, F5) were added before the low output voltages of 5 and 3.3 V. The rated operational voltage of the main control processor and communication chip is 3.3 VDC. A regulator chip (AMS1117-3.3) was used for voltage conversion from 5 to 3.3 V. In addition, a luminous diode was added as an indicator for the power supply working condition during a debugging process, for the safety of the circuitry.
4.3.2. Main control MCU circuit
A minimum system with an STM32-series single-chip core constituted the core circuit of the main control board. An STM32F103RCT7 industrial grade chip with an operating temperature range of −40 to +80°C was selected. The core circuit comprised the MCU, clock circuit, reset circuit, single-chip program download and debugging circuit, reference voltage circuit and start mode circuit modules (Fig. 12).
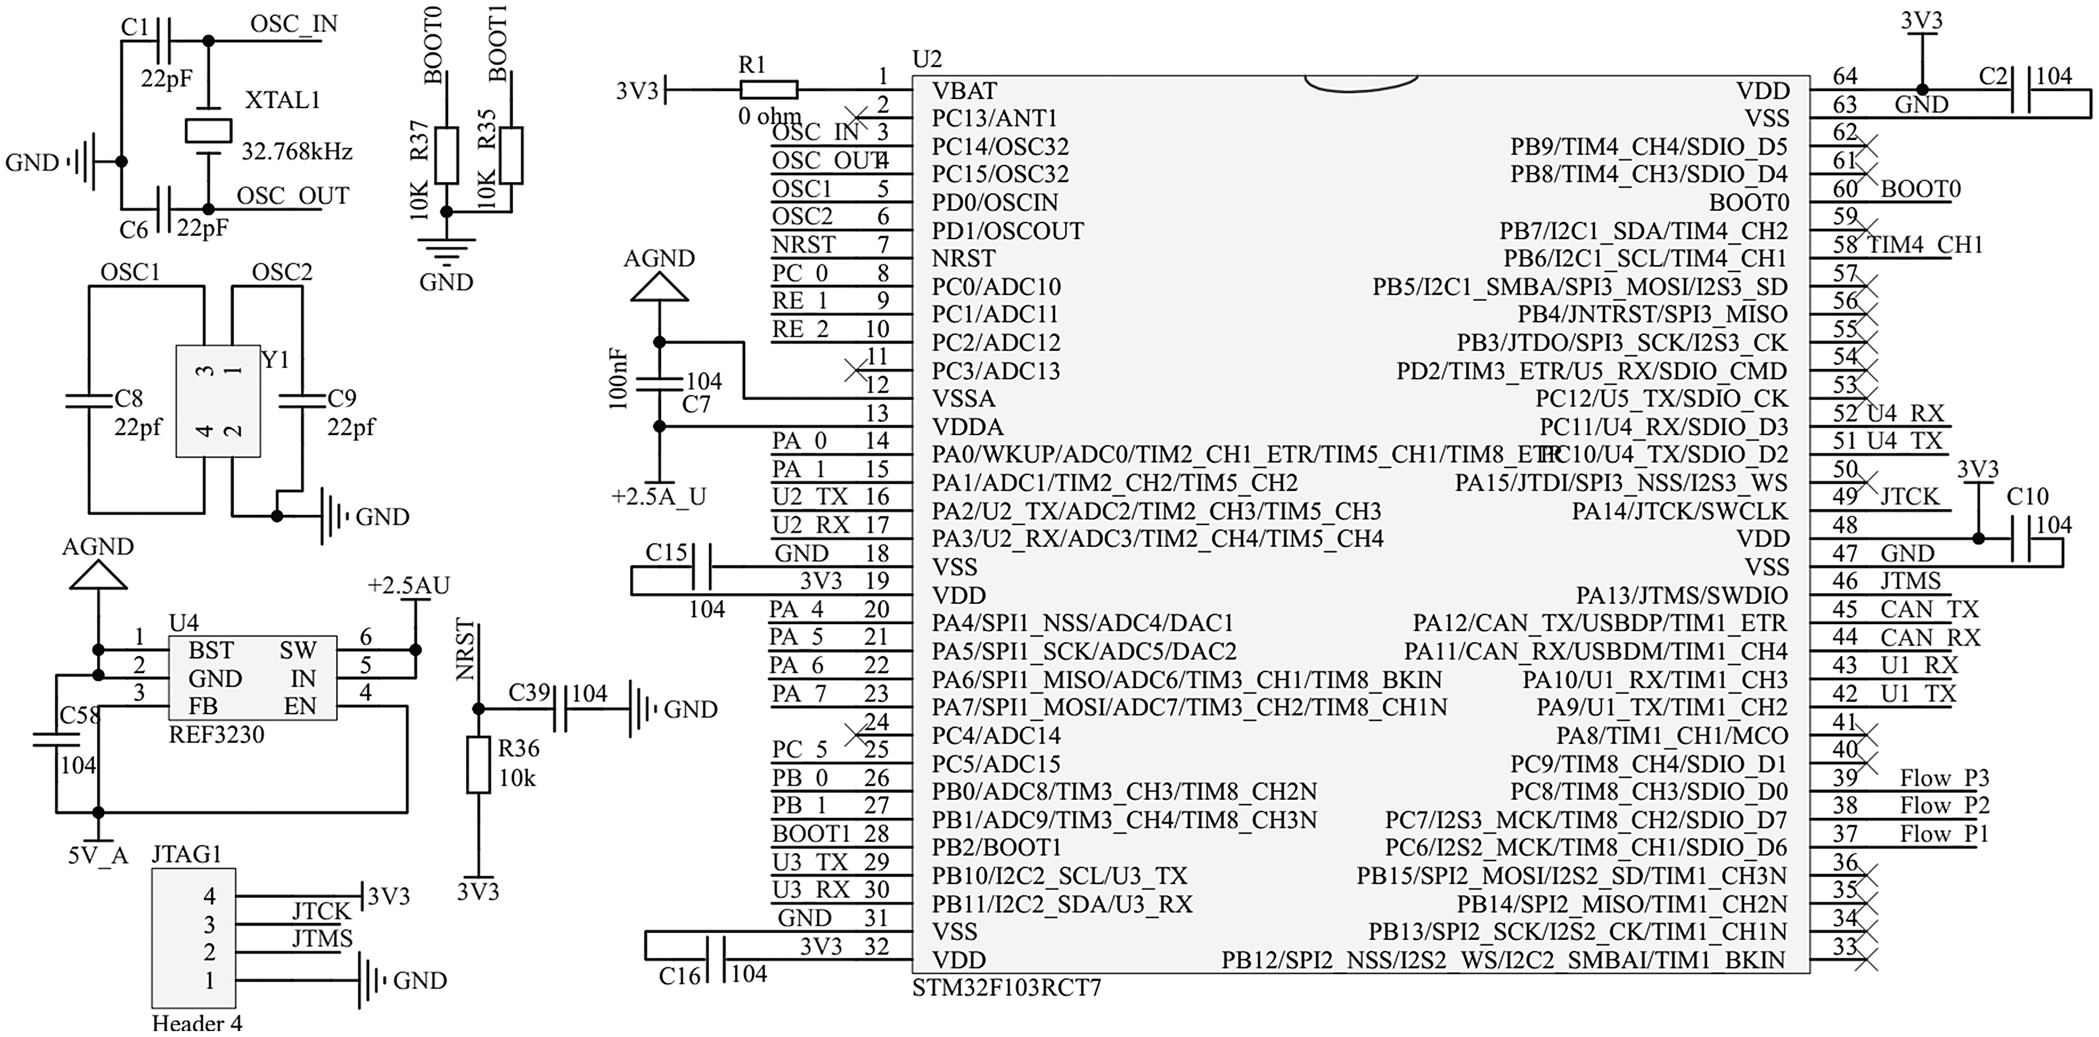
Fig. 12. Schematic representation of core circuit boards of the borehole subsystem.
In the MCU core circuit, four 104 ceramic capacitors were set at four power and ground ports (VDD and VSS) for noise reduction and filtering at the MCU power supply terminals. In the clock circuit, an external crystal oscillator with a frequency of 8 MHz was used, which was set between OSC-IN and OSC-OUT by means of a parallel connection, and two 22 pF capacitors were matched in the circuit. The frequency is multiplied from 8 to 72 MHz, which is the system operating frequency by the MCU through the phase-locked loop. The frequency is divided by a frequency divider for low-speed peripherals. A high-precision reference voltage chip of REF3230 type was selected for providing the reference voltage of the main circuit.
4.3.3. Electronic pressure chamber temperature and pressure measurement
The electronic pressure chamber serves as a protective cabin for all the electric circuits and CPU of the borehole subsystem, which operates in the complex environment of the borehole, with low temperature and high hydrostatic pressure. If the pressure chamber leaks, the electric circuit boards will be left in conditions of high pressure, low temperature and short circuit, which are harmful to the system. Two sensors are set on the main electric circuit board to track leaking of the pressure chamber.
4.3.4. Drill attitude measurement
Measurement of the drill attitude (azimuth and inclination) is necessary to control the borehole trajectory and prevent drilling accidents. Thus, the drilling parameters can be adjusted in a timely manner to ensure hole verticality. In addition, the drill attitude sensor collects data of availability of the antitorque device by detecting the drill angular acceleration. When the azimuth angle data reveal repeated alternation between the changing and suspending status, the failure of the antitorque function can be determined. In that case, the drilling process should be interrupted.
Small-size M3C attitude integration module was selected (Fig. 13). The module with 3–5 VDC power supply integrates a high precision gyro accelerometer (MPU6050), a geomagnetic sensor (HMC5883L) and a temperature–pressure sensor as a reserve (BMP180). The module provides multiple USART and I2C ports, and can export the three-axis real-time attitude of the drill with an angle precision of 0.01° and data frame update frequency of 400 Hz, by means of attitude analytical and Kalman filtering algorithms. Owing to the sensor integration, the interior structure of the chamber could be simplified as much as possible. The main control chip can not only analyze data of angle, temperature and pressure via the USART port, but can also access the initial data via the I2C port.
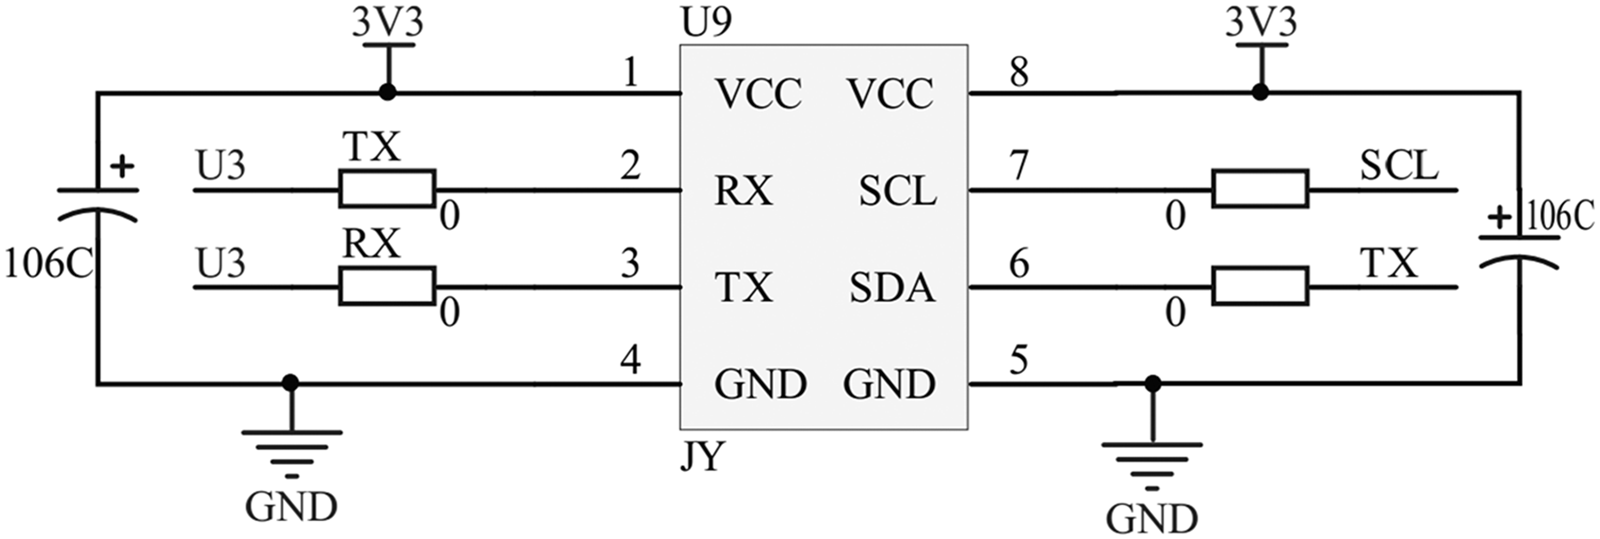
Fig. 13. Schematic circuit of the tilting integration module.
4.3.5. Analog current signal measuring circuit
In the electrical and electronic control system, most of the output signals of the sensors and transducers are unified with DC current in the range of 4–20 mA. In this case, the inner space of the pressure chamber can be saved, debugging time of the signal circuit can be reduced, and signal attenuation and interference can be avoided during long-distance signal transmission.
The single chip applied in the system receives the voltage signal; therefore, an I/V (current/voltage) switching circuit is used to convert the current signal of 4–20 mA to a voltage signal of 0–3 V. The filter and protection circuits were designed to increase the reliability of the circuit and prevent chip damage from overcurrent. A/D acquisitions units in the MCU collect all analog signals. A schematic representation of the analog current signal measuring circuit is shown in Figure 14. At the 4–20 mA input end, the current signal is converted to the corresponding voltage signal through resistors with low-temperature drift and high precision and is filtered through the phase-shift circuit (RC filter circuit). Then, under the protection of the TVS diode (transient suppression), the converted voltage signal is sent to the AD acquisition channel in the MCU.
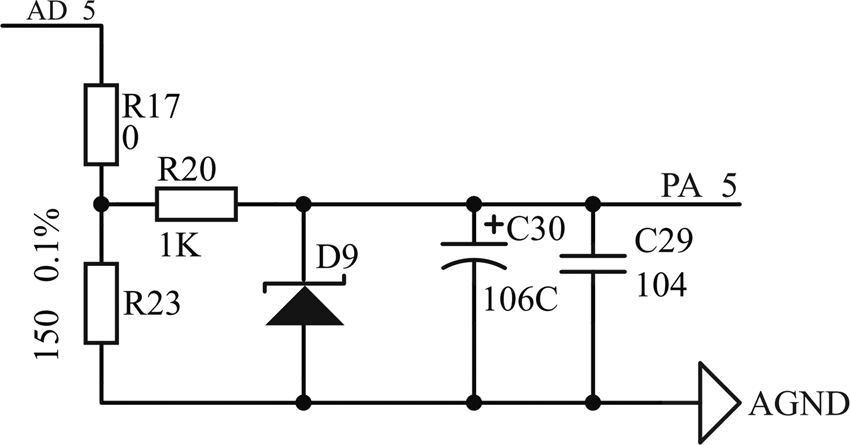
Fig. 14. Schematic representation of analog current signal measuring circuit.
4.3.6. Pulse signal conversion circuit
Some of the sensor output signals, for example, those from the motor rotational speed and flow rate sensors, form a continuous voltage pulse. To ensure the reliability of the signal and electromagnetic interference suppression during long-distance transmission, the pulse signal (single-ended) is transformed into a differential signal. Then, it is transformed back to a single-ended signal in the pressure chamber for signal acquisition by using a pulse counter. Finally, the data are sent to the MCU through the 485 bus. Figure 15 shows a schematic representation of the pulse signal conversion.

Fig. 15. Schematic representation of pulse signal conversion.
4.3.7. Communication module circuit
The communication module serves as a bridge connecting the borehole control subsystem with the surface software subsystem. An RS485 communication port with a communication chip (SP3485EN type) as transceiver was used together with the 485 controller in the MCU, to realize the communication between the master and slave controllers (Fig. 16).
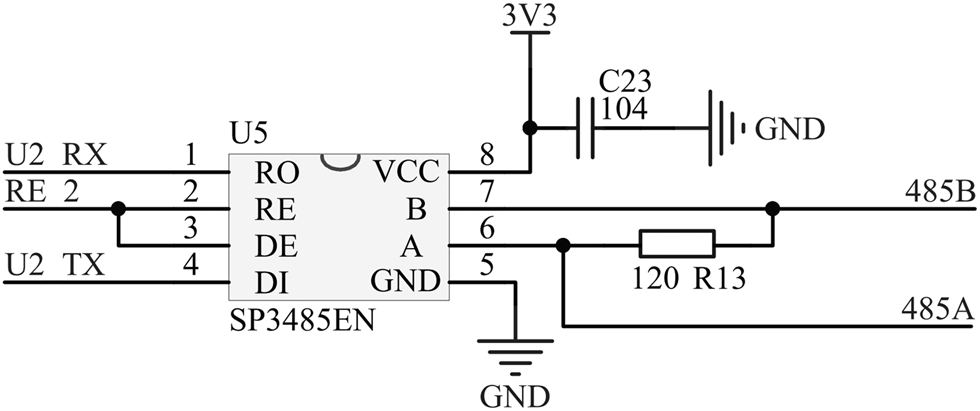
Fig. 16. Schematic representation of the communication module circuit.
To provide a pure power supply for the 485 communication chip, a shunt capacitor was added at the VCC to improve the working stability. The output pin of the MCU (U2_TX) is connected with the signal output end (pin 4) of the 485 chip, and the reception pin of the MCU (U2_RX) is connected with the data input end (pin 1) (see Figs 11 and 15). The control terminal (RE_2) is connected with the joint of pin 2 and pin 3 of the 485 chip. Half-duplex of the RS485 is applied, which has two operating modes.
Receiving mode: In normal conditions, the control terminal (RE_2) is set at a low electric level; therefore, the 485 communication chip is in receiving mode. Connecting pin 1 to U2_RX of the STM32, the data can be received.
Sending mode: When the control terminal (RE_2) is set at a high electric level, the 485 communication chip will be in sending mode, and the data are sent via pin 4 and U2_TX of the STM32.
A matched resistor of 120–1000 Ω was added between the two communication pins (485A and 485B) for absorbing the signal reflection and to improve the reliability and anti-interference performance of the long-distance communication.
5. Software subsystem
The software control system includes two main parts. One part is the surface measuring and control software, which was developed using Visual Studio and C# programming language. The display terminal provides the operator with the opportunity to monitor the whole drilling process and read the variation in parameters timely. The other part is the borehole measuring and control embedded software, which is based on the STM32 single chip. Keil Vision and C programming language are used for parameter measuring, data processing, and signal transmission.
5.1. Surface measuring and control software
5.1.1. Surface software architecture framework
Functionally, the surface measuring and control software is divided into three layers: user interface, business logic and data access (Fig. 17).
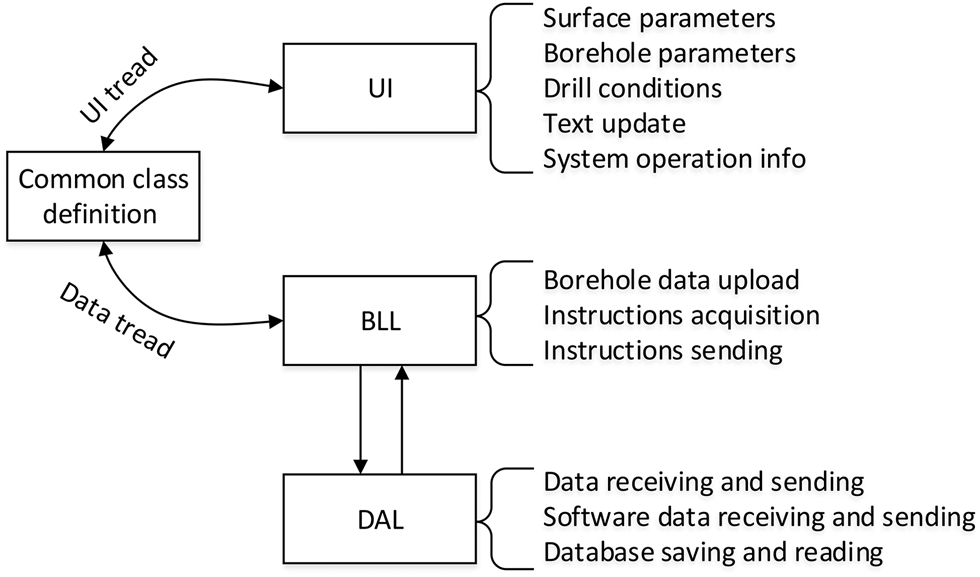
Fig. 17. Schematic representation of the surface software architecture.
User interface layer (UI): The UI is located at the top of the software architecture and receives the feedback from the business logic layer. The overall layout design of the human–computer interaction interface is the primary mission of the UI layer. The functions of surface and borehole data analysis, data display and control instruction issue are realized in this layer.
Business logic layer (BLL): The BLL is located in the middle of the software architecture, between the UI and data access layers. It sends data acquisition instructions to the surface facilities, encapsulates the execution instructions of the UI into data frames and delivers data.
Data access layer (DAL): The DAL consolidates the program data into a storage medium and realizes data interaction. By calling the DAL, the functions of data insertion and storage can be achieved. The data of the serial port communications can be sent and received in the DAL. All the facility parameters are stored in the database after analysis, so that the historical data can be checked at any time.
5.1.2. Human–computer interaction interface
Human–computer interaction is one of the most important elements during a drilling operation (Fig. 18). The driller monitors the whole drilling process and borehole working conditions by observing the display terminal in real time and controls the drill and winch accordingly. Real-time data are refreshed according to the sampling time and are stored for the follow-up data process.
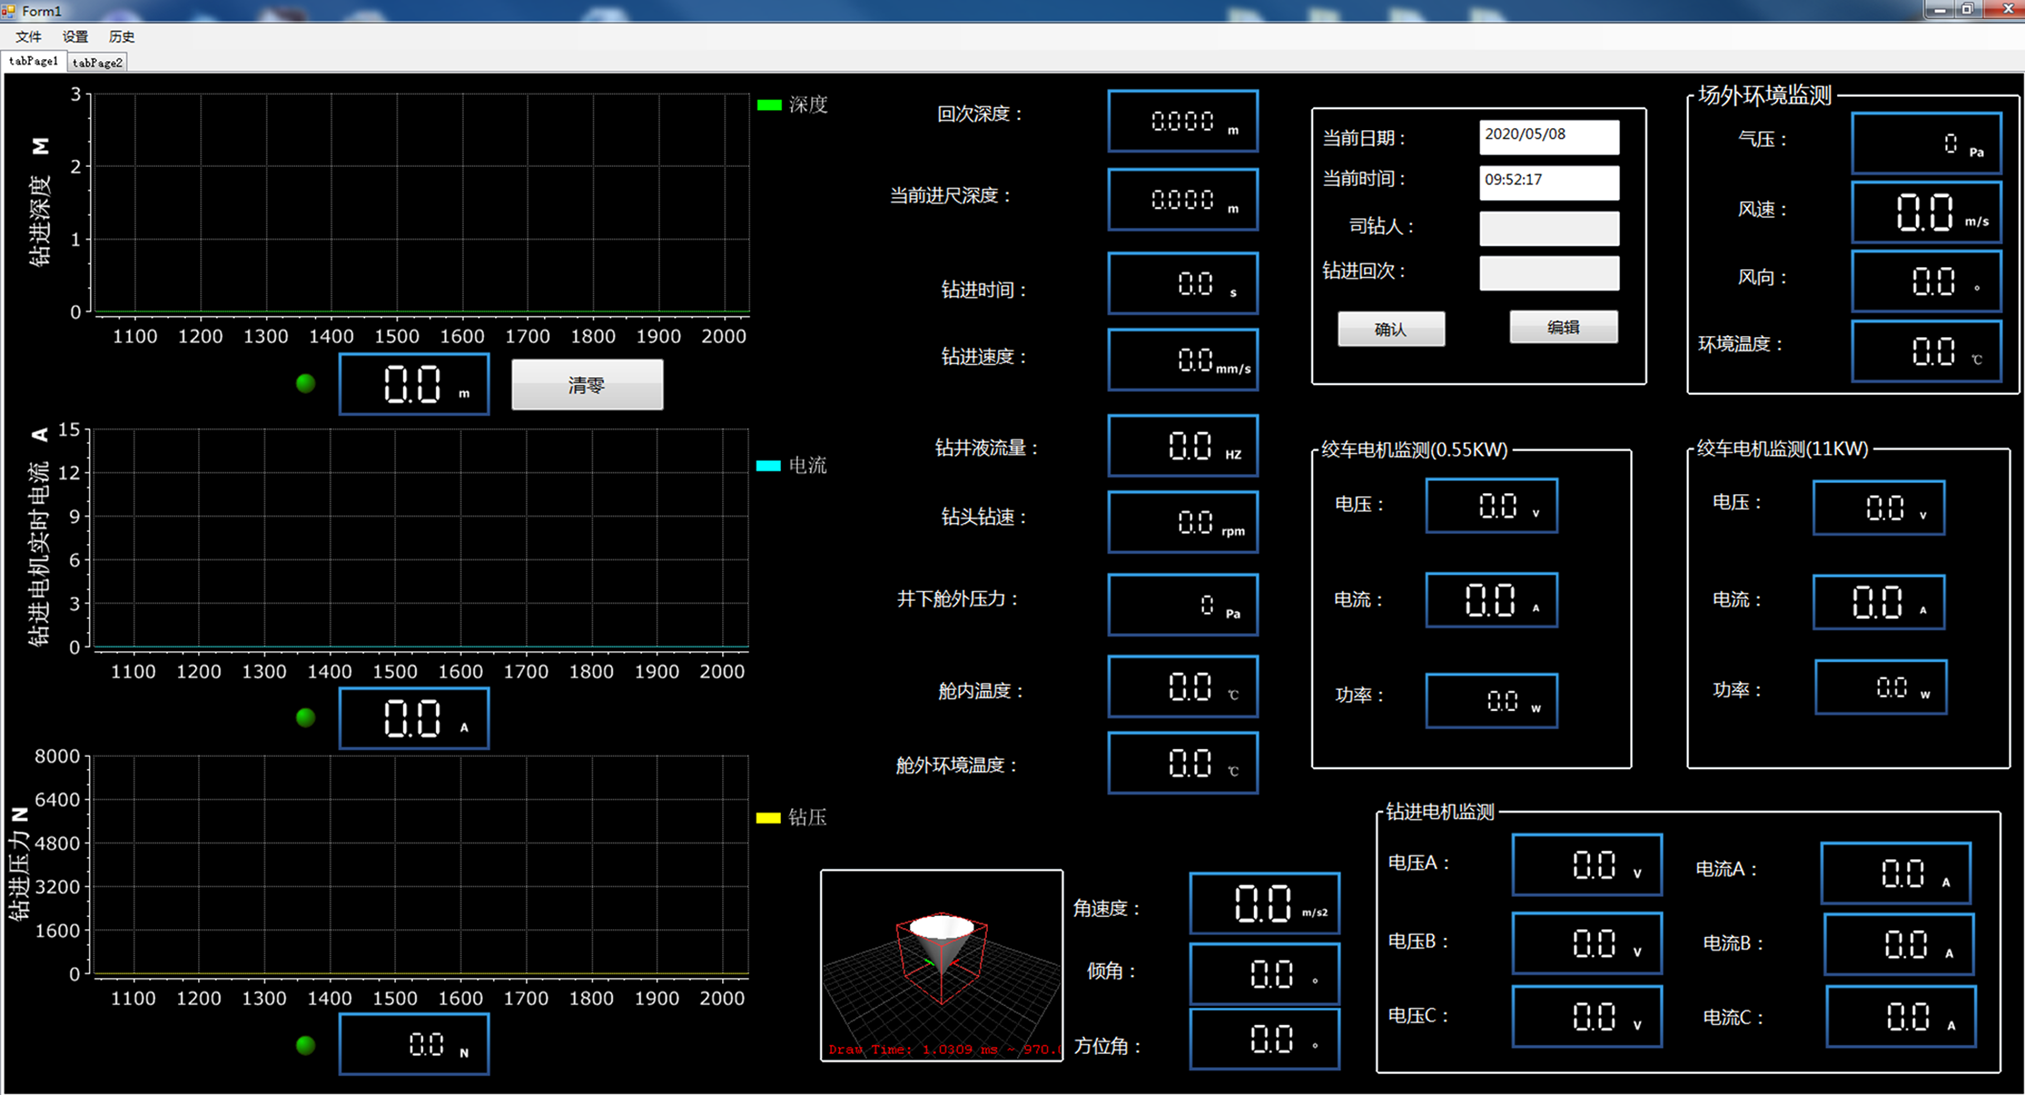
Fig. 18. Main human–computer interaction interface of ASDR.
The interface shows all the surface and borehole parameters, including penetration depth, penetration rate, cutter load, cable tension, motor rotational speed, flow rate, chamber temperature and pressure, borehole temperature and pressure, drill azimuth and inclination, angular acceleration, winch motor current and voltage, drill motor current and voltage, surface wind speed and direction, and environmental temperature. The interface is divided into two main display areas: digital parameters and dynamic curves of the main drilling parameters.
In the digital display area, all the parameters are displayed as time-varying numbers. Additionally, a fictitious model of a gyro is displayed on the interface to simulate the drill attitude, which can visually present the dynamic process of change in azimuth and inclination, or when an antitorque failure occurs. In the dynamic curve display area, the main parameters (cutter load, drill motor current and penetration depth) are exhibited in dynamic curves so that the changing process and trends of parameter variation can be observed. In addition, the basic drilling information (date, current time, run number and driller name) is marked in the info area for turn reports.
5.2. Borehole embedded measuring and control software
The borehole subsystem acquires the borehole and drilling parameters through the embedded software, which is programmed in the main MCU circuit board (Fig. 19). All the borehole and drilling data are acquired uniformly and encapsulated into customized data frames, and they are uploaded to the surface software by the communication unit for data analysis, display and processing.
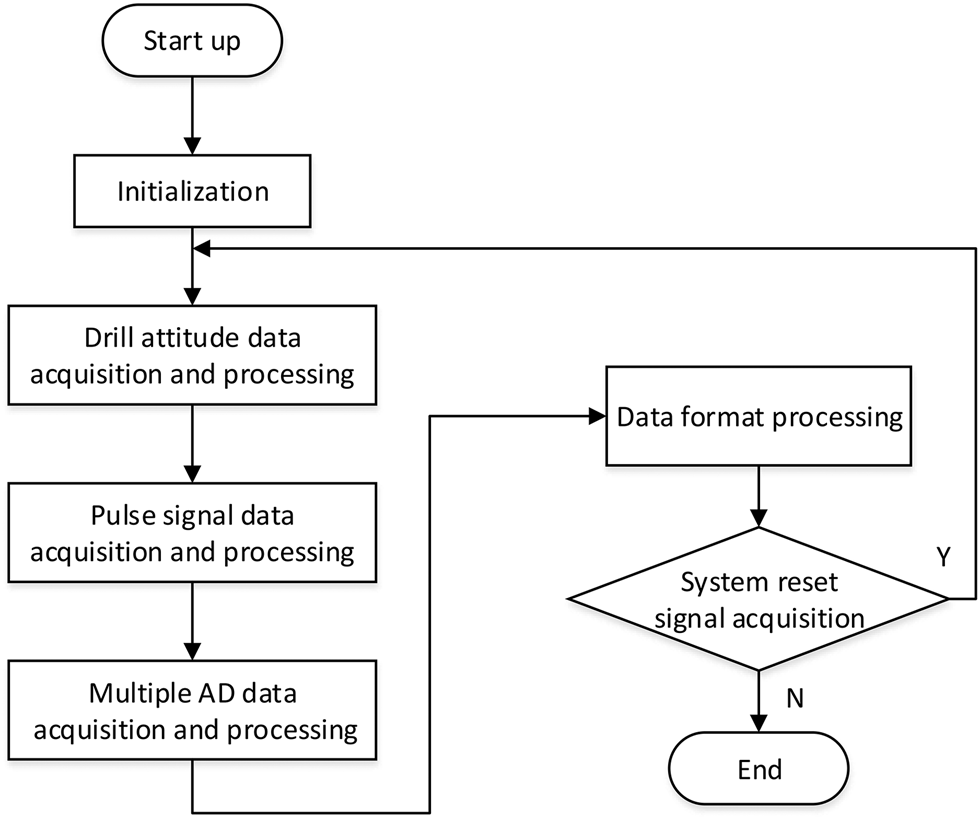
Fig. 19. Flow diagram of the borehole subsystem embedded software.
After the system is powered on, the software program is started. First, the system is initialized, which includes initialization of the interrupt function, serial ports, ADC and DMA, and 485. Second, the CPU collects drill attitude data and motor rotational speed data through two serial ports. Then, AD signals such as temperature, pressure, cutter load and current and voltage signals are collected circularly using the DMA function. DMA is a rapid data transmission mode, which can receive and send data without the intervention of the CPU. In this condition, the data can be transferred promptly so that CPU resources can be saved. Finally, the encapsulated data are sent to the surface through the data format processing unit.
6. Field application in Antarctica
During the 35th Chinese National Antarctic Research Expedition (2018–2019, summer season), the electrical and electronic control system of the ASDR was transported to Antarctica with the whole system. The sensors were calibrated and debugged before the field drilling tests. The output signals of all sensors had the standard current signal (4–20 mA) or pulse signal. We found out the response of each sensor to an input using calibration curves. All the used sensors had near-linear responses. Then, the calculations were made in the programmed software. The calibration methods for some sensors are described below.
6.1. LVDT displacement sensor calibration
As noted previously, the LVDT measures the cutter load by measuring the variation in the length of a spring set at the end of the cable. The variation in the length of the spring indicates the tensile force at the end of the cable, which can be used for calculation and calibration of the cutter load. An output signal of the LVDT varies in the 4–20 mA range. During calibration in the field, the assembly units of the drill tool were assembled sequentially, and the assembled part in each step was weighed on a balance. Therefore, the different weights of the assembled parts were acquired, and multiple cutter loads were obtained through LVDT measuring and software calculation while the drill was hung on the cable.
6.2. Drill attitude module calibration
As the attitude sensing module of the drill is an integrated product, the data of azimuth and inclination were calibrated in the field simultaneously by using a high precision gradienter. The electronic pressure chamber, which contains the module, was fixed on the clamp holder of the gradienter, and the chamber was operated to point to different directions with various inclination angles together with the meter. Comparing the output signals and readings, the calibration curves were obtained.
6.3. Flow rate sensor calibration
The flow rate is measured by counting the pulse value with the Hall effect sensor. During calibration, a drum was filled with a certain amount of drill liquid, and the pump section of the drill with the flow rate sensor was set into the liquid. The outlet of the pump was fed to another drum with a regulating valve for flow adjustment. By counting the durations of liquid emptying through the pump under multiple flows controlled by the valve, the real flow rates were calculated. By comparison with the pulse, the calibration relation between the real flow and the measured parameter was obtained.
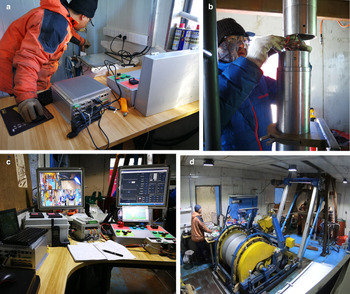
After installation and joint debugging at the site, ~12 km south from Zhongshan Station, East Antarctica, a 198 m-deep hole was drilled and continuous ice core samples were obtained in 19 d (from 23 January to 10 February 2019) (Fig. 20). The ice sheet was successfully penetrated, and finally, a 6 cm-long bedrock core was recovered.

Fig. 20. Field testing in Antarctica: (a) connection and debugging of surface subsystem; (b) connection of electronic pressure chamber; (c) control table; (d) drilling operation.
During the whole core drilling process, the control system was in service, from the beginning to the end of the drilling project. It exhibited a steady and efficient performance without significant system failures, and all the data were stored in the database of the control system.
Acknowledgements
This research was supported by the National Science Foundation of China (Project No. 41327804) and the Program for Jilin University Science and Technology Innovative Research Team (Project No. 2017TD-24). We thank the teachers and students from the Jilin University Polar Research Center and Hangzhou Dianzi University who were involved in this project, especially those who assisted the research on the control system. We greatly appreciate fruitful suggestions, useful comments and editing from Scientific Editor K. Slawny (US Ice Drilling Program) and anonymous reviewers.


 Open access