


Introduction
Dementia with Lewy bodies (DLB) is the second leading cause of degenerative dementia after Alzheimer's disease (AD), accounting for up to 15% of cases at autopsy (McKeith et al., Reference McKeith2005). Despite the important differences between AD and DLB in their archetypal presentations, they share some clinical, neuropsychological, and pathological features, such the presence of amyloid and neurofibrillary tangles. This can make differentiation between these disorders challenging in clinical practice. Even after the development of consensus diagnostic criteria, the sensitivity for differential diagnosis of DLB in clinical practice remains low, with many DLB subjects misdiagnosed (McKeith et al., Reference McKeith2005).
In the search for reliable imaging markers to distinguish DLB from AD, most of the neuroimaging studies comparing DLB and AD have focused on macroscopic whole brain and medial temporal lobe (MTL) changes. Relative MTL preservation in DLB compared to AD is one of the most widely reported structural MRI distinctions between both conditions (Mak et al., Reference Mak, Su, Williams and O'Brien2014). Our group has also reported longitudinal data over 12 months that DLB is characterized by a milder rate of temporal thinning compared to AD (Mak et al., Reference Mak2015b). However, these volumetric changes are relatively late events in the trajectory of neurodegenerative processes (Jack et al., Reference Jack2013), and are predated by many years of pathological protein accumulation.
The temporal gap between pathological onset and evident volumetric changes represents a time-window when it may be possible to detect even more subtle changes in the hippocampus. In recent years, there has been considerable progress in the application of diffusion imaging to investigate aberrations at microstructural scale (Le Bihan, Reference Le Bihan2003). In neurodegeneration, the disintegration of microstructural barriers (i.e. cell membranes, intracellular organelles, and myelin) results in a quantifiable difference in the diffusion of water along white matter tracts that could be indexed by various diffusion tensor imaging (DTI) metrics. Fractional anisotropy (FA) reflects the directional coherence (tendency for water diffusion to occur in a single direction) of water diffusion along axons, and lower FA is commonly interpreted as disrupted microstructural integrity. Mean diffusivity (MD) is a measure of the average rate of diffusion in all directions and generally increases with axonal degeneration and demyelination. Such DTI alterations are not visible on conventional structural MRI sequences, and previous evidence suggests that they could precede gray matter atrophy (Kantarci et al., Reference Kantarci2005). Furthermore, alhough diffusion imaging is traditionally associated with white matter tracts, there is recent interest in its utility for the detection of microscopic abnormalities within gray matter structures. In particular, elevated MD within the hippocampus has been reported by several groups in AD and to a lesser extent in MCI (Kantarci et al., Reference Kantarci2005; Müller et al., Reference Müller2005; Fellgiebel and Yakushev, Reference Fellgiebel and Yakushev2011). These studies have triggered an unresolved debate regarding the relative merits of microstructural (DTI) and volumetric measurements (T1-MRI) in terms of characterizing subtle aberrations and predicting disease progression. Although earlier studies have reported that hippocampal MD was a better predictor of conversion from MCI to AD compared to hippocampal volume (Kantarci et al., Reference Kantarci2005), others have reported conflicting findings (Brueggen et al., Reference Brueggen2015). A meta-analysis also concluded that the effect sizes for volumetric MTL measurements are at least similar, if not larger, than respective DTI indices (Clerx et al., Reference Clerx, Visser, Verhey and Aalten2012).
We proposed that a simultaneous investigation of the volumetric and microstructural properties of the hippocampus could better differentiate DLB from AD and MCI. There is limited evidence of FA and MD changes within the hippocampus in DLB, although one study revealed increased MD of MTL regions in AD compared to DLB (Kantarci et al., Reference Kantarci2010). Furthermore, while previous work from our group has directly compared the gray matter characteristics in DLB relative to AD (Mak et al., Reference Mak2015b), the differential patterns of vulnerability across the hippocampal subfields compared to mild cognitive impairment (MCI) is not clear, even though increasing evidence suggests that DLB could be preceded by an MCI phase (Donaghy et al., Reference Donaghy, O'Brien and Thomas2014). This could further complicate differential diagnosis in the early stages of DLB. Lastly, it remains unclear how, and to what extent, the patterns of microstructural changes are related to macrostructural atrophy in the hippocampus.
Combining DTI and T1-MRI imaging, we conducted a thorough investigation of the hippocampus in patients with DLB in comparison to healthy controls and patients with MCI and AD. This study is an extension of literature on three fronts: (a) we applied a novel hippocampal segmentation pipeline (Iglesias et al., Reference Iglesias2015) to delineate hippocampal subfields, (b) we evaluated covarying patterns of microstructural deficits and volumetric atrophy in the hippocampus; (c) this study yielded novel insights concerning the inter-modality associations of microstructural changes and volumetric atrophy within the hippocampus and its sub-regions.
We first hypothesized that MCI and AD would show total hippocampal and subfield atrophy relative to healthy controls and DLB. Specifically, we expected to find a more severe atrophy of the CA1 in MCI and AD since it has been established to be a preferential site of tau aggregation and early neuronal loss (Braak and Braak, Reference Braak and Braak1991). Second, these patterns of volumetric atrophy would be accompanied by microstructural changes in MCI and AD. We hypothesized that DLB will be characterized by microstructural changes in the absence of pronounced hippocampal atrophy. Lastly, we also expected that MD, as a surrogate marker of neuronal loss, would be associated with concomitant volumetric atrophy within the hippocampus.
Methods
Participant recruitment and clinical assessment
As part of the Neuroimaging of Inflammation in Memory and Related Other Disorders (NIMROD) study (Bevan-Jones et al., in press), 23 MCI, 17 DLB, and 14 AD subjects were recruited from cognitive disorder clinics in neurology, old age psychiatry and related services at Cambridge University Hospital (CUH) and other Trusts within the region including Cambridgeshire, Lincolnshire, Bedfordshire, Norfolk, Suffolk, Hertfordshire, and Essex. Case registers held by the Dementias and Neurodegeneration specialty of the UK Clinical Research Network (DeNDRoN) and the Join Dementia Research (JDR) platform were also used. MCI was defined as Mini Mental State Examination (MMSE) greater than 24 but with memory impairment beyond that expected for age and education which does not meet criteria for probable AD and is not explained by another diagnosis (Albert et al., Reference Albert2011). DLB was diagnosed according to the 2005 consensus criteria for probable dementia with Lewy bodies (McKeith et al., Reference McKeith2005), and probable AD was diagnosed according to the National Institute on Aging-Alzheimer's Association diagnostic guidelines (McKhann et al., Reference McKhann2011). As some of the assessment scales required caregiver input for completion, we also obtained written informed consent from the caregivers. A total of 30 healthy controls were recruited from amongst spouses of subjects and from volunteers on JDR lists. They were defined as subjects with MMSE scores greater than 26 and with an absence of (i) regular memory complaints, (ii) signs or symptoms suggestive of dementia, and (iii) unstable or significant medical illnesses. Participants underwent an assessment that included clinical, demographic, and global cognition (MMSE). We further investigated the Rey Auditory Verbal Learning test (RAVLT) as a more detailed measure of semantic memory (Rey, Reference Rey1941). Verbal learning was assessed using a 15-item word list over five trials (RAVL Total), immediate (A6) and delayed recall (A30) and true recognition (True Recognition) (i.e. recognition minus false positives). From these tests, we constructed a composite Z-score for memory domain based on the means and standard deviations of our healthy controls.
T1 and diffusion MRI
Participants underwent structural MRI at the Wolfson Brain Imaging Centre using a 3 T Siemens Magnetom Verio (Siemens AG, Erlangen, Germany) (28 controls, 21 MCI, 12 AD, and 11 DLB) or a 3 T Magnetom Trio Tim scanner (Siemens, Surrey, England) (two controls, two MCI, and four DLB). An initial three-dimensional structural high-resolution T1 weighted sequence was acquired in the sagittal plane (MPRAGE isotropic) for all participants to exclude any structural brain abnormality (176 slices of 1.0 mm thickness, TE = 2.98 msec, TR = 2,300 msec, flip angle = 9°, SENSE = 1, field of view = 256 × 240 mm2, acquisition matrix 256 × 240; voxel size = 1 × 1 × 1 mm3). The DTI protocol was as follows: 63 slices of 2.0 mm thickness, TE = 106 msec, TR = 11,700 msec, SENSE = 2, field of view = 192 × 192 mm2, acquisition matrix 96 × 96; voxel size = 2 × 2 × 2 mm3).
Processing of T1 images
Cortical reconstruction and volumetric segmentation of MRI data were performed using the beta version of Freesurfer 6 image analysis suite (http://surfer.nmr.mgh.harvard.edu/). The processing of T1 MRI images includes the following steps: removal of non-brain tissue, automated Talairach transformation, segmentation of the subcortical white matter and deep gray matter volumetric structures, intensity normalization, tessellation of the gray matter/white matter boundary, automated topology correction, and surface deformation to optimally place the gray matter/white matter and gray matter/CSF boundaries. The cortical thickness was calculated as the closest distance from the gray/white matter boundary to the gray/CSF boundary at each vertex. All surface models in our study were visually inspected for accuracy. Manual corrections were performed in the event of tissue misclassification/white matter errors while blinded to diagnostic group information. Four subjects (two AD and two DLB) who had excessive pial or white matter surface segmentation errors after the manual correction were excluded from all analyses.
Hippocampal subfield volumetry
To investigate the differential involvement of the hippocampal subfields across the groups, we used an automated segmentation tool based on a probabilistic statistical atlas built upon ultra-high resolution ex vivo MRI data (Figure 1). Volumetric measurements for CA1, CA2–3, CA4, dentate gyrus (DG), and total subiculum (subiculum, presubiculum, and parasubiculum) were obtained. Technical details of this method have been previously described (Iglesias et al., Reference Iglesias2015). Importantly, this technique represents a significant update over a previous version (van Leemput et al., Reference van Leemput2009), overcoming several limitations which have been documented in our previous work and others (Mak et al., Reference Mak2015a). Compared to its previous version (van Leemput et al., Reference van Leemput2009), the ultra-high resolution of the ex vivo MRI training data provided a better contrast between the subfield boundaries, which improved the reliability of the annotations in this version atlas. As a result, the subfield volumes estimated from this technique yielded greater agreement with those from histological studies (Iglesias et al., Reference Iglesias2015). Total intracranial volume (ICV) was used to correct volumetric segmentations for inter-individual differences in head sizes. This was calculated by the use of an atlas normalization procedure, which has been found to correlate strongly (r = 0.93) with manually derived ICV (Buckner et al., Reference Buckner2004).
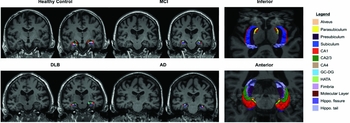
Figure 1. Illustration of hippocampal subfield from a representative subject in each group. Abbreviations: AD, Alzheimer's disease; MCI, mild cognitive impairment; DLB, dementia with Lewy bodies; MD, mean diffusivity; FA, fractional anisotropy; CA, cornu ammonis; DG, dentate gyrus.
Diffusion imaging parameters
The full multi-modal pipeline is illustrated in Figure 2. DTI data was pre-processed in native space using Freesurfer. Briefly, each DTI volume was corrected for residual eddy currents and head movement by affine registration to the b = 0 image (no diffusion weighting). Diffusion tensors were fitted using linear least squares optimization, and FA and MD images were calculated from the eigenvectors of the tensors. Intra-subject registration between the individual low-b diffusion and T1 MRI was performed by using an affine registration method that seeks to maximize the intensity contrast of the b = 0 image across the cortical gray/white boundary obtained from the T1. For our analyses of DTI parameters in the hippocampus, we sampled the T1 segmentations from the processed structural data into the diffusion space. All registrations were visually inspected for gross misalignments (Figure S1, available as supplementary material attached to the electronic version of this paper at http://journals.cambridge.org/ipg). Consistent with previous methodologies (Fjell et al., Reference Fjell2008; Den Heijer et al., Reference den Heijer2012), hippocampal masks were eroded inwards by 1 voxel across its boundary to account for partial volume effects (PVE) especially near the CSF. For each subject, MD and FA values were averaged across all voxels.
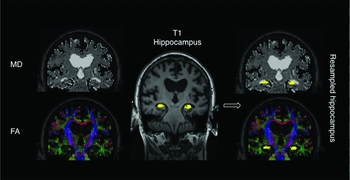
Figure 2. Image analysis pipeline. FA and MD maps were derived from DTI data in native space. Hippocampal segmentations from T1 were co-registered and resampled into the diffusion space for quantitative analysis of FA and MD values in the hippocampus.
Statistical analyses
Statistical analyses were performed with the STATA13 (http://www.stata.com/) software. Distribution of continuous variables was tested for normality using the Skewness–Kurtosis test and visual inspection of histograms. Parametric data were assessed using either t-tests or analysis of variance (ANOVA) for continuous variables. For non-parametric data, Wilcoxon rank-sum test or Kruskal–Wallis test was used. χ 2 tests were used to examine differences between categorical variables. To limit the number of statistical comparisons, and because neither AD nor DLB pathologies differentially involve either hemisphere, right and left hemispheric volumes were averaged for statistical analyses. ANCOVA – accounting for age, gender, and ICV – and post-hoc Tukey tests were used to compare imaging measurements between the groups. Associations among the three hippocampal measures (volume, MD, and FA) were assessed using Spearman rank correlations to evaluate whether hippocampal volume changes and microstructural diffusion changes were affiliated phenomena or independent from each other. To investigate the association of hippocampal measurements with memory domain, we performed partial correlations, correcting for age, gender, and ICV. Furthermore, we performed a series of statistical analyses to justify for the pooling of subjects who were scanned in the Magnetom Verio (n = 72) and Magnetom Trio (n = 8) scanners. First, a χ 2 test did not reveal a significant difference in the distribution of subjects scanned in each scanner across the groups. Second, comparability of the data was confirmed by analysis of variance of hippocampal volumes including group diagnosis, age, gender, intracranial volumes, and scanner as factors. In these analyses, the scanner effect was insignificant (p = 0.755). Lastly, within each diagnostic group, we also compared hippocampal volumes obtained from the two scanners, revealing no trend-level or significant differences. Statistical threshold of significance for all tests was set at p < 0.05.
Results
Sample characteristics and clinical features
Demographics, clinical characteristics of the sample are summarized in Table 1. There was a significant difference in age (F (3,76) = 4.16; p = 0.009) and education (χ²(3) = 17.11; p = 0.001) across the groups, although the subject groups were well matched for gender (χ²(3) = 4.77; p = 0.19). As expected, we found significant group differences in MMSE (χ²(3) = 45.28; p < 0.001), with patient groups performing worse relative to controls. MCI had higher MMSE scores compared to DLB (p < 0.001). All patient groups performed worse on the memory domain score compared to healthy controls (χ²(3) = 51.96; p < 0.001). We found no differences in memory function between MCI and DLB and between AD and DLB.
Table 1. Clinical and demographic characteristics of the study sample

Values expressed as mean ± 1 SD. ACE-r: Addenbrooke's Cognitive Examination revised; AD: Alzheimer's disease; DLB: dementia with Lewy bodies; GDS: Geriatric Depression Scale; HC: healthy controls; IFS: Institute of Cognitive Neurology Frontal Screening; MCI: mild cognitive impairment; MMSE: Mini-Mental State Examination.
* Significant at p < 0.05.
a χ 2 (df = 3).
b ANOVA.
c Kruskal–Wallis test (df = 3).
Total hippocampus
Comparisons of volume, FA, and MD measurements of the total hippocampus across the groups are illustrated in Figure 3. There was an expected main effect of group on total hippocampus [(F (6,73) = 17.23; p < 0.001)] after correcting for age, gender, and total intracranial volumes. Post-hoc Tukey tests revealed total hippocampal atrophy in both MCI and AD groups relative to controls (p < 0.001). Hippocampal volumes were significantly smaller in AD (p = 0.001) and MCI (p = 0.038) compared to DLB. Hippocampal MD was significantly elevated in AD relative to controls (p = 0.009). There was no significant main effect of hippocampal FA.

Figure 3. Bar charts showing the group comparisons of total hippocampal volume (mm3), MD, and FA across the groups. Volumetric comparisons (mm3) of the hippocampal subfields are also shown. Abbreviations: AD, Alzheimer's disease; MCI, mild cognitive impairment; DLB, dementia with Lewy bodies; MD, mean diffusivity; FA, fractional anisotropy; CA, cornu ammonis; DG, dentate gyrus.
Hippocampal subfields
The comparisons of hippocampal subfield volumes across the groups are described in Figure 3. AD showed global atrophy across all its subfields compared to controls. With the exception of the CA2-3, all other regions were also smaller in MCI compared to controls. DLB did not show any local atrophy across all the regions compared to controls. Among the patient groups, CA1 was smaller in AD (p = 0.005) and trend-level in MCI (p = 0.066) compared to DLB. Furthermore, both MCI (p = 0.003) and AD (p<0.001) showed significant total subiculum atrophy compared to DLB.
Associations of microstructural white matter changes with gray matter
Associations between microstructural and volumetric measurements are shown in Figure 4. Hippocampal FA was positively correlated with volume in the control group (r = 0.4, p = 0.039). In addition, hippocampal MD was negatively correlated with volume in MCI (r = −0.4, p = 0.032) and a trend-level association was observed in DLB (r = −0.5, p = 0.09). Overall hippocampal MD was also negatively associated with local subfield atrophy of the CA1 in MCI (r = −0.4, p = 0.046) and the total subiculum in DLB (r = −0.6, p = 0.020).

Figure 4. Scatter-plots of hippocampal volumes against FA and MD measures for each group. Abbreviations: AD, Alzheimer's disease; MCI, mild cognitive impairment; DLB, dementia with Lewy bodies; MD, mean diffusivity; FA, fractional anisotropy; CA, cornu ammonis.
Associations of imaging measures with memory domain
Within the MCI group, memory was associated with total hippocampal volume (r = 0.6, p = 0.01), and to a lesser extent with hippocampal MD (r = −0.44, p = 0.052). To compare the relative strength of MD and volume in the association with memory, we found that including hippocampal volume into a multivariate regression model weakened the association of hippocampal MD with memory (p = 0.123). In the full model (covariates: age, gender, intracranial volume, MD), hippocampal volume remained significantly correlated with memory (p = 0.012). No correlations were found with hippocampal FA.
Discussion
The combination of measures of macrostructural volume and microstructural properties provided new insights into the change in hippocampal subfields in AD, MCI, and DLB. The main findings in relation to our hypotheses were as follows: (a) hippocampal and subfield atrophy was more prominent in both AD and MCI than DLB; (b) group differences and memory correlations of hippocampal volumes were more pronounced compared to FA and MD; and (c) increased hippocampal MD was associated with smaller hippocampal and CA1 volumes in MCI and subicular volumes in DLB.
Volumetric comparisons of the hippocampal subfields
Our findings of total hippocampal atrophy and widespread subfield losses in both MCI and AD are in agreement with the literature (de Flores et al., Reference de Flores, La Joie and Chételat2015). None of the subfields in AD and MCI were spared with the exception of CA2-3 in the MCI group. These findings are corroborated by previous imaging studies (Apostolova et al., Reference Apostolova2006; Wisse et al., Reference Wisse, Reijmer, Kuijf and Leemans2015; Mak et al., Reference Mak2015a), including post-mortem evidence indicating greater CA1, CA2, CA3, and subiculum atrophy in AD relative to healthy controls (Bobinski et al., Reference Bobinski1995).
In contrast to both AD and MCI, the DLB group exhibited hippocampal preservation compared to healthy controls across the subfields. In particular, CA1 and subiculum volumes were significantly smaller in AD compared to DLB. The differential vulnerability of the CA1 in AD and DLB is also consistent with distinct neuropsychological profiles of both groups, in that episodic memory impairment is often a relatively late event in the progression of DLB compared to AD. The CA1 has extensive reciprocal projections with the enthorinal cortex and previous evidence from high-resolution 4T imaging (Mueller et al., Reference Mueller, Chao, Berman and Weiner2011) and lesion (Rempel-Clower et al., Reference Rempel-Clower, Zola, Squire and Amaral1996) studies have indicated a characteristic involvement of CA1 neurons in subserving episodic memory processes. In addition, the observation of CA1 preservation in DLB confirmed previous work from our group (Firbank et al., Reference Firbank, Blamire, Teodorczuk, Teper and Burton2010; Mak et al., Reference Mak2015a) and others (Delli Pizzi et al., Reference Delli Pizzi, Franciotti, Bubbico, Thomas, Onofrj and Bonanni2016) using a different technique (van Leemput et al., Reference van Leemput2009). These findings in DLB are also largely consistent with histopathological evidence in DLB, indicating that neuronal loss and Lewy neurites are largely confined to the CA2-3 with sparing of the CA1 and subiculum regions (Harding et al., Reference Harding, Lakay and Halliday2002). However, CA1 atrophy in DLB has also been reported by others (Sabattoli et al., Reference Sabattoli, Boccardi, Galluzzi, Treves, Thompson and Frisoni2008; Chow et al., Reference Chow2012). Differences in the findings could be attributed in part to different techniques of analyses: subfield volumetric analyses (Mak et al., Reference Mak2015a; Delli Pizzi et al., Reference Delli Pizzi, Franciotti, Bubbico, Thomas, Onofrj and Bonanni2016), radial-distance mapping (Chow et al., Reference Chow2012), and analyses of shape deformations (Sabattoli et al., Reference Sabattoli, Boccardi, Galluzzi, Treves, Thompson and Frisoni2008). In addition, the mean age of the DLB subjects in Chow et al. (Reference Chow2012) and Sabattoli et al. (Reference Sabattoli, Boccardi, Galluzzi, Treves, Thompson and Frisoni2008) were on average 6 years older than the DLB subjects in this study (mean age = 72.6). This age difference between the studies is noteworthy considering the preferential vulnerability of CA1 to age-related processes, where volume loss is most pronounced in the seventh decade of life (Mueller et al., Reference Mueller2007).
Microstructural comparisons of the hippocampus
Previous studies in AD have demonstrated that increased MD represents loss of neuron cell bodies, axons, and dendrites, which could lead to macroscopic structural changes. As described, global hippocampal and subfield atrophy was evident in AD and MCI compared to healthy controls. Furthermore, these macrostructural changes are paralleled by microscopic disturbances in the AD group, which showed elevated MD compared to controls. We did not find any microstructural differences between MCI and AD. This is consistent with previous studies (Kantarci et al., Reference Kantarci2001; Fellgiebel et al., Reference Fellgiebel2004) and fits with our observation of comparable hippocampal volumes in both groups. Neurodegenerative processes in AD such as extensive cell loss and atrophy could lead to increased diffusivity that could explain the observations of increased MD in AD. Specifically, pathologic disruption of cell membranes, loss of myelin, and axonal processes would lessen the restriction on diffusivity and result in an increase in MD. In addition, neuroinflammation and associated microglial activation in AD – a topic of ongoing investigation by our group – is commonly associated with neuritic senile plaques, which are also expected to increase MD by producing an expansion of the extracellular space. From autopsy studies, it is established that accumulation of intracellular tau occurs early within the hippocampus (Braak and Braak, Reference Braak and Braak1991), potentially leading to larger amounts of extracellular fluid, which in turn lead to a higher hippocampal MD. Future studies with in vivo tau imaging would be desirable to probe the involvement of tau pathology in the microstructural disintegration of the hippocampus.
However, we did not detect significant microstructural alterations of FA and MD in MCI. Our findings are thus only partially consistent with previous studies of MCI and AD (Kantarci et al., Reference Kantarci2001; Fellgiebel et al., Reference Fellgiebel2004; Müller et al., Reference Müller2005), where elevated MD was reported in both MCI and AD without FA decreases. On the other hand, the absence of microstructural changes in our MCI group is corroborated by other studies (Bozzao et al., Reference Bozzao, Floris, Baviera, Apruzzese and Simonetti2001; Zimny et al., Reference Zimny2013). As such, the literature of MD changes in MCI is inconclusive at present. Several reasons could account for these discrepant findings. The earlier studies reporting increased hippocampal MD in MCI markedly differed in acquisition protocols: 1.5T scanner, thicker slices (5 mm vs 2 mm in our study) and fewer directions (3 and 6 vs 64 in our study) (Kantarci et al., Reference Kantarci2001; Fellgiebel et al., Reference Fellgiebel2004; Müller et al., Reference Müller2005). These thicker sections could potentially compound the PVE from CSF voxels surrounding the atrophic hippocampus, leading to higher MD in MCI and AD.
Although MCI and AD have been the subject of hippocampal FA and MD analyses, the microstructural properties of the hippocampus in DLB is still unknown. Contrary to our hypothesis, no differences in FA and MD were found in DLB compared to healthy controls and MCI/AD, suggesting that the volumetric preservation of the hippocampus was accompanied by intact microstructural properties. Furthermore, the lack of significant FA/MD differences between DLB and MCI/AD suggests that volumetric hippocampal measurements have greater clinical utility in differential diagnosis compared to DTI analyses.
Inter-modality correlations: microstructural changes and volumetric atrophy
We showed a negative correlation between hippocampal MD and volume in the MCI group, confirming findings from previous studies in MCI (Kantarci et al., Reference Kantarci2005). Further, our findings extended the literature by demonstrating that the MD of the whole hippocampus was also related to localized atrophy of the CA1 in MCI, and the subiculum in DLB. The negative association between the overall hippocampal MD and subiculum atrophy in DLB is particularly interesting in light of the preserved subiculum volume at the group level. We could therefore surmise that the co-varying hippocampal MD is reflecting an early process of neuronal loss that may eventually lead to subicular atrophy, as previously found in older samples of DLB subjects (mean age 78) (Chow et al., Reference Chow2012; Mak et al., Reference Mak2015a). This notion is also supported by recent histopathological evidence that MD, other than volume, was the most prominent in vivo marker for neuronal density, where it showed negative correlations with both neuronal density and hippocampal size (Goubran et al., Reference Goubran2015). It would be necessary to test this hypothesis in a longitudinal design with baseline measures of MD and rate of hippocampal atrophy over time or vice versa.
Correlations of DTI and volumetric measurements with memory
Recent studies have suggested the superiority of microscopic DTI changes compared to volume loss in the strength of correlations with clinical measures and prediction of subsequent cognitive decline (Kantarci et al., Reference Kantarci2005; Müller et al., Reference Müller2005). Müller et al. (Reference Müller2005) showed that increased hippocampal MD was the strongest independent predictor of verbal memory in a combined MCI and control group, whereas hippocampal volume only explains a small variance of memory function. Although we found a near-significant correlation between hippocampal MD and memory within the MCI group, it was substantially attenuated after including hippocampal volume as a covariate. Furthermore, hippocampal volume remained as the sole independent predictor of memory in the full model. Given the mean age of our MCI group, it is possible that some of our MCI subjects are approaching the later stages of AD, and that volumetric loss represents a closer temporal event to cognitive impairment than earlier microstructural changes. Future amyloid imaging in the MCI group will be of particular relevance. An additional analysis pooling the entire sample also yielded the same conclusion by showing that volume was more strongly correlated with memory than MD (data not shown). There were no correlations between FA and the memory domain across the groups. These null findings, including ours, could be attributed, in part, to the heterogeneous orientations of the fibers within the hippocampus, in turn manifesting in a floor-effect of low FA values.
Strengths and limitations
The chief strength of this study is the joint-analysis of DTI and GM based on a rigorous intra-subject registration, allowing us to investigate the association of microscopic cellular changes with macrostructural atrophy in the same individual and stereotaxic space. Nonetheless, we acknowledge that multi-modal imaging is not without potential pitfalls. The larger voxel dimensions of DTI data render it prone to PVE by averaging of CSF across tissue types. For instance, erroneous inclusion of CSF voxels, particularly in subjects with severe hippocampal atrophy, would induce higher MD values due to the unrestricted pattern of diffusion in the CSF space. For each participant in this study, we also performed a thorough visual inspection of the resampled hippocampal segmentations in diffusion space, revealing no participant with gross misalignments of registrations (Figure S1). Furthermore, we also accounted for potential CSF contamination by eroding the boundaries of the hippocampus. Some other potential limitations of this study include the lack of neuropathological verification of AD and DLB, as subject groups were based on clinical diagnosis, though this is an inherent limitation of all ante-mortem imaging studies. Furthermore, we have previously demonstrated good agreement between clinical and pathological diagnosis using the consensus clinical diagnostic method adopted here (McKeith et al., Reference McKeith2005). Finally, any interpretation of our findings should consider the caveat that we did not correct for multiple comparisons due to the high correlation among the hippocampal subfields and the over-conservatism of Bonferroni in this particularly setting.
Conclusion
In this multi-modal study, we used an improved segmentation technique to compare atrophy patterns of hippocampus and its subfields in a well-characterized group of MCI, AD, and DLB subjects, revealing different topographical patterns of subfield atrophy in DLB relative to both MCI and AD. Furthermore, we jointly evaluated microstructures of the hippocampus and their associations with hippocampal volumes and memory. Despite recent suggestions that microstructural changes could be more sensitive than macroscopic atrophy, our present findings of (a) hippocampal atrophy in the absence of diffusion changes in MCI and (b) stronger volumetric-memory correlations instead of MD do not argue in favor of that notion. On-going longitudinal neuropsychological assessments in this cohort will enable us to clarify the relative predictive utility of hippocampal MD and volumetric measurements.
Conflict of interest
None declared.
Description of authors’ roles
EM developed the research question, performed the imaging and statistical analyses, and wrote the paper.
SG assisted with the visual inspection of image processing and co-registrations, performed the statistical analyses, and revised the paper.
LS, GBW, RA, LP, PVR, and AJ provided critical feedback and revised the paper.
RA, LP, PVR, and AJ also conducted the data collection.
JOB and JBR designed the study protocols, supervised the study, and both are the co-principal investigators of the study.
Acknowledgments
This study is funded by the UK National Institute of Health Research Cambridge Biomedical Research Centre and Biomedical Research Unit in Dementia. JBR is supported by the Wellcome Trust (103838). JPC is supported by the UK National Institute of Health Research Biomedical Research Centre at Cambridge. PVR is supported by the PSP Association. EM is in receipt of a Gates Cambridge scholarship and an Alzheimer's Research UK Research Grant.
Supplementary material
To view supplementary material for this article, please visit https://doi.org/10.1017/S1041610216002143.


 Open access