


Food-based dietary recommendations advise fish consumption as a meaningful part of a healthy diet(Reference Alexander, Anderssen, Aro, Becker, Fogelholm, Lyhne, Meltzer, Pedersen, Pedersen and Thorsdottir1–4), often in an amount corresponding to at least two main course servings per week and as a side dish such as bread spread(Reference Steingrimsdottir, Thorsgeirsdottir and Olafsdottir2, 4). Fish is an excellent source of many nutrients such as good-quality protein as well as nutrients found in scarce amounts in other food items such as long-chain n-3 fatty acids and vitamin D, or those found in small amounts in many food items such as iodine and selenium(Reference Alexander, Anderssen, Aro, Becker, Fogelholm, Lyhne, Meltzer, Pedersen, Pedersen and Thorsdottir1). Epidemiological studies have related fish consumption to decreased risk of type 2 diabetes(Reference Nkondjock and Receveur5, Reference Feskens, Bowles and Kromhout6) and fatal coronary artery disease(Reference Marckmann and Gronbaek7, Reference Erkkila, Lehto, Pyorala and Uusitupa8). However, large groups, especially young people in Europe, eat less than the recommended amount of fish(Reference Steingrimsdottir, Thorsgeirsdottir and Olafsdottir2, 9–Reference Fernandez-Vergel, Penarrubia-Maria, Rispau-Falgas, Espin-Martinez, Gonzalo-Miguel and Pavon-Rodriguez11). Incorporating a daily fish meal rich in n-3 fatty acids into a weight-loss regime has been found to improve both glucose–insulin metabolism and dyslipidaemia(Reference Mori, Bao, Burke, Puddey, Watts and Beilin12). Fish consumption in young overweight individuals is therefore of special concern. They may be at higher risk for developing the metabolic syndrome than both their parents’ generation and their normal-weight peers of the same generation(3). They may also themselves be parents to children at higher risk of overweight and its complications(Reference Vandewater and Huang13). Information on fish consumption in young overweight European adults is needed. Compliance with diets under investigation in intervention studies is an important part of quality control.
The aim of the present study was to investigate the frequency of fish consumption among young overweight European adults in Iceland, Ireland and Spain, participating in a weight loss intervention study. Compliance in each country to the four diets varying in seafood content, including no seafood (control diet), lean fish (cod), fatty fish (salmon) or fish oil capsules was also investigated.
Subjects and methods
The intervention was performed simultaneously at three centres, in Iceland (n 140), Spain (n 120) and Ireland (n 64). Subjects were recruited through advertisments at large workplaces in the area around the research centres from autumn 2004 to spring 2005. Subjects were 20–40 years of age, with a BMI of 27·5–32·5 kg/m2, with a mininum waist circumference of 80 cm (women) or 94 cm (men). Exclusion criteria included pregnancy or lactation, fish allergy, large fluctuations in weight (±3 kg) over the previous 3 months, intake of supplements containing n-3 fatty acids over the same time period as well as drug treatment for diabetes, hypertension or hyperlipidaema.
Consumption and habits at baseline
Before entering the intervention, the subjects who met the inclusion criteria filled out a validated FFQ(Reference Birgisdottir, Kiely, Martinez and Thorsdottir14) aimed at evaluating fish and fish oil intake over the previous 4 weeks. Information on physical activity patterns during the previous year, smoking habits, alcohol consumption and use of medicine (other than in exclusion criteria) was collected using a questionnaire. Anthropometric measurements and collection of blood samples were also performed at baseline. Table 1 shows the characteristics of the subjects at baseline.
Table 1 Characteristics of the subjects at baseline (n 324)
The intervention
Participants were randomly assigned (computerised randomisation by SPSS) to one of four experimental diets. These included cod (three meals per week, 150 g each) or salmon (three meals per week, 150 g each) or fish oil supplementation (six capsules per day) or a control diet with no fish or fish oil included, with only placebo oil supplementation (six capsules of high-oleic sunflower oil per day). Table 2 shows the amount of n-3 and n-6 fatty acids provided by the fish and capsules calculated as mg/d(Reference Thorsdottir, Tomasson, Gunnarsdottir, Gisladottir, Kiely, Parra, Bandarra, Schaafsma and Martinéz15). The cod was supplied by Samherji, Iceland, and the salmon by Marine Harvest, Nutreco, Norway. Both types of capsules were supplied by Loders Croklaan (lipid-nutrition), Wormerveer, The Netherlands, and encapsulated by Banner Pharmacaps, Tilburg, The Netherlands. The capsule groups were single blind as the participants did not know whether they were taking in capsules of fish oil or sunflower oil. All the fish and the capsules were supplied free of charge to the participants. The participants were also handed recipes for fish and meat dishes as suggestions. Other sources of fish or fish oil capsules or other sources of n-3 fatty acids were not allowed during the study period. The diets were all weight-lowering diets, isoenergetic, with similar macronutrient composition and individually designed to give 30 % less energy than the calculated energy expenditure of each participant(Reference Thorsdottir, Tomasson, Gunnarsdottir, Gisladottir, Kiely, Parra, Bandarra, Schaafsma and Martinéz15). Participants made three visits to the clinic for dietary advice and anthropometric measurements, i.e. at baseline, midpoint (week 4) and at endpoint (week 8). Blood samples were collected at baseline and endpoint. The participants were also contacted by phone 2 weeks after the baseline visit and again 2 weeks before their endpoint visit. Subjects were instructed not to change their physical activity level during the 8-week intervention period and to keep their alcohol consumption to a minimum (maximum one drink of wine or beer per week).
Table 2 Amount of n-3 and n-6 fatty acids provided by the fish and capsules calculated as mg/d
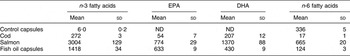
ND, non-detectable.
Measurements of compliance
The validated FFQ(Reference Birgisdottir, Kiely, Martinez and Thorsdottir14) aimed at evaluating the consumption of fish and fish oil over the previous 4 weeks and was completed by the participants at midpoint (4 weeks) and endpoint (8 weeks), as well as at baseline. From this questionnaire, the consumption of fish and fish oil at baseline as well as compliance to the study protocol was evaluated, i.e. whether the participants consumed the fish and capsules provided to them and did not consume any additional fish or fish oil capsules during the study period. Changes over the study period in the erythrocyte long-chain n-3 fatty acids, EPA and DHA, which are unique for seafood products, were measured as an additional control. This analysis on extracted erythrocyte membrane phospholipids was carried out using gas chromatography following the conditions described by Bandarra et al.(Reference Bandarra, Palma, Batista, Nunes, Morais, Bruges, Dickson, Barata and Silva Lima16). The proposed Omega-3 Index of EPA + DHA was used in the calculations(Reference Harris and von Schacky17).
Participation rate and ethical approval
In total, 276 of the participants (118 men and 158 women) concluded the 8-week intervention (85 %), ranging from 80 % in Iceland to 88 % in Ireland and Spain. Figure 1 shows the flow of participants in the study. Dropouts were equally distributed between intervention diet groups, which shows along with the high participation rate that all the diets were well tolerated. The two most common reasons reported for dropout were that the subject was unable to follow the restricted diet and/or lack of time to maintain the schedule of clinical visits. The dropouts were younger and more likely to use antidepressants than completers, and women dropouts were more likely to consume alcohol. Beforehand it was estimated that 70–80 % participation rate would allow a detection of approximately 1 kg difference in weight loss between the four diet groups, assuming a standard deviation (sd) of 3 kg, a significance P value of 0·05 and a statistical power of 0·8. The study was approved by the National Bioethical Committee in Iceland (04-031), the Ethical Committee of the University of Navarra in Spain (24/2004) and the Clinical Research Ethics Committee of the Cork University Hospital in Ireland. The study followed the Helsinki guidelines and all subjects participating gave their written consent before the study.
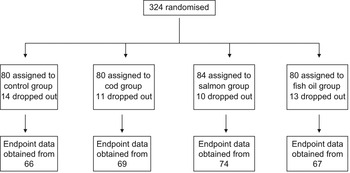
Fig. 1 Flow chart for participation in the study
Statistical analysis
Results are given as medians with the 20th and 80th percentile, as mean and standard deviation or as percentages of a group or the whole sample. Kolmogorov–Smirnov test was used to check for normal distribution. The correlation coefficient is Spearman’s. The non-parametric Kruskal–Wallis test for several independent samples was used to compare the frequency of fish consumption between countries and across groups at baseline, while the Mann–Whitney U test was used to compare two groups. The χ 2 test was used for comparison of dichotomous values, both across the four diet groups and when comparing two variables. The independent Student’s t test was used to analyse the n-3 fatty acids between two groups with different frequency of fish intake at baseline as well as in gender analysis. Repeated measures ANOVA was used to analyse the effect of diet groups on changes in erythrocyte long-chain n-3 fatty acids during the intervention period. Pre- and post measures of EPA + DHA were used as within-subjects factor and diet group as between-subjects factor. When statistically significant, the data were further analysed for pairwise group comparison (Tukey’s post hoc test). Changes in EPA + DHA over the intervention period were analysed by within-group pairwise comparisons in the repeated measures ANOVA model. The P value <0·05 was considered statistically significant and the statistical analysis was performed by SPSS 10.0 software (SPSS Inc., Chicago, IL, USA).
Results
Frequency of fish consumption at baseline was five (median) times per month as the main meal and five times per month as bread spread or side dish. The 20th and 80th percentiles were 2 and 10, respectively, for both variables. One-third of the participants (34 %) fulfilled the recommended intake of eating fish twice a week or more, often as the main course, while 26 % reported eating fish as the main meal twice a month or less. The mean percentage of EPA + DHA in erythrocytes in the group reporting the highest fish intake (>8 times per month) was 7·7 (sd 2·4) compared to 6·6 (sd 1·5) among those consuming less (P < 0·001). The correlation coefficient between fish as main meal and percentage of EPA + DHA in erythrocytes at baseline was 0·22 (P < 0·001). Fish as main meal categorised by country is shown in Table 3. Differences in the frequency of fish consumption at baseline were considerable between Spain and the other two countries (P < 0·001). The mean percentage of EPA + DHA in erythrocytes at baseline was similar between the countries (P = 0·423), 7·0 (sd 2·0) in Iceland, 6·7 (sd 1·5) in Ireland and 7·1 (sd 2·1) in Spain. Men reported eating fish as the main meal slightly more often than women with median (20th–80th percentiles) being 5 (3–10) and 5 (2·5–10), respectively, (P < 0·001). Similar results were found for fish as the side dish (P = 0·006). There was no statistical difference in the mean percentage of EPA + DHA in erythrocytes at baseline between men (6·9 (sd 1·9)) and women (7·0 (sd 1·9)) (P = 0·599).
Table 3 Frequency of fish consumption as main meal at baseline
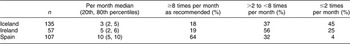
Kruskal–Walis test for several independent samples (P < 0·001).
At baseline, the frequency of fish consumption was similar in the four diet intervention groups (Table 4). Table 4 also shows the frequency of fish consumption during the first 4 weeks of the intervention as well as the second 4 weeks. Only six participants, 4 % in the groups consuming fish, reported that they did not finish their portions, eating 25–80 % of the fish given to them. Table 5 shows the percentage of participants that reported eating additional fish (not supplied by the research team) during the study period, although this should be avoided according to the study protocol. This was different between the countries, ranging from 6 % of the participants in the first 4 weeks in Ireland to 36 % over the latter 4 weeks of the study period in Spain. In the first 4 weeks the extra fish consumed was always less or equivalent to two meals a month except in five cases (1·8 %), while in the latter part of the study a higher consumption was reported in twelve cases (4·4 %). Compliance not to eat any fish, other than that supplied by the research team, was better in the first 4 weeks of the study than in the latter 4 weeks (P < 0·001). No gender differences were observed in compliance, either in the first 4 weeks (P = 0·408) or in the latter part of the study (P = 0·241). No participant reported intake of additional fish oil during the study period. Table 6 shows the percentages of the long-chain n-3 fatty acids (EPA + DHA) in erythrocyte phospholipids at baseline and endpoint in each of the diet groups. The repeated measures ANOVA yielded a significant pre–post main effect (F (1,263) = 41·34, P < 0·001) and significant interaction between the pre–post measures of EPA + DHA and the diet groups (F (3,263) = 19·34, P < 0·001) was found. Pairwise group comparison revealed a statistically significant difference in EPA + DHA between the cod and salmon groups (P < 0·001) and cod and fish oil groups (P = 0·007) as well as between the control and salmon groups (P < 0·010). Within-group analysis (Table 6) showed that percentage of EPA + DHA in erythrocytes increased over the study period in the fish oil group and salmon group and a small increase was found in the cod group. The control group lowered its percentage of EPA + DHA over the study period.
Table 4 Frequency of fish consumption reported at baseline, week 4 and week 8, in the four diet groups, median (20th, 80th percentiles)
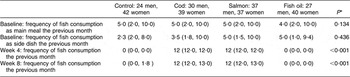
*Kruskal–Wallis analysis for several independent samples.
Table 5 Percentages of participants in the four diet groups who reported consuming additional fish, other than that supplied by the research team

*χ 2 test.
†No additional fish consumption was allowed according to the study protocol.
Table 6 Percentages of long-chain n-3 fatty acids EPA + DHA in erythrocyte phospholipids (n 267) in the diet groups at baseline and endpoint
*Within-group comparison in the repeated measures ANOVA model.
Discussion
The frequency of fish consumption is lower than frequently recommended in this group of young overweight European adults. Only one in three fulfils the recommendation of consuming fish as a main course at least twice a week(Reference Steingrimsdottir, Thorsgeirsdottir and Olafsdottir2, 4) but regular consumption of fish is advised as part of a healthy diet by Nordic and international dietary recommendations(Reference Alexander, Anderssen, Aro, Becker, Fogelholm, Lyhne, Meltzer, Pedersen, Pedersen and Thorsdottir1, 3). The results support earlier studies indicating low consumption of fish among young people in Europe(Reference Steingrimsdottir, Thorsgeirsdottir and Olafsdottir2, Reference Hill, O’Brien, Cashman, Flynn and Kiely10, Reference Fernandez-Vergel, Penarrubia-Maria, Rispau-Falgas, Espin-Martinez, Gonzalo-Miguel and Pavon-Rodriguez11). There are however very large differences between the countries. Spain (Navarra) has a much higher frequency of consumption compared to consumption in Ireland (Cork) and Iceland (Reykjavik) with only one in five fulfilling the recommendation in these countries. Furthermore, in these two countries a larger group is found at the lowest end of the spectrum, consuming fish as a main meal only two times or less per month, which is a cause for concern. Not least considering that the mean age of the participants in the study is 31 years, hinting that many of the participants are already or may in the future become parents to young children. As parents are found to be one of the key correlates of children’s fish consumption(Reference Feunekes, de Graaf, Meyboom and van Staveren18, Reference Cook, Weitzman, Auinger, Nguyen and Dietz19), this lack of fish consumption is likely to affect the next generation as well.
Lack of fish in the diet can have serious consequences, resulting in less than recommended intakes of a range of different nutrients. These nutrients are vitamin D, iodine, selenium(Reference Alexander, Anderssen, Aro, Becker, Fogelholm, Lyhne, Meltzer, Pedersen, Pedersen and Thorsdottir1, Reference Steingrimsdottir, Thorsgeirsdottir and Olafsdottir2, Reference Grant and Holick20, Reference Gunnarsson, Indriðason, Franzson, Halldorsdottir and Sigurdsson21) and even proteins, suggested to have beneficial bioactive peptides(Reference Tremblay, Lavigne, Jacques and Marette22, Reference Yahia, Madani, Prost, Prost, Bouchenak and Belleville23), as well as long-chain n-3 fatty acids. Excluding fish from the diet requires the individual to have extended nutritional knowledge regarding other dietary sources of these nutrients. In the present study those eating fish according to the recommendations had higher erythrocyte levels of n-3 fatty acids at baseline. The relatively low correlation between fish as main meal and percentage of erythrocyte EPA + DHA in the study is to be expected. Reporting simply fish consumption in the main meal is a rather crude measurement, especially because fish as a side dish may contain more fatty fish. Fish consumed as a main meal in all three countries tends to be lean fish, contributing less n-3 long-chain PUFAs to the diet. A strong correlation would therefore not be expected. However, the results indicate that there clearly is a trend towards higher percentage of long-chain n-3 with increased fish intake. The similarities in the percentage of EPA + DHA between the countries despite differences in the frequency of fish consumption are also interesting and might reflect other differences in the diet between the countries. The small difference found in the frequency of fish consumption between men and women is most likely not large enough to be detected in the percentage of n-3 fatty acids in erythrocytes at baseline and might be of no clinical significance. However, greater endogenous conversion of α-linolenic acid into DHA among women compared to men(Reference Burdge and Wootton24) might partly explain this discrepancy.
Although it is not always clear to which components of fish the health effects of decreased diabetes risk(Reference Nkondjock and Receveur5, Reference Feskens, Bowles and Kromhout6) and better cardiovascular health(Reference Marckmann and Gronbaek7, Reference Erkkila, Lehto, Pyorala and Uusitupa8, Reference Banning25) should be attributed, it is clear that including fish as part of a healthy diet benefits the consumers and is an important public health goal(Reference Dahl, Bjorkkjaer, Graff, Malde and Klementsen26). Our study shows that among young overweight adults in Iceland and Ireland, which is a group at higher risk for the metabolic syndrome than their normal-weight counterparts, fish consumption is very low. In Iceland, it is even lower than population figures for the same age group(Reference Steingrimsdottir, Thorsgeirsdottir and Olafsdottir2). This should be the basis for focused public health campaigns with the key target group of 20–40 years, aiming at increasing fish consumption among the increasing group of young overweight adults in Europe.
Compliance to the diets under investigation is an important part of quality control in intervention studies(Reference Vander27, Reference Windhauser, Evans, McCullough, Swain, Lin, Hoben, Plaisted, Karanja and Vollmer28). It was important that the participants complied well to the instructions given regarding fish and capsule intake and with the ban on eating extra fish and capsules. Compliance to the study protocol with regard to intake of fish and capsules was good in all four intervention groups. The amount of fish consumed additionally was evaluated and considered too small to be able to affect the results of the study. It seems likely that the majority of these cases are due to an occasional dinner or lunch or other settings outside the home. An observation supporting this is that the additional consumption was not higher in the capsule groups compared to the groups consuming fish. Culture differences might also be part of the explanation, as those who had a habitual high fish consumption at baseline were more likely to eat extra fish. No participant reported intake of extra capsules of fish oil and almost all of the participants managed to finish their portions of fish. Monitoring intake of capsules was not as exact as for fish intake but very few participants reported problems in consuming the six capsules per day. Those who did not comply fully with the instructions given did not distinguish themselves from other participants in age or weight loss over the 8 weeks. The fact that the compliance to the diets decreased over time, with more participants eating extra fish as the study went on, must be noted. It clearly shows, as other studies have pointed out(Reference Burke and Dunbar-Jacob29), that the study period in an intervention study has to be balanced against the readiness of the participants to comply to the diets, especially when the diet under investigation is part of the habitual diet. With a very high participation rate, the study seems to have succeeded in this, but a variety of adherence-promoting strategies were incorporated into the study protocol. The participants visited the clinic three times over an 8-week period, but most of them worked close to the centres. They were telephoned twice in between, which has demonstrated efficacy in promoting behaviour change to improve adherence(Reference Burke, Dunbar-Jacob, Orchard and Sereika30). They could call up the researchers any time with questions. Fish and capsules were given free of charge, recipes (for fish and meat) and clear dietary instructions were given both orally and on paper. All this was undoubtedly important for compliance as well as contributing to the 85 % participation rate, which is high for a study like this, and to the similar dropout rate from all the four dietary groups. The fact that only a very few individuals in the two fish groups did not finish the fish given to them demonstrates that at least when given the right circumstances, i.e. obtaining the fish along with different recepies, low fish consumers are able to increase their fish consumption with relative ease. The dose of 450 g of fish a week was well tolerated. Changes in long-chain n-3 fatty acids in erythrocytes over the study period were very valuable as an additional compliance check. Results showed, as anticipated beforehand, a larger increase in n-3 fatty acids in the groups consuming fish oil, either in the form of salmon or fish oil capsules and furthermore a small increase in the cod group, demonstrating that it is a valid source of long-chain n-3 fatty acids. The important finding of the larger intervention study, focusing on weight loss as a result of the four diets, is that following an energy-restricted diet for 8 weeks containing lean or fatty fish or fish oil resulted in more weight loss in men than did an energy-restricted diet without marine food. The addition of seafood to a nutritionally balanced energy-restricted diet may thus boost weight loss(Reference Thorsdottir, Tomasson, Gunnarsdottir, Gisladottir, Kiely, Parra, Bandarra, Schaafsma and Martinéz15). This study is part of the SEAFOODplus Integrated Programme, which has the strategic objective to reduce health problems and to increase well-being among European consumers by applying the benefits obtained through consumption of health-promoting and safe seafood products of high eating quality(31).
Summing up, the frequency of fish consumption is much lower than recommended, which could have serious health consequences for this group of young overweight European adults. Compliance to the study protocol was good in all the four intervention groups. Therefore, including more fish in the diet of young European overweight adults should be encouraged.
Acknowledgements
Conflicts of interest:There are no conflicts of interest to disclose in relation to the current research.
Sources of funding:European Commission, 6th Framework Programme. SEAFOODplus Integrated Project, pillar 1, project 2: YOUNG. Contract with Ref. FOOD-CT-2004-506359.
Author contributions:All the authors (B.E.B., N.B., I.T., M.K., J.A.M.) actively participated in the conception, design (nutritional and biochemical assessments), data collection and critical revision of the manuscript. Also, B.E.B. was responsible for the statistical analysis and the draft of the manuscript. N.B. was responsible of the measurement of fatty acid composition in membrane erythrocytes and the project co-ordinator at Portugal. M.K. was responsible for the placebo capsules and the fish oil supplementation and the project co-ordinator at Ireland. J.A.M. was the project co-ordinator at Spain. I.T. was the project leader.


