


Global estimates indicate that 43 % of children under the age of 5 years suffer from anaemia( Reference Stevens, Finucane and De-Regil 1 ) and that about half of anaemia is caused by Fe deficiency. However, the prevalence and aetiology of anaemia are likely to be context-specific( Reference Stoltzfus, Mullany and Black 2 ). Due to the high nutrient (e.g. dietary Fe) demands needed to support early physical growth, rapid brain development and early learning capacity, the infancy and pre-school periods are especially vulnerable to anaemia( Reference Hadler, Juliano and Sigulem 3 , Reference Kotecha 4 ). Anaemia and Fe deficiency are associated with perinatal mortality( Reference Allen 5 ), delayed child mental and physical development, negative behavioural consequences and reduced auditory and visual function( Reference Grantham-McGregor and Ani 6 , Reference Algarin, Peirano and Garrido 7 ). Some of the consequences of early anaemia and Fe deficiency may be irreversible( Reference Lozoff, Jimenez and Smith 8 , Reference Iannotti, Tielsch and Black 9 ).
In low- and middle-income countries, epidemiological evaluation is important in designing anaemia control programmes( Reference Pasricha, Drakesmith and Black 10 , Reference Sachdev and Gera 11 ). In India, national databases indicate an alarming anaemia prevalence of 80 % among 6–35-month-old children and 58 % among 36–59-month-old children( 12 ). Although anaemia is considered to be multifactorial, most current strategies in India focus on increasing Fe intake because Fe is often a major cause of anaemia and there is insufficient evidence on other factors associated with anaemia among <5-year-old children. Multiple factors such as Fe deficiency, maternal Hb and food insecurity have been implicated in the aetiology of anaemia among children aged 12–24 months from Bangalore( Reference Pasricha, Black and Muthayya 13 ). The present study aimed to characterise anaemia and assess the factors associated with anaemia among 6–12-month-old and 29–56 month-old-children, completing the spectrum and providing a holistic picture to formulate strategies aimed at anaemia prevention in children <5 years of age.
Participants and methods
Study design, site and participants
Project Grow Smart is a randomised controlled interventional trial, registered as NCT01660958. Details related to the development of the study design, study protocols, ascertainment of local approvals, and formative and pilot research are provided elsewhere( Reference Fernandez-Rao, Hurley and Nair 14 ).
The study was conducted among infants and pre-schoolers in twenty-six villages of four state administrative blocks from Nalgonda district in the State of Telangana, which is the newest state of India, bifurcated from Andhra Pradesh. Infants and pre-schoolers with chronic morbidities, developmental delays, physical handicaps, or whose parents were planning to move out of the area within one year were excluded from the study. Children with severe anaemia (Hb<70 g/l) or severe stunting (length/height-for-age Z-score ≤−3) were not enrolled and were referred to the local hospital for evaluation and treatment, as indicated.
Recruitment for the infant phase was carried out by village-level workers, hired and trained as part of the study. The list of households in each village was procured from local social welfare workers (anganwadi workers). A door-to-door survey was carried out to identify households with infants aged 6–12 months. Of 551 infants in the designated age range, three were ineligible due to morbidity and developmental delay, twenty-one were not permanent residents and nine refused. Village-level workers enrolled the remaining 518 mothers and their infants after obtaining written consent. The pre-school phase was carried out by enrolling anganwadi centres (Indian public pre-schools set up under the government-sponsored national programme known as Integrated Child Development Services) serving more than fifteen children in the same villages where the infants were enrolled. Forty-six anganwadi centres were evaluated; nine did not meet enrolment criteria and we selected twenty-two through a randomisation procedure. Of the 336 eligible children based on age between 29 and 56 months, one refused, nine moved from the community or changed anganwadi centre. Three hundred and twenty-six pre-schoolers (aged 29–56 months) and their mothers were enrolled (Fig. 1) for the pre-school phase.

Fig. 1 Summary of the recruitment process (*employed women; AWC, anganwadi centre)
Infant data (socio-economic, maternal data, dietary diversity, morbidity) were collected through home visits followed by blood collection and anthropometry at a central community site within a time gap of one week. Medical records (mother–child immunisation card) were used to collect birth weight information. For pre-schoolers, all data, including blood samples, were collected at the anganwadi centre.
Socio-economic variables
Family ownership of twenty-seven items such as type of house, water source, type of fuel for cooking, electrification, furniture, vehicle for transport, telephone/mobile, expensive kitchen utensils, etc. were used for calculating the standard of living index (SLI). Weighted scores were based upon the relative significance of ownership of these items. The scores were classified as low (0–14), medium (15–24) and high (≥25) standard of living( 15 ). Details of members in the family including their age, occupation, education and relationship to the primary caregiver were collected using a household roster and family size was obtained from this record.
Anthropometric measurements
Weight and length/height measurements followed a standard protocol( Reference Cogill 16 ). Infants were weighed without diapers, pre-schoolers wore light clothing and mothers wore saris. The mother’s weight was taken with and without the infant using a calibrated digital weighing scale to the nearest 0·1 kg (Seca, Birmingham, UK). The difference was considered as infant weight. Weight of pre-schoolers and their mothers was recorded independently with the same scale. For infants, crown-to-heel length was measured to the nearest 0·1 cm using an infantometer as has been described previously( Reference Cogill 16 ). Both pre-schoolers’ and maternal height was measured using a portable stadiometer to the nearest 0·1 cm (Galaxy Scientific, New Delhi, India). Length/height measurements were conducted twice and repeated, if necessary, until at least two measurements agreed within 0·2 cm. Child weight-for-length/height, weight-for-age and length/height-for-age Z-score values were calculated using the WHO growth standards( 17 ). Stunting (low length/height-for-age), underweight (low weight-for-age) and wasting (low weight-for-length/height) were defined as Z-scores <–2. Maternal BMI was calculated as [weight (kg)]/[height (m)]2.
Dietary diversity
A child dietary diversity score (DDS) was calculated from an FFQ administered for the preceding week( Reference Vazir, Engle and Balakrishna 18 ). The twenty-seven food items were categorised into nine food groups: (i) cereals (one food); (ii) pulses (four foods); (iii) meat and meat products (four foods); (iv) eggs (one food); (v) milk products (two foods); (vi) green leafy vegetables and other vegetables (five foods); (vii) fruits (five foods); (viii) fortified foods and drinks (four foods); and (ix) fats (one food). For the pre-schoolers the DDS included sweet and salty snacks. Each food group was scored as ‘1’ if there was consumption of at least one food item within that food group in the past week and a score of ‘0’ if there was no consumption reported. The scores were averaged to arrive at a total DDS ranging from 0 to 9 for infants and from 0 to 11 for pre-schoolers. Higher scores represented higher dietary diversity and a median split was used to categorise data.
Morbidity
Information on child morbidity was collected through maternal recall of presence/absence of illness symptoms in the past 15 d, including fever, vomiting, diarrhoea and cough accompanied by difficulty in breathing, experienced by the infant or pre-schooler( Reference Vazir, Engle and Balakrishna 18 ).
Household food insecurity
The Household Food Insecurity Access Scale (HFIAS) is a universal measure for the access component of household food insecurity( Reference Coates, Swindale and Bilinsky 19 ). The HFIAS is composed of a set of nine questions that have been used in several countries including India and distinguishes food-insecure from food-secure households. Affirmation of any of the nine questions indicated household food insecurity.
Laboratory analyses
A 2 ml non-fasting blood sample was collected from each infant, pre-schooler and mother between 10.00 and 12.00 hours from the antecubital vein into a heparinised Vacutainer by a trained phlebotomist. For infants and pre-schoolers, a numbing cream containing lidocaine and prilocaine (Neon Laboratories Limited, Mumbai, India) was applied to reduce discomfort. Blood collection from children who had acute morbidity was deferred until recovery. Blood was transported to the laboratory at the National Institute of Nutrition in Hyderabad, India in thermally insulated boxes containing ice packs; plasma was separated and stored in aliquots at −20°C until analysis. The laboratory conducting the assays is under external quality assurance for ferritin and vitamin A estimations (VITAL-EQA programme; Centres for Disease Control and Prevention, Atlanta, GA, USA) and the analysis was carried out by technicians participating in this quality assurance programme.
Hb analysis was done in whole blood, on the same day of blood collection, using a commercial kit (HemoCor-D, Coral Systems; Tulip Group, Alto Santacruz, India). A sandwich ELISA was used to measure serum ferritin concentrations, as previously described( 20 , Reference Pawashe, Raman and Nair 21 ). The method was developed using a polyclonal antiserum raised in New Zealand white rabbit against purified human liver ferritin. A conjugate of the same IgG with horseradish peroxidase was prepared and used as an indicator antibody. The serum ferritin assay was standardised with purified human liver ferritin that was diluted to 1 μg/ml in buffered bovine serum albumin which was calibrated against International Standard 94/572 (National Institute for Biological Standards and Controls, South Mimms, UK). The assay sensitivity was 1 ng/ml and reported recoveries were above 90 %.
Soluble transferrin receptor (sTfR) was analysed using a sandwich ELISA kit with a minimum detectable dose of 0·5 nmol/l (R&D Systems, Inc., Minnesota, MN, USA) and C-reactive protein (CRP) using a human CRP assay kit (Alpha Diagnostic International, San Antonio, TX, USA) with a minimum detectable limit of 10 ng/ml and assay range of 100–10 000 ng/ml.
Folate and vitamin B12 were analysed using a competitive protein-binding dual RIA kit (Siemens Medical Solutions Diagnostics, Los Angeles, CA, USA). The analytical sensitivity was 25·1 pmol/l and 0·68 nmol/l for vitamin B12 and folate, respectively. Plasma Zn was analysed using atomic absorption spectrophotometry (AA7000 series; Shimadzu, Tokyo, Japan) by using flame atomic absorption with fetal bovine serum as external quality control( Reference Perry 22 ). All glass and plastic wares used for analysis of Zn followed standard protocols of washing using ultrapure water (Milli Q, Element; Millipore, Molsheim, France) and air dried. The assay sensitivity for Zn was 0·0153 µmol/l. Folate and vitamin B12 deficiencies were defined as per the kit manufacturer’s protocol as <6·8 nmol/l and <148 pmol/l, respectively( 23 ). The cut-off for Zn deficiency was <10 µmol/l( Reference Brown and Rivera 24 ).
Classification of Fe deficiency
Hb cut-offs of <110 g/l and <120 g/l were used for anaemia among children (infants and pre-schoolers) and mothers, respectively. For mothers who were pregnant (5·3 % among mothers of infants and 8·2 % among mothers of pre-schoolers), a cut-off of <110 g/l was used to define anaemia. For children, the cut-off used to grade severe anaemia was <70 g/l, moderate anaemia was 70–<100 g/l and mild anaemia was 100–<110 g/l( 25 ). A ferritin cut-off of <12 µg/l was used to indicate Fe deficiency( 26 ). The stricter criterion was used due to the additional marker employed, sTfR, which is relatively not affected by inflammation. The present data also showed no significant correlation between sTfR and CRP. CRP higher than 5 mg/l was considered indicative of current inflammation. There was a statistically significant but weak correlation between CRP and ferritin in infants (r=0·130, P=0·003), but not in pre-schoolers. For correction of inflammation-related elevation in ferritin concentrations, a factor of 0·67 was used with a corresponding CRP > 5 mg/l( Reference Thurnham, McCabe and Haldar 27 ).
In the absence of a universally accepted cut-off for sTfR, we plotted the frequency distribution of sTfR values of participants with no anaemia, no Fe deficiency and CRP<5 mg/l and the mean values were obtained and used as the cut-off( Reference Allen, Backstrom and Cooper 28 ). The mean concentrations of plasma folate, vitamin B12 and Zn were above the respective cut-off values in this group. The ferritin concentrations were log transformed and sTfR/log ferritin index (mg/µg) values were computed in the same group as an indicator of Fe stores. Unlike pooled data, the sTfR concentrations in this group followed a normal distribution with mean concentrations of 2·54 (95 % CI 2·43, 2·65) mg/l in infants (n 108) and 2·47 (95 % CI 2·34, 2·60) mg/l in pre-schoolers (n 103). A cut-off of 2·5 mg was established and the mean sTfR/log ferritin index of 1·9 mg/µg was used to categorise Fe deficiency where both biomarkers were not used independently (Table 1).
Table 1 Biomarkers of iron, other micronutrients and CRP among non-anaemic, non-iron-deficient infants (aged 6–12 months) and pre-schoolers (aged 29–56 months) with CRP<5 mg/l for defining cut-off of sTfR, Nalgonda district, Telangana, India
CRP, C-reactive protein; sTfR, soluble transferrin receptor.
Based on the above cut-offs, children with normal concentrations of Hb, ferritin and sTfR were considered as normal. Fe deficiency was defined as low ferritin and/or high sTfR regardless of anaemia status. Hb concentrations ≥110 g/l with either low ferritin or high sTfR or both were considered as Fe deficiency with no anaemia (IDNA). Low Hb and either low ferritin or high sTfR or both were designated as having Fe-deficiency anaemia (IDA). Anaemia without Fe deficiency was defined as having low Hb with normal ferritin and sTfR concentrations.
Statistical analyses
We analysed the factors associated with anaemia in infants and pre-schoolers independently because the two samples differed in recruitment strategy, SLI and maternal education. The ferritin, sTfR and CRP concentrations were not normally distributed and were log transformed before analysis. Clustering effects in pre-school data were adjusted using mixed models for continuous variables and generalised estimating equations for categorical variables. We compared the mean values of micronutrient status among children with moderate, mild and no anaemia using ANOVA and post hoc least significant difference. For risk factors, a multivariate logistic regression model was built using social and biological variables, and odds ratios were calculated. The variables considered were household SLI, food insecurity, family size, maternal BMI, Hb and education; and child’s age, birth weight, history of morbidity, CRP concentration, micronutrient status, stunting/wasting, DDS and sex. The biomarkers of micronutrient status considered were sTfR/log ferritin index and vitamin B12 concentrations. Zn deficiency was not considered in the case of infants and folate deficiency was not considered in either model based on low prevalence of deficiency. Separate models were built for ferritin and sTfR replacing sTfR/log ferritin index. Analyses were conducted using the statistical software package IBM SPSS Statistics version 19·0. P<0·05 was considered statistically significant.
Results
Background characteristics
We restricted our analysis to those with date in Hb, which included 476 infants and 501 mothers; 316 pre-schoolers and 301 mothers. The discrepancies in numbers was due to difficulties encountered during blood collection from infants and some employed mothers being absent during blood collection for pre-schoolers. The sex ratio (female to male) was 0·8 in infants and 1·07 in pre-schoolers. The mean age of infants and pre-schoolers was 9·3 (sd 2·4) months and 37·2 (sd 6·3) months, respectively. Stunting occurred in 19·7 % of infants and 40·5 % of pre-schoolers, wasting in 9·8 % of infants and 19·9 % of pre-schoolers. The prevalence of low birth weight (<2·5 kg) was 16·0 % among infants and 17·9 % among pre-schoolers. An illness symptom in the past 15 d was reported in 48·0 % of infants and 26·8 % of pre-schoolers, with 16·1 % of infants and 10·9 % of pre-schoolers having CRP>5 mg/l. Maternal secondary education (i.e. seventh grade and above) was 75 % in infants and 55 % in pre-schoolers. Prevalence of maternal anaemia was 43·7 % among mothers of infants and 34·2 % among mothers of pre-schoolers. Three-quarters of infant households and 57 % of pre-schooler households had SLI ≥ 25 (Table 2), indicative of a high standard of living. Among infants, 12·2 % of households were food insecure and among pre-schoolers 14·2 % of the households were food insecure.
Table 2 Background characteristics of the participants: infants (aged 6–12 months), pre-schoolers (aged 29–56 months) and their mothers, Nalgonda district, Telangana, India
DDS, dietary diversity score; SLI, standard of living index.
The ‘n’ is after excluding cases with severe anaemia (n 5) for both infants and pre-school children.
* 47·5 % of infants and 88·2 % pre-schoolers consumed fortified foods
† Fever was the most common symptom reported.
‡ Seventh grade and above.
§ Hb<110 g/l for pregnant mothers and Hb<120 g/l for non-pregnant women.
Description of anaemia and micronutrient status
Anaemia was recorded in 66·4 % of infants and 47·8 % of pre-schoolers. Moderate anaemia occurred in 41·2 % of infants and 24·1 % of pre-schoolers. Mild anaemia occurred in approximately 25 % of both groups (Table 3). There were five cases of severe anaemia in infants and five in pre-schoolers and did not form part of the analysis.
Table 3 Percentage of infants (aged 6–12 months) and pre-schoolers (aged 29–56 months) with grades of anaemia and inadequate micronutrient status, Nalgonda district, Telangana, India
sTfR, soluble transferrin receptor.
Children with severe anaemia were excluded from analysis.
Infants suffered from deficiencies of Fe (30·8 % had low ferritin, 69·0 % had high sTfR, 66·4 % had high sTfR/log ferritin index) and vitamin B12 (20·6 %). The deficiencies of Zn and folate were <1 %. In pre-schoolers 44·9 % had low ferritin, 66·9 % had high sTfR, 33·1 % had high sTfR/log ferritin index, 10·7 % had low Zn, 4·1 and 5·4 % suffered inadequacies of vitamin B12 and folate, respectively (Table 3).
Among children with anaemia, 78 % of infants and 88 % of pre-schoolers had concurrent Fe deficiency. Fe deficiency was about 70 % in both groups of children. Fe deficiency without anaemia was found in 22·2 % of infants and 29·8 % of pre-schoolers, IDA in 52·2 % and 42·1 %, respectively. There were 14·2 % cases of IDNA in infants and 5·7 % in pre-schoolers (Fig. 2). The sTfR/log ferritin index for normal children was 1·4 (95 % CI 1·35, 1·51) mg/µg and 1·6 (95 % CI 1·5, 1·6) mg/µg for infants and pre-schoolers, respectively. The corresponding values for IDNA were 2·6 (95 % CI 2·4, 2·8) mg/µg and 3·1 (95 % CI 2·9, 3·4) mg/µg, and for IDA were 3·7 (95 % CI 3·4, 4·0) mg/µg and 4·8 (95 % CI 4·4, 5·1) mg/µg, for infants and pre-schoolers, respectively. In anaemia without Fe deficiency, the ratio was 1·4 (95 % CI 1·35, 1·5) mg/µg and 1·5 (95 % CI 1·3, 1·6) mg/µg, respectively.
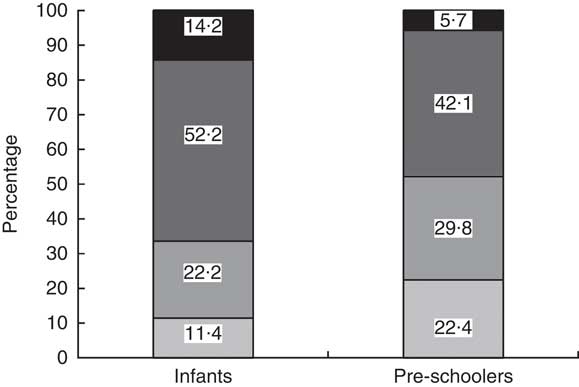
Fig. 2 Classification of iron deficiency among infants (aged 6–12 months) and pre-schoolers (aged 29–56 months), Nalgonda district, Telangana, India. ![]() , Normal (Hb>110 g/l, ferritin >12 µg/l and soluble transferrin receptor (sTfR)<2·5mg/l);
, Normal (Hb>110 g/l, ferritin >12 µg/l and soluble transferrin receptor (sTfR)<2·5mg/l); ![]() , iron deficiency with no anaemia (IDNA; Hb>110 g/l, ferritin<12 µg/l or sTfR>2·5 mg/l or both);
, iron deficiency with no anaemia (IDNA; Hb>110 g/l, ferritin<12 µg/l or sTfR>2·5 mg/l or both); ![]() , iron-deficiency anaemia (IDA; Hb<110 g/l, ferritin<12 µg/l or sTfR>2·5 mg/l or both);
, iron-deficiency anaemia (IDA; Hb<110 g/l, ferritin<12 µg/l or sTfR>2·5 mg/l or both); ![]() , anaemia without iron deficiency (Hb<110 g/l, ferritin >12 µg/l and sTfR<2·5 mg/l)
, anaemia without iron deficiency (Hb<110 g/l, ferritin >12 µg/l and sTfR<2·5 mg/l)
Relationship between grades of anaemia and micronutrient status
Infants with moderate anaemia had lower concentrations of vitamin B12, Zn and ferritin and higher sTfR and sTfR/log ferritin index in comparison to infants without anaemia. Pre-schoolers with moderate anaemia had a similar pattern, with lower concentrations of ferritin and folate, and higher sTfR and sTfR/log ferritin index, in comparison to pre-schoolers without anaemia. In both infants and pre-schoolers, moderate anaemia was associated with lower maternal Hb, in comparison to children without anaemia (Table 4).
Table 4 Mean values of biomarkers of micronutrient status in infants (aged 6–12 months) and pre-schoolers (aged 29–56 months) with mild, moderate and no anaemia, Nalgonda district, Telangana, India
sTfR, soluble transferrin receptor; moderate anaemia, Hb=70–100 g/l; mild anaemia, Hb=100–<110 g/l; no anaemia, Hb>110 g/l.
Mean values of micronutrients were compared along the column between the different stages of anaemia using ANOVA and post hoc least significant difference. Mixed models were used for analysis of pre-school data considering clustering effects.
a,b,cMean values within a column with unlike superscript letters were significantly different (P<0·05).
* Log transformed before analysis.
Infants with mild anaemia had lower concentrations of vitamin B12 than infants with no anaemia. Pre-schoolers with mild anaemia had higher sTfR and sTfR/log ferritin index and lower folate concentrations than pre-schoolers with no anaemia. In both infants and pre-schoolers, mild anaemia was associated with lower maternal Hb in comparison to children without anaemia. The mean concentrations of micronutrients and maternal Hb were not significantly different among children with mild and moderate anaemia except for a higher sTfR and sTfR/log ferritin index in moderate anaemia among both infants and pre-schoolers (Table 4).
Logistic regression analyses of factors associated with anaemia
Infants were more likely to have anaemia if they had high sTfR/log ferritin index or their mothers had anaemia. Pre-schoolers were more likely to have anaemia if they were younger, had elevated CRP or elevated sTfR/log ferritin index or if their mothers had anaemia. We also observed a trend (P=0·095) in DDS of ≤3 among anaemic infants (Table 5). Among the food groups, fortified foods alone showed an association with anaemia among infants (62·1 % anaemia in infants who received fortified foods compared with 70·0 % anaemia in infants who did not receive fortified foods, P=0·039). A trend was also observed with respect to low birth weight (P=0·068) among pre-schoolers. Ferritin tested separately in the same model showed significant risk among infants and pre-schoolers, while for sTfR the odds ratios were significant only for pre-schoolers.
Table 5 Factors associated with anaemia among infants (aged 6–12 months) and pre-schoolers (aged 29–56 months), Nalgonda district, Telangana, India
CRP, C-reactive protein; sTfR, soluble transferrin receptor; WAZ, weight-for-age Z-score; HAZ, length/height-for-age Z-score; DDS, dietary diversity score; SLI, standard of living index.
* In model 2, sTfR/log ferritin replaced with ferritin.
† In model 1, sTfR/log ferritin replaced with sTfR.
‡ Low prevalence of plasma Zn<10·0 µmol/l to include in the model to compute OR for infants.
§ ≤3/≤7 for infants and pre-schoolers, respectively. The results are based on logistic regression analysis. The analysis for pre-schoolers considered the cluster design.
|| Hb cut-off of 110 g/l for pregnant women.
Discussion
The current comprehensive study involving several biological and social variables characterised anaemia and the factors associated with anaemia among infants and pre-schoolers in rural India. Anaemia continues to be a significant public health issue among young children in this setting. In addition to the child’s Fe status and maternal anaemia, which were significantly associated with anaemia in infants and pre-schoolers, inflammation and younger age of the child were significantly associated with anaemia in pre-schoolers.
Rates of undernutrition among pre-schoolers were comparable with the national average for children <5 years of 48 % stunting, 20 % wasting and 43 % underweight( 12 ). However, among infants, the prevalence rates appeared to be lower. The low rates of stunting may be due to the age-dependent sharp increase in stunting from 6 months onwards, peaking at 20 months and plateauing thereafter, as demonstrated in the same national survey. The lower prevalence of undernutrition may also be a reflection of comparatively higher household SLI and maternal education among infants in the present study.
We found that two-thirds of the infants and almost one-half of the pre-schoolers had anaemia, with a moderate anaemia prevalence of 41 % and 24 % in infants and pre-schoolers, respectively. These rates are consistent with national rates of anaemia among infants and pre-schoolers( Reference Stevens, Finucane and De-Regil 1 , 12 ) and with the prevalence of moderate anaemia (>50 %) in children less than 3 years old in other states of India( Reference Bharati, Pal and Chakrabarty 29 ). Although programmes to control anaemia in low- and middle-income countries mostly concentrate on Fe deficiency as the major cause, in the presence of inflammation, defining Fe deficiency is difficult and therefore we used ferritin and sTfR along with CRP( Reference Pasricha, Drakesmith and Black 10 , Reference Lutter 30 ). Serum ferritin reflects the storage Fe compartment and sTfR reflects the functional Fe compartment. Conceptually, sTfR/log ferritin ratio unifies the spectrum of deficiency and therefore is more attractive and useful in defining Fe deficiency( Reference Punnonen, Irjala and Rajamäki 31 ). Additionally it is difficult to characterise Fe deficiency in infants and pre-schoolers in settings where the target group suffers from widespread anaemia, with meagre opportunity for establishing adequate Fe stores and has a background of inflammation. Using receiver-operating characteristic curve analysis the sTfR/log ferritin index has shown to have excellent sensitivity and specificity in reflecting Fe depletion( Reference Punnonen, Irjala and Rajamäki 31 ). One meta-analysis also greatly supports this conclusion( Reference Infusino, Braga and Dolci 32 ). Therefore we used this index to draw conclusions.
Since information was not available on the sTfR cut-off and the sTfR/log ferritin index in this age group, we derived a cut-off value based on sTfR concentrations of non-anaemic, non-Fe-deficient children devoid of elevated CRP( Reference Suominen, Punnonen and Rajamäki 33 ). The distribution of sTfR in these children followed a normal distribution unlike in the total sample and therefore we used mean values of 2·5 mg/l for sTfR and 1·9 mg/µg for sTfR/log ferritin index value for categorisation of deficient v. sufficient Fe stores. The derived cut-off of sTfR is in concordance with the reported cut-off value of 2·5 mg/l for adults( Reference Koulaozidis, Said and Cottier 34 ) while the sTfR/log ferritin index was close (1·8 mg/µg) to that of adults( Reference Suominen, Punnonen and Rajamäki 33 ) and varied according to the classification of Fe deficiency. Accordingly, 66 % of infants and 33 % of pre-schoolers had deficient Fe stores. These findings compare with the high prevalence of Fe deficiency (62 %) reported in 12–23-month-old children from Bangalore, India( Reference Pasricha, Black and Muthayya 13 ). In the present study, the logistic regression models also confirmed that Fe deficiency is the major contributor of anaemia in this setting as evidenced by a higher odds of anaemia in Fe deficiency in both infants (two times) and pre-schoolers (five times). The situation appears to be different with respect to sub-Saharan Africa, where anaemia of inflammation can be as important or more important than IDA( Reference Asobayire, Adou and Davidson 35 ).
Maternal anaemia was also found to be strongly associated with anaemia in both infants and pre-schoolers. Globally, more than one-third of pregnant women suffer from anaemia( Reference Stevens, Finucane and De-Regil 1 ). Cross-sectional studies have reported associations of maternal anaemia with prematurity and low birth weight, lower socio-economic status, low breast milk nutrient content, inappropriate complementary feeding and low maternal nutritional knowledge( Reference Pasricha, Black and Muthayya 13 , Reference Ohlund, Lind and Hörnell 36 ). The prospect of protecting infant and young child health through targeting maternal anaemia during pregnancy has been suggested( Reference Bhutta, Das and Rizvi 37 ). The implications for child health and development with respect to an anaemic caregiver have also been recognised( Reference Armony-Sivan, Kaplan-Estrin and Jacobson 38 ). Therefore, prevention strategies should target adolescent girls and women of reproductive age to eliminate or reduce the burden of anaemia before entering into the higher nutritional demands of pregnancy( Reference Paul, Sachdev and Mavalankar 39 – Reference Mason, Shrimpton and Saldanha 41 ). A continuum in interventions is required during the reproductive period for the benefit to reach the offspring.
In this context, tackling anaemia through a life cycle approach, as recently introduced in India( 42 ), is supported by our findings. Multiple micronutrients with an emphasis on those which help in absorption and or mobilisation of Fe for Hb regeneration could be of better impact than Fe and folic acid alone. In view of the general lack of dietary diversity in the target group, point-of-use fortification with multiple micronutrients appears to be an attractive option. Systematic reviews have shown that home fortification of foods with multiple micronutrient powders is an effective intervention to reduce anaemia and Fe deficiency in children aged 6–23 months, with results comparable to the benefits of a daily Fe supplementation programme( Reference De-Regil, Suchdev and Vist 43 ). Activities to improve food security and dietary diversity are complementary to provision of Fe, although they may be longer-term strategies. Currently, global nutrition efforts have a strong focus on the first 1000 d of life, and while this is a critical period for growth and development( Reference Paul, Sachdev and Mavalankar 39 ), our findings also highlight that malnutrition continues to be a major issue in the pre-school years in this setting. Because anaemia and Fe deficiency are related to cognitive and socio-emotional development and learning ability beyond infancy, it is essential that control strategies also include the pre-school years.
Risks of anaemia are a complex interplay of political, ecological, social and biological factors, and not just Fe status. We found an increased risk of anaemia with CRP in pre-schoolers. A similar association was observed elsewhere in India( Reference Pasricha, Black and Muthayya 13 ). About 6–14 % of anaemia in this group was not associated with Fe status. It appears that inflammation is a significant factor for anaemia in pre-schoolers. However, in spite of higher prevalence of illness symptoms and higher CRP concentrations, this association was not observed in infants. The absence of a relationship with inflammation in infants may be due to a very high prevalence of IDA, thereby masking the association with inflammation. Inflammation-associated anaemia is generally due to the known pathway of hepcidin-induced regulation of Fe homoeostasis, preventing the entry of Fe into systemic circulation, creating a pseudo deficiency situation( Reference Hentze, Muckenthaler and Galy 44 ). In the presence of inflammation coexistent with Fe deficiency, approaches targeting the root cause of inflammation also need to be identified and addressed.
The association between age and anaemia in pre-schoolers shows a decreasing severity of anaemia with higher age category. Risk factors such as low birth weight and dietary diversity showed a trend in these children. Food insecurity was not a significant factor associated with anaemia as the majority of households were food secure. The interdependence of variables studied could be one of the reasons for not observing them as risk factors for anaemia in the present study. A significant association has been shown elsewhere with respect to low birth weight, infection( Reference Eneroth, Persson and El Arifeen 45 ), stunting, family income, maternal education( Reference Zhao, Zhang and Peng 46 ), exclusive breast-feeding( Reference Meinzen-Derr, Guerrero and Altaye 47 ) and Hb at 6 months( Reference Lozoff, Kaciroti and Walter 48 ). In addition to these, factors such as more siblings, crowded living conditions, inappropriate complementary food introduction( Reference Yang, Li and Li 49 ), poorer sanitary conditions and being male have also been associated with anaemia( Reference Leite, Cardoso and Coimbra 50 ). Studies conducted in Bangalore, India have also shown factors such as Fe deficiency, maternal anaemia, sex, food insecurity and age to be associated with anaemia( Reference Pasricha, Black and Muthayya 13 ).
Serum Zn indicated an adequate status which has limitations of having collected non-fasting blood samples from infants and pre-schoolers. However, there was an association with moderate anaemia in infants, suggesting a role of Zn deficiency in these children. Inadequacy of vitamin B12 was about 20 %. Although not associated with anaemia in the model, the mean values of vitamin B12 were significantly lower in infants with anaemia. Therefore the influence of multiple micronutrient deficiencies of vitamin B12 and Zn could not be ruled out.
The major strength of our study is the simultaneous measurement of several social and biological variables including sTfR/log ferritin ratio. Knowing the factors associated with anaemia in a population should be informative to policy makers and those designing intervention studies. However, factors such as haemoglobinopathies and the roles of vitamin A deficiency and hookworm infestation were not studied. Due to logistic difficulties and budgetary constraints we could not assess factors such as haemoglobinopathies, vitamin A status and hookworm infestation, although they may also contribute to anaemia. However, at national level, India has a deworming programme and massive dose of vitamin A programme. Haemoglobinopathies are not known to be prevalent in this area and may not contribute significantly to anaemia in this region.
Conclusion
Anaemia prevalence was high among infants and pre-schoolers from rural India, indicating a problem of severe public health significance with Fe deficiency as the major contributor. The roles of maternal anaemia and inflammation, in addition to that of Fe, in anaemia among infants and pre-schoolers are highlighted.
Acknowledgements
Acknowledgements: The authors acknowledge the initial conceptualisation and contributions of Dr Shahnaz Vazir PhD, Former Deputy Director and Emeritus Scientist, National Institute of Nutrition (ICMR) and Dr B. Sesikeran MD, Former Director, National Institute of Nutrition (ICMR). They also acknowledge Mr K. Narasimha Reddy BSc, Technical Assistant, National Institute of Nutrition for assistance in collection of anthropometry data. Financial support: This work was supported by the Micronutrient Initiative, Ottawa, Canada and the Mathile Institute for the Advancement of Human Nutrition, Dayton, OH, USA. Conflict of interest: None declared. K.B.H. and G.R. are employees of the Micronutrient Initiative and the Mathile Institute for the Advancement of Human Nutrition, respectively. Authorship: M.M.B., K.M.N., S.F.-R., N.B., K.V.R. and K.M.H. conceptualised the study; S.F.-R., P.R. and N.T. acquired data; K.M.N. and L.A. drafted the manuscript; all authors have contributed to analysis and interpretation of data, critically reviewed the manuscript, read and approved the final manuscript. Ethics of human subject participation: This study was conducted according to the guidelines laid down in the Declaration of Helsinki and all the procedures and protocols were approved by the institutional review boards of the National Institute of Nutrition, Hyderabad, India and the University of Maryland, Baltimore, USA. Written informed consent was obtained from mothers of all participants.


