


Temporal patterns of eating have been identified as a novel risk factor for CVD( Reference St-Onge, Ard and Baskin 1 ). Meal frequency and timing and the temporal distribution of energy intake have been associated with adiposity, obesity, and metabolic regulations such as changes in blood pressure, insulin resistance and lipid profiles( Reference St-Onge, Ard and Baskin 1 , Reference Ekmekcioglu and Touitou 2 ). For instance, a randomized controlled trial in Japan found that greater energy intake in the evening or night-time snacking may lead to elevated LDL cholesterol( Reference Hibi, Masumoto and Naito 3 ). A cohort study in the UK suggested a relationship between fat intake in the evening and a higher incidence of high blood pressure( Reference Almoosawi, Prynne and Hardy 4 ). In addition, hard outcomes such as type 2 diabetes and cardiovascular mortality were associated with a lower meal frequency in prospective studies( Reference Chen, Wang and Cheskin 5 , Reference Mekary, Giovannucci and Willett 6 ). Misalignment between the timing of nutrient intake and the circadian rhythm may be the core mechanism of the health impact of temporal patterns of eating( Reference Johnston 7 ).
For adults, employment status is a fundamental factor that influences people’s dietary quality and nutritional status( Reference Ali and Lindstrom 8 – Reference Vernay, Malon and Oleko 11 ). Work hours constrain a worker’s daily routine, subsequently shaping a person’s meal habits such as timing/skipping of meals and snacks( Reference Smith, McNaughton and Cleland 12 , Reference Suzuki, Sakurazawa and Fujita 13 ). Meals such as breakfast, night eating and snacks have been associated with dietary quality( Reference Barnes, French and Harnack 14 – Reference Purslow, Sandhu and Forouhi 19 ). However, work-related time constraints should affect the timing of multiple eating occasions of the day. Thus, focusing on a single meal or a certain eating occasion would lose sight of the temporal patterns of eating, as was done in most of the previous studies that attempted to examine the health and/or dietary effects of a single meal( Reference Bi, Gan and Yang 20 – Reference O’Neil, Byrd-Bredbenner and Hayes 22 ). To identify the temporal patterns of eating in a free-living population would be the first step towards knowing the relationship between meal time and health impact.
However, temporal patterns of eating are complex and have multiple dimensions: meal frequency, meal timing, regularity, and the dietary composition of meals and snacks( Reference Leech, Worsley and Timperio 23 ). Dimension-reduction methods are common tools for researchers to mine the hidden pattern factors that are highly interrelated with certain unknown correlation structures, and therefore are usually used for dietary pattern research( Reference Hu 24 ). Recent studies have applied latent class analysis and dynamic clustering analysis to identify the patterns of times when eating episodes occur in a day( Reference Leech, Worsley and Timperio 23 , Reference Eicher-Miller, Khanna and Boushey 25 ). The study in Australia discovered the usual patterns of meals and snack times. Three patterns called ‘conventional’, ‘late lunch’ and ‘grazing’ were identified, but these patterns were based on the timing of eating occasions without considering the energy intake amounts( Reference Leech, Worsley and Timperio 23 ). The other study in the USA accounted for energy, but the whole picture of the temporal distribution of energy intake was unavailable( Reference Eicher-Miller, Khanna and Boushey 25 ). Moreover, little is known about the temporal patterns of eating in Asian populations, especially as working hours are notoriously long in East Asian countries( Reference Lee, McCann and Messenger 26 , Reference Tsai, Nitta and Kim 27 ). The present study aimed to identify adults’ major temporal patterns of energy intake based on the ‘timed’ 24 h dietary recall data in the Nutrition and Health Survey in Taiwan (NAHSIT), 2005–2008. Furthermore, we examined the association between employment status and temporal patterns of energy intake and investigated whether dietary quality in terms of nutrient densities varied by temporal patterns of energy intake.
Methods
Study population
NAHSIT is a representative survey of the Taiwanese non-institutionalized and non-pregnant population that aimed to monitor the nutritional status and health of the population. To obtain representative estimates through a feasible survey method, the survey adopted a multistage, clustered and stratified complex sampling scheme with a probability proportional to size procedure. The survey of years 2005–2008 interviewed 6189 participants of all ages and the response rate was 65 % (6189 respondents out of 9570 sampled subjects)( Reference Tu, Chen and Hsieh 28 , Reference Pan and Tu 29 ).
Dietary assessment
A one-day 24 h dietary recall was used to assess the participants’ food intake of the previous day( Reference Pan, Wu and Yeh 30 ). The recall consisted of multiple passes: (i) the respondent recalled all dishes eaten and the time of eating in the past 24 h from the interview; (ii) the respondent was asked to think about easily forgotten foods and beverages such as dietary supplements and alcohol; (iii) the respondent recalled the ingredients and quantities of food consumption; and (iv) the interviewer reviewed the records with the interviewee. Trained interviewers conducted the computer-assisted personal interview recall. Food models, tableware models and pictures of common packages of beverages were used to assist the respondent in remembering the volume of food intake. Food items recorded in the dietary recall were then converted to nutrients based on the food composition tables( Reference Wu, Pan and Yeh 31 ). Participants whose dietary recall had extreme values of energy intake were excluded; thus, the final analysis included adults (aged 19 years or older) whose total energy intake ranged from 2092 to 20 920 kJ/d (500 to 5000 kcal/d; n 4508), a range commonly applied in observational studies to exclude extreme values of energy intake( Reference Bruening, van Woerden and Todd 32 – Reference Zhang, Gillespie and Welsh 34 ).
The recall recorded the participants’ time of eating the reported foods, and we used this information to determine the participants’ meal times. The term ‘meal time’ refers to the time of any eating occasion during the day. The recall did not record the meal type associated with the time of food consumption, and thus the time of eating traditional meals such as breakfast, lunch or dinner was unknown. We divided a day into six intervals of 4 h: 05.00–08.59 hours, 09.00–12.59 hours, 13.00–16.59 hours, 17.00–20.59 hours, 22.00–00.59 hours and 01.00–04.59 hours. The time intervals applied were based on a previously published study by de Castro( Reference de Castro 35 ) and these time intervals overlap with the general population’s usual meal times. Participants’ recalled food intakes were grouped into these six time intervals. The energy intake levels of the six time intervals were then calculated.
Employment status assessment
The independent variable of interest was employment status. This was based on the participants’ self-report on a question of employment status. The question contained the following responses: full-time job, part-time job, self-employed, no stable job, unemployed, no job due to disease, never worked, students, housekeeping and retired. We then categorized these into six groups: full-time (full-time and self-employed), part-time (part-time and no stable job), no job (unemployed, no job due to disease, never worked), student, homemaker and retired.
Covariates
The participants’ sex, age, education level and health status were collected in the interview. Their residence was categorized into eight strata based on the counties’ urbanization level, geography and ethnicity distribution (e.g. mountainous area, islands, Hakka–dense townships, East coast). Disease history was an indicator variable of being diagnosed with chronic disease(s) that could affect one’s diet: hypertension, dyslipidaemia, diabetes, renal disease, heart disease, stroke, fatty liver, gout, peptic ulcer disease or cancer. In addition, since diet could vary between the weekdays and weekend, we further consider the day of dietary recall (weekday v. weekend) as a covariate. Income was not considered because: (i) income is conceptually a mediator between employment status and temporal patterns of eating; and (ii) 32 % of self-reported income data was missing. Interview dates were categorized into the following seasons: March–May, June–August, September–November and December–February.
Temporal pattern identification
People who had a similar distribution of energy intake over six time periods of a day were considered to have a similar temporal pattern( Reference Hu 24 , Reference Mooi and Sarstedt 36 ). The pattern categories of the study population were identified based on the similarity of the energy intake levels of the six 4 h intervals. Every participant’s energy intakes of the six time periods can be expressed as a six-element vector. To prevent a right-skewed distribution of energy intake, we used log-scale energy intake of every time interval for cluster analysis, while the energy intake of 0 was replaced with 1 so that the log scale can be 0. Hierarchical clustering analysis was used and the Euclidean distance method was used to characterize the closeness among the observations in the six-dimensional data space. The clustering among the observations was then determined using Ward’s method. Five temporal patterns of energy intake in the study population were decided upon because: (i) the five clusters explained 55 % of data variation; (ii) including one more (the sixth) cluster additionally explained only 0·5 % of data variation; and (iii) the six clusters increased the complexity of pattern interpretation and reduced the sample size of every cluster. To confirm the result of cluster categorization, the whole data were split into two data sets and the same five-cluster patterns were reproduced. Then, we examined the average energy intake level at every time period of the day to describe and interpret the five temporal patterns of energy intake.
Statistical analysis
Descriptive statistics were used to describe the differences and ANOVA and χ 2 tests were used to test the differences in basic characteristics among people of the five temporal patterns of energy intake. To examine whether people of different employment statuses had different probabilities of the five patterns, we applied multinomial logit models to estimate the conditional predicted probabilities of the five temporal patterns for every employment status group with adjustments for age, sex, education level, geographic residence and weekday/weekend. Finally, we applied general linear regression models to estimate the adjusted mean nutrient densities, which were expressed as nutrient amount per 4184 kJ (1000 kcal) of total energy intake. The models for estimating nutrient densities were adjusted for age, sex, employment status, education level, geographic residence and weekday/weekend. All statistical analyses were conducted using the statistical software package SUDAAN version 11 (2012) to account for the sampling weight and design effect.
Results
We identified five major temporal patterns of energy intake: 30·7 % of adults had the traditional meal pattern (T), 17·6 % had the traditional meal pattern plus afternoon eating (TA), 15·6 % had the traditional meal pattern plus afternoon and night eating (TAN), 25·6 % had a delayed morning meal pattern (DM) and 10·5 % had a delayed lunchtime pattern (DL; Fig. 1). The mean (95 % CI) total energy intake of patterns T, TA, TAN, DM and DL were, respectively: 7393 (7037, 7749) kJ (1767 (1682, 1852) kcal); 8598 (7950, 9242) kJ (2055 (1900, 2209) kcal); 8816 (8222, 9410) kJ (2107 (1965, 2249) kcal); 8297 (8037, 8556) kJ (1983 (1921, 2045) kcal); and 7096 (6544, 7653) kJ (1696 (1564, 1829) kcal). Pattern T was characterized by large energy intakes in the periods 05.00–08.59, 09.00–12.59 and 17.00–20.59 hours, which are the traditional times for serving breakfast, lunch and dinner. Meanwhile, energy intakes in the off-time meals were close to zero for pattern T. The energy intake distribution of pattern TA was similar to that of pattern T, while the difference between the two patterns was the extra energy intake in the afternoon (13.00–16.59 hours) for the former. Pattern TAN had energy intakes in the three traditional meal times plus afternoon and night (22.00–00.59 hours); thus this pattern had the highest whole-day energy intake among the five patterns. Pattern DM had a low energy intake in the morning (05.00–08.59 hours) and high energy intakes at noon and afternoon periods. Pattern DL was characterized by a very low energy intake at 09.00–12.59 hours, followed by great amounts of energy intake during the afternoon and the evening.
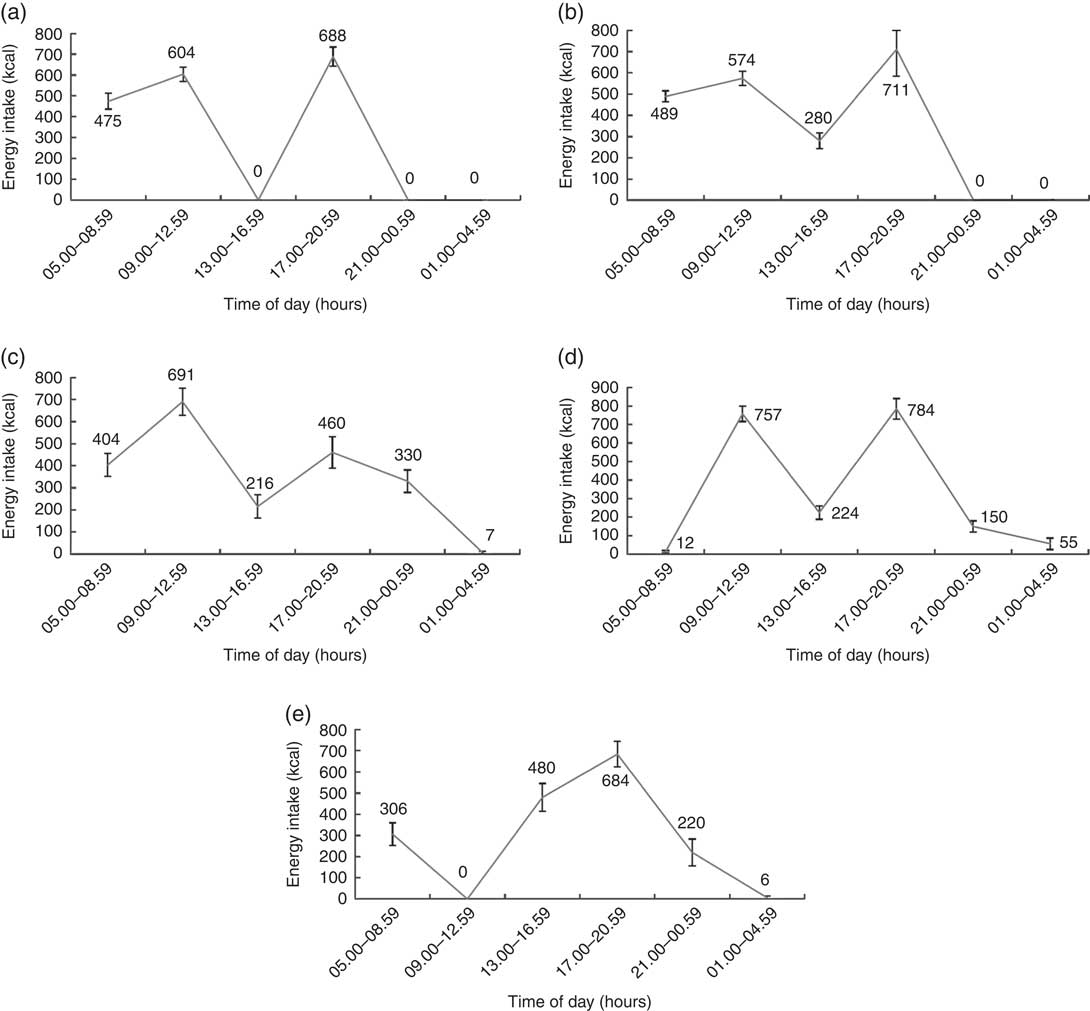
Fig. 1 Distribution of energy intake at six time periods of the day by temporal pattern of energy intake among non-institutionalized, non-pregnant, community-dwelling adults (n 4508) aged ≥19 years, Nutrition and Health Survey in Taiwan, 2005–2008: (a) traditional meal pattern (T; n 1384, 20·3 %*); (b) traditional meal pattern plus afternoon eating (TA; n 795, 14·3 %*); (c) traditional meal pattern plus afternoon and night eating (TAN; n 704, 17·7 %*); (d) delayed morning meal pattern (DM; n 1154, 33·0 %*); (e) delayed lunchtime pattern (DL; n 471, 14·5 %*). Value labels near the line present the mean energy intake of the period (with its 95 % CI represented by a vertical bar) in kilocalories; to convert to kilojoules, multiply by 4·184. *Weighted percentage
As Table 1 shows, men were more likely to have patterns TAN and DL than women, and women were more likely to have pattern TA than men. Younger adults were more likely to have patterns DM and DL and less likely to have patterns T and TA than the older groups. The distribution of education level by the five temporal patterns of energy intake may reflect the age distributions since older birth cohorts had, in general, fewer years of education than the younger cohort in Taiwan. Adults who reported a history of chronic disease(s) were more likely to have patterns T and TA and less likely to have patterns DM and DL than adults who did not have a disease. Nevertheless, we did not find significant weekday/weekend differences or seasonal variations in the five temporal patterns of energy intake.
Table 1 Basic characteristics of the participants by temporal pattern of energy intake; non-institutionalized, non-pregnant, community-dwelling adults (n 4508) aged ≥19 years, Nutrition and Health Survey in Taiwan, 2005–2008
* T, traditional meal pattern; TA, traditional meal pattern plus afternoon eating; TAN, traditional meal pattern plus afternoon and night eating; DM, delayed morning meal pattern; DL, delayed lunchtime pattern.
† Weighted statistics.
‡ From χ 2 test.
Regarding employment status, after adjusting for sex, age, education level, history of chronic diseases, geography and weekday/weekend, we estimated the adjusted proportions of the temporal patterns for the employment status groups (Table 2). This showed that 22·4 % of the employed group, 19·9 % of homemakers, 19·2 % of the retired group and only 4·0 % of students had pattern T. The proportion having pattern T in students was significantly lower than that in other employment statuses. At the same time, 33·3 % of students, 23·6 % of part-time employees, 12·0 % of full-time employees, 10·5 % of homemakers and 8·3 % of the retired population had the DL pattern. Sensitivity analyses were done on the following subgroups: women, adults ≥45 years old and young adults (19–30 years old). In general, the distribution of the temporal patterns of energy intake by employment status were similar to those found in the whole group analysis (see online supplementary material).
Table 2 Adjusted distributionFootnote * of the five temporal patterns of energy intakeFootnote † by employment status among non-institutionalized, non-pregnant, community-dwelling adults (n 4508) aged ≥19 years, Nutrition and Health Survey in Taiwan, 2005–2008
A,B,C,D,E,FSuperscript letters (A=full-time job; B=part-time job; C=unemployed; D=student; E=retired; F=homemaker) indicate the groups that had a significantly different proportion of the temporal energy intake pattern compared with this employment status group. For example, 22·37 % of full-time employees had pattern T, and the D superscript indicates 22·37 % was significantly different from the proportion of students having pattern T. The α level for pairwise comparisons was set at 0·0033 to address the multiple comparisons.
* Adjusted for sex, age, education level, chronic disease, geography and weekday of dietary recall. The model took the sampling weight and study design into account.
† T, traditional meal pattern; TA, traditional meal pattern plus afternoon eating; TAN, traditional meal pattern plus afternoon and night eating; DM, delayed morning meal pattern; DL, delayed lunchtime pattern.
After adjusting for the energy intake level, nutrient density levels also differed by temporal patterns of energy intake (Table 3). Pattern T had the highest intakes of protein, PUFA, Ca, P, vitamin D and vitamin E, and the lowest carbohydrate intake compared with the other temporal patterns. Pattern TA had the highest carbohydrate and the lowest Mg intakes among the five temporal patterns of energy intake. Pattern DL had the lowest nutrient density, including protein, PUFA, dietary fibre, Ca, P, vitamin D and vitamin E. These comparisons were based on models that were adjusted for covariates including age, sex, education level, employment status, history of chronic diseases, geography and weekday of the dietary recall.
Table 3 AdjustedFootnote * mean nutrient densities of the five temporal patterns of energy intakeFootnote † among non-institutionalized, non-pregnant, community-dwelling adults (n 4508) aged ≥19 years, Nutrition and Health Survey in Taiwan, 2005–2008
A,B,C,D,ESuperscript letters (A=pattern T; B=pattern TA; C=pattern TAN; D=pattern DM; E=pattern DL) indicate the temporal energy intake pattern groups that had a significantly different density of this nutrient compared with this temporal energy intake pattern. For example, the protein nutrient density of pattern T was 44·0 g/4184 kJ, and the E superscript indicates 44·0 g/4184 kJ was significantly different from the protein nutrient density of pattern DL. The α level for pairwise comparisons was set at 0·0033 to address the Bonferroni multiple comparisons.
* Adjusted for sex, age, education level, employment status, chronic disease, geography, and weekday of dietary recall.
† T, traditional meal pattern; TA, traditional meal pattern plus afternoon eating; TAN, traditional meal pattern plus afternoon and night eating; DM, delayed morning meal pattern; DL, delayed lunchtime pattern.
‡P value from ANOVA testing for between-group differences.
§ 4184 kJ=1000 kcal.
Discussion
Based on 24 h dietary recall, we identified five major temporal patterns of energy intake in Taiwan adults and found that the patterns varied with employment status in this economically developed society. These patterns can be categorized as different variants of pattern T with varying levels of nutrient quality. In general, the nutrient density, including that of protein, PUFA, fibre, Ca, P, vitamins D and E, was higher for pattern T than for pattern DL. Approximately 20 % of adults had pattern T and 14 % had pattern DL. The most prevalent temporal pattern of energy intake was pattern DM (33 %), which had lower nutrient densities of Ca and P than pattern T.
‘Time to eat’ is embedded in the daily schedule, which is highly determined by employment status. Greater tendency to have traditional meal times in full-time employees was probably due to the time frame of daily work-related activities. For other employment statuses, off-time meals were more likely to happen. A study on Northern European populations found that students were more likely to have a daily rhythm of eating that was ‘unsynchronized’ with the conventional meal times of the general population( Reference Lund and Gronow 37 ). A survey of college students in the USA showed 54 % of students snacking in the afternoon and 73 % snacking at night( Reference Driskell, Kim and Goebel 38 ). In Taiwan, we found that full-time students were also the least likely to follow traditional meal times and, on the contrary, were most likely to have a delayed lunchtime compared with other employment statuses. The differences between employment statuses were more obvious for the 19- to 30-year-old group, suggesting that employment status could be an important determinant for young adults to maintain a structured and regular meal pattern and pinpointing college youths’ unconventional meal times.
However, the situation may be opposite for the middle-aged and older adults. A survey of German adults aged 45–75 years found that the employed group was more likely to have irregular meal times than those who did not work, and longer working hours were associated with greater odds of having irregular meal times( Reference Muff, Reinhardt and Erbel 39 ). This is similar to our findings in subgroup analysis for older adults (≥45 years old). Moreover, the prevalence of pattern DL appeared to be higher in those who had a job than in those who did not work. These findings imply that work–life time conflict could be critical to the middle-aged population’s meal times. On the other hand, among the older adults who did not work, the no job group was, in fact, more likely to delay their morning meals, suggesting a tendency to skip breakfast compared with the other groups. The higher tendency for the no job group to skip a morning meal might reflect a lower food security( Reference Chun, Ryu and Park 40 ) or a lower appetite in the morning due to night eating that was associated with unemployment-related stress in other studies( Reference Allison, Lundgren and O’Reardon 41 , Reference Andersen, Stunkard and Sorensen 42 ).
The five temporal patterns of energy intake had different nutrient quality patterns. Especially, the two off-time patterns (DM and DL) we found in the present study had significantly lower nutrient densities than the T pattern. The DM pattern may imply breakfast skipping, which would be followed by more food intake in the subsequent snack or meal times. Eating a morning meal was associated with a lower subsequent energy intake in the afternoon and evening, but it is still controversial whether breakfast skipping might thus lower the total energy intake of the whole day( Reference Purslow, Sandhu and Forouhi 19 , Reference Levitsky and Pacanowski 43 ). Additionally, foods chosen for breakfast may differ from foods chosen for later meals( Reference Birch, Billman and Richards 44 ). People tend to eat wholegrain foods, fruit and vegetables for breakfast( Reference Kant and Graubard 15 ), and therefore breakfast eaters have higher fibre intake than breakfast skippers( Reference Myhre, Loken and Wandel 17 , Reference Pereira, Erickson and McKee 18 ). In the present study, the DM pattern had lower Ca, P and Mg intakes than the T pattern. This is similar to the findings of other studies where more frequent breakfast was associated with higher dairy and Ca intakes( Reference Lai 45 , Reference Lee and Reicks 46 ). The other off-time meal pattern was the DL pattern, which was found to have the worst nutrient quality compared with other temporal patterns of energy intake in Taiwan. This may be associated with the larger amounts of snacks in the afternoon and the evening. A study on Korean workers found that meal skippers were more likely to eat many snacks( Reference Kim and Kim 16 ). The time of day when foods are consumed may also influence overall nutrient intake; people tend to consume greater amounts of energy during eating occasions at later times of the day( Reference de Castro 35 ). In addition, snacking may also play a role: people tend to snack in the afternoon and the evening, and they are less likely to choose fruits at snack times( Reference Cross, Babicz and Cushman 47 ). Since snacks are usually carbohydrate-dense and result in a greater total energy intake( Reference Bellisle, Dalix and Mennen 48 , Reference Chapelot 49 ), snacking more in the afternoon and the evening is associated with higher empty calories and lowers nutrient density. As the literature suggests, eating desserts and sweetened beverages for snacks would lower the dietary quality( Reference Barnes, French and Harnack 14 ).
Strengths and limitations
The present study was based on a representative sample of Taiwanese adults and the results may reflect what occurred in Taiwan. Moreover, the cluster analysis identified common temporal patterns of energy intake based on six 4 h intervals of a day, rather than based on the self-reported meal types. This approach can prevent cultural or habitual influences on the self-identified meal types and focus on the temporal distribution of energy intake throughout the day( Reference Eicher-Miller, Khanna and Boushey 25 ). Nevertheless, there are several limitations to be considered before making conclusions. First, the dietary intake was based on a one-day recall. The one-day snapshot may not represent a person’s usual dietary intake, but a group’s one-day dietary information may reveal the group’s common dietary conditions. Thus, the results of the study should be interpreted at the population level. Nevertheless, if multiple days of recall could be collected, it would be possible to examine whether the temporal patterns of energy intake vary between days and to explore the determinants. Second, the employment status was based on individuals’ self-report. Since the self-report error in employment status should be unrelated to the dependent variables, the temporal patterns of energy intake and nutrient quality, the impact of the self-report error would attenuate the association between employment status and temporal patterns of energy intake. Since there was no information for the work time schedule, we could not examine the influence of work shifts on temporal patterns of energy intake. The results based on the sample that pooled shift workers and others together may underestimate the probability of the off-time patterns in the employed population. Third, it is unknown what meal the eating occasion was for and this makes it difficult to describe the patterns. In the present study, the patterns were named based on the meal time, rather than meal type, to prevent misinterpretation of the temporal patterns of energy intake into meal patterns. Fourth, employment status is highly associated with household income, but 32 % of respondents had missing values of income level. Based on the complete data, post hoc analysis that additionally adjusted for income did not affect the results substantially (data not shown). However, future study is needed to understand the following pathways: whether time use, income or other factors of employment status influence the temporal patterns of eating. Fifth, the study was based on Taiwanese adults and the findings may not generalize to other populations.
Conclusion
The present study identified five major temporal patterns of energy intake in Taiwan. Adults who ate the traditional meal pattern had a better dietary (nutrient) quality compared with those who ate the other patterns. The traditional meal pattern was more likely to be practised in full-time workers, homemakers and retired people, compared with the other employment statuses. The worst quality of nutrient intake was found with the delayed lunchtime pattern, which was more common in adult students and part-time workers. The study suggests that the health disparity associated with nutrition might be introduced by the temporal patterns of energy intake. Further research is needed to understand how meal timing and temporal eating patterns would be associated with health status.
Acknowledgements
Financial support: This original research was partly supported by the Taiwan Ministry of Science and Technology (MOST 104-2320-B-010-042, 105-2314-B-010-012, 106-2314-B-010-010). Data analysed in this article were collected by the Nutrition and Health Survey in Taiwan (NAHSIT 2005–2008) sponsored by the Department of Health in Taiwan (DOH94-fs-6-4), a survey carried out by the Center for Survey Research of Academia Sinica, directed by Professor Wen-Harn Pan. The Office of Nutrition Survey, the Institute of Biomedical Sciences, Academia Sinica is responsible for data distribution. The assistance provided by the institutes and efforts made by all contributed to the survey are greatly appreciated. The views expressed herein are solely those of the authors. Conflict of interest: The authors have no competing interest to disclose. Authorship: C.-A.C. analysed the data and drafted the manuscript; W.-H.P. conceived the idea and reviewed the manuscript critically; H.-J.C. conceived the idea, analysed the data, and wrote and reviewed the manuscript. Ethics of human subject participation: The study was based on anonymous open domain data set, and was approved by the National Yang-Ming University Internal Review Board.
Supplementary Material
To view supplementary material for this article, please visit https://doi.org/10.1017/S1368980017002476


