-
Select format
-
- Publisher:
- Cambridge University Press
- Publication date:
- 15 September 2017
- 21 September 2017
- ISBN:
- 9781316338599
- 9781107117419
- 9781107540255
- Dimensions:
- (228 x 152 mm)
- Weight & Pages:
- 0.56kg, 314 Pages
- Dimensions:
- (228 x 152 mm)
- Weight & Pages:
- 0.46kg, 314 Pages
You may already have access via personal or institutional login
Book description
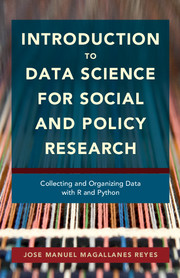
Real-world data sets are messy and complicated. Written for students in social science and public management, this authoritative but approachable guide describes all the tools needed to collect data and prepare it for analysis. Offering detailed, step-by-step instructions, it covers collection of many different types of data including web files, APIs, and maps; data cleaning; data formatting; the integration of different sources into a comprehensive data set; and storage using third-party tools to facilitate access and shareability, from Google Docs to GitHub. Assuming no prior knowledge of R and Python, the author introduces programming concepts gradually, using real data sets that provide the reader with practical, functional experience.
Reviews
'Data science has now firmly moved from computer science and engineering to the disciplines of the social sciences, where scholars are harnessing the insightful power of ever larger and more complex data sets. This volume provides a clear introduction for social scientists and policy researchers into the use of R and Python, including best practice of working with data files, command files, and outputs. The step by step approach with real world examples will be of great value to students, scholars, and practitioners engaged in data analytic approaches to social problems.'
Todd Landman - Pro-Vice Chancellor, Faculty of Social Sciences, University of Nottingham
'The irruption of big data and the need to comply with high standards of research reproducibility require social scientists and policy analysts to be conversant in data collection and management techniques. Unfortunately, even those with sophisticated methodological training often lack the necessary tools to take on these requirements. Magallanes's book at long last collects and organizes a large amount of information and useful advice on how to curate data for scientific analysis. Through agile narrative and compelling examples, he walks the reader through the use of open-source tools of data science such as R, Python, and Github. The book is an invaluable resource for students and scholars at different levels of proficiency, from neophytes to advanced users.'
Guillermo Rosas - Washington University, St. Louis
'This new, practical, reader-friendly, how-to manual on computational social data analysis is both long overdue and a must-have for analysts ad researchers. The range of problem-solving strategies and demonstrations is impressive. While eminently practical, Magallanes’ contribution is also rigorous and true to its scientific aims, which will please both basic and applied scientists and practitioners.'
Claudio Cioffi-Revilla - Director, Center for Social Complexity, George Mason University, Washington DC, and founding President, Computational Social Science Society of the Americas
'Magallanes’ excellent book on data science for researchers and policy analysts is an accessible yet thorough introduction to data management and analyses in R and Python. It has a broad coverage of the techniques required to capture, clean, and process complex information. It is the perfect companion for sophisticated policy analysts and researchers that are ready to take advantage of the wealth of data that is available to skilled computer scientists.'
Ernesto Calvo - University of Maryland
'It is rare indeed to pick up a new manuscript and immediately think how much you wish it had been written five years earlier, but I suspect many people will have that reaction to this book. This timely, thorough, and remarkably clear tutorial to both R and Python serves as a much needed on ramp to the data part of data science, and will undoubtedly soon grace the bookshelves of many social scientists - both students and their instructors. If you are intrigued by the possibilities of data science but concerned about the start up costs, look no farther: help has arrived.'
Joshua Tucker - New York University
'If you need to develop new skills in R and Python but you don’t know where to start, this is the book for you. With simple language, Magallanes shows you how to install the programs, retrieve data using APIs and scrape Internet sources, and how to get the data ready for modeling. This book is a gem.'
Aníbal Pérez-Liñán - University of Pittsburgh
'This book will be of great assistance to public policy and management scholars desiring a rigorous introduction to Data Science, particularly with regard to the intricacies of data management. The step-by-step approach will help teachers and students, in both undergraduate and graduate programs, become familiar with essential programming skills, particularly with respect to analyzing Big Data and making it available through Open Government initiatives. The author also provides a very helpful service in using both R and Python to show how to accomplish the same task, which allows readers to decide which of these languages will best serve their needs.'
Craig W. Thomas - Evans School of Public Policy and Governance, University of Washington
Contents
Metrics
Altmetric attention score
Full text views
Full text views help Loading metrics...
* Views captured on Cambridge Core between #date#. This data will be updated every 24 hours.
Usage data cannot currently be displayed.
Accessibility standard: Unknown
Why this information is here
This section outlines the accessibility features of this content - including support for screen readers, full keyboard navigation and high-contrast display options. This may not be relevant for you.
Accessibility Information
Accessibility compliance for the PDF of this book is currently unknown and may be updated in the future.

