


Overweight and obesity are well-established risk factors for cardiovascular morbidity and mortality(Reference Akinnusi, Pineda and El Solh1). Based on the reports of the WHO, 39 % of adults aged 18 years and older (38 % of men and 40 % of women) were overweight and obese(2). Although the ‘gold standard’ for obesity designation is a high amount of fat mass (FM)(Reference Romero-Corral, Somers and Sierra-Johnson3), physicians and epidemiologists typically rely on BMI to define the presence of this condition. BMI as a substitute for body fat percentage (BFP) has some benefits, such as an easy estimation and high generalisability; furthermore, similar to BFP, many epidemiological studies have shown a positive correlation between high BMI and mortality(Reference Engeland, Bjrge and Selmer4–Reference Britton, Massaro and Murabito6). However, an important limitation of using BMI is the failure to differentiate between fat content and muscle mass. This inherent limitation of BMI in the accurate diagnosis of obesity is observed to a greater extent among elderly Asians who commonly have lower lean body mass (LBM)(Reference Kang, Kyung and Park7). Consequently, the concept of normal-weight obesity (NWO) has been proposed.
NWO in women is defined as having normal body weight (BW) and BMI, but with a BFP higher than 30(Reference Romero-Corral, Somers and Sierra-Johnson8). Given the rapid epidemic and the importance of NWO in the development of diseases(Reference De Lorenzo, Martinoli and Vaia9–Reference Shea, Randell and Sun11), various strategies should be proposed for the prevention and treatment of this condition. Traditionally, the use of dietary interventions has been shown as a priority method for losing BFP(Reference Jakicic, Clark and Coleman12). However, evidence has shown that energy restriction may decrease resting and total energy expenditure due to a reduction in LBM, which in turn stops BW decrements(Reference Ashtary-Larky, Ghanavati and Lamuchi-Deli13,Reference Ashtary-Larky, Daneghian and Alipour14) . Indeed, Renzo et al.(Reference Renzo, Gobbo and Bigioni15) reported that women with NWO display lower RMR compared with lean, overweight and obese individuals due to the significant differences in LBM. It is well established that following dietary weight loss, LBM contributes approximately 20–30 % to total weight loss(Reference Tobias, Chen and Manson16,Reference Hession, Rolland and Kulkarni17) . Because of the lower LBM and RMR in women with NWO, preserving muscle mass is critical for optimal weight and/or fat loss interventions in this population(Reference Renzo, Gobbo and Bigioni15).
The manipulation of dietary macronutrient composition, especially elevating protein intake, is shown to be more effective at reducing BW because dietary protein increases thermogenesis, satiation and prevents declines in LBM(Reference Ding, Chan and Magkos18–Reference Leidy, Carnell and Mattes20). Previous studies in men have shown that high-protein (HP) diets help maintain LBM following weight loss(Reference Cheraghpour, Hosseini and Ashtary-Larky21,Reference Tang, Armstrong and Leidy22) . Since individuals with NWO have normal BW based on BMI classification, it is more important to improve body composition by reducing FM and increasing LBM rather than weight loss. One of these solutions is to increase protein intake(Reference Tang, Armstrong and Leidy22,Reference Weigle, Breen and Matthys23) . Despite the potential benefits of HP diets for fat loss, studies evaluating the effects of HP diet in women with NWO have not yet been extensively studied. This represents a gap in knowledge with important implications as there is not enough data about the management and therapy of NWO(Reference Long, Jeffcoat and Millward24). Thus, the aim of this study was to evaluate the effect of 12 weeks of a euenergetic HP diet on body composition characteristics and appetite in women with NWO. We hypothesised that a euenergetic HP diet would improve our primary outcome of LBM and the secondary outcome measures of FM, BFP and appetite.
Experimental methods
Participants and study design
A double-blind, parallel design randomised clinical trial (allocation ratio: 1:1) was conducted to determine the effects of euenergetic HP and standard protein (SP) diets on appetite and body composition of women with NWO for 12 weeks. Individuals were invited to participate in posters and social network advertising. The study was conducted, and data were collected at the Nutrition Clinic of Golestan hospital in Ahvaz, Iran. Inclusion criteria were non-smoker, having a BMI (in kg/m2) of >18·5 and <25, BFP > 30, between the age of 30 and 60 years and being healthy (no chronic diseases or medication treatment; this was verified via a health history records, a physical examination and basic laboratory screening (complete blood count, serum chemistries, liver panel and lipid panel)). Exclusion criteria were the use of birth control in the last 6 months, pregnancy or lactating, history or presence of kidney, gastrointestinal, liver or thyroid disease, gout, certain cancers, type 2 diabetes, bariatric surgery, psychiatric disorders, drug abuse, severe weight changes within the last 12 weeks; following a HP diet or using anti-obesity medications or supplements; and consuming protein supplement and high amounts of caffeine (>250–300 mg/d). Women consuming more than 300 mg of caffeine daily, described as caffeine users(Reference Weigle, Breen and Matthys23), were also excluded from the study. In addition, the participants who did not adhere (<90 %) to their dietary intervention and/or changed their physical activity (PA) significantly (this was assessed weekly) were excluded from the study. The consort flow chart of the study is shown in Fig. 1.
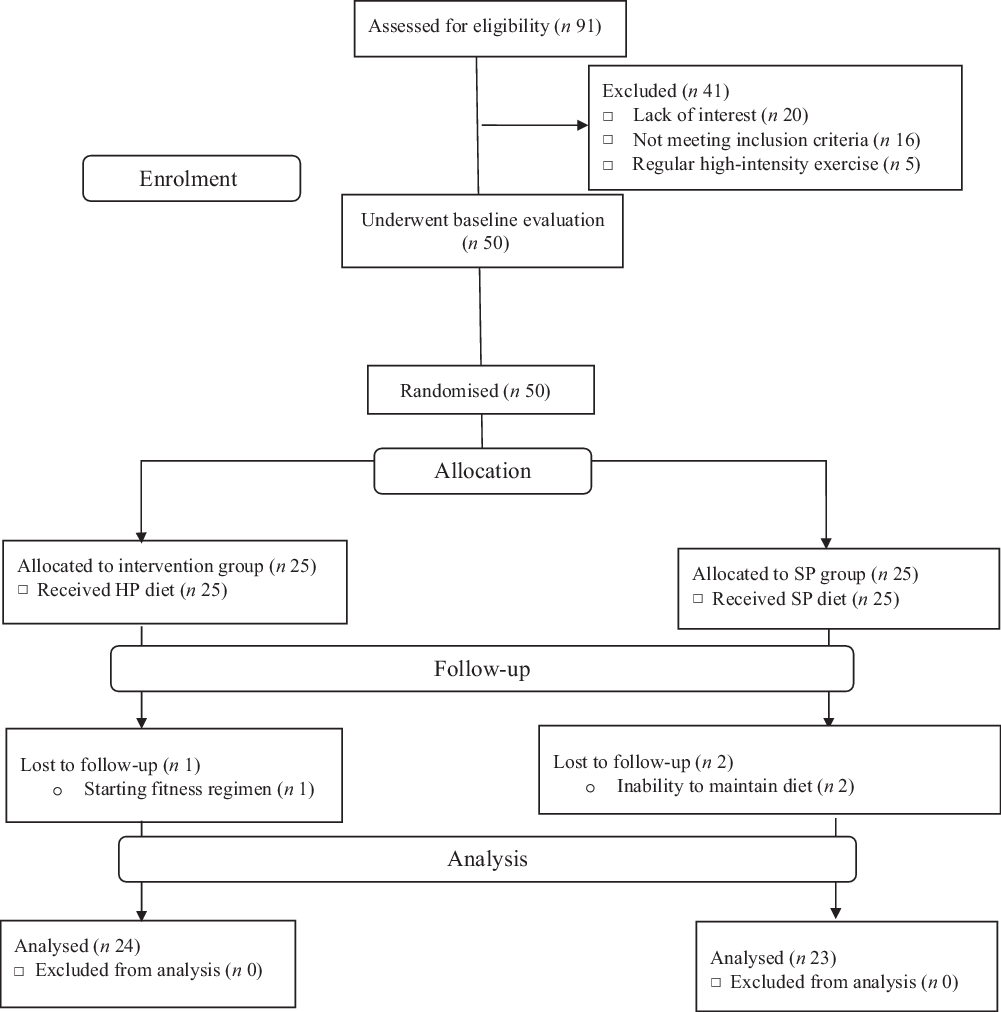
Fig. 1. Participant flow diagram. HP, high protein; SP, standard protein.
Women who met the selection criteria were randomly assigned to either an HP or an SP diet group, using a convenience allocation. Four visits were conducted: one prior to the study to screen and collect baseline data and one at the end of week 12 to complete questionnaires for 24-h dietary recalls, appetite, anthropometry and body composition measurements. Moreover, two visits were conducted at the end of week 4 and week 8 to complete dietary intake (by 24-h dietary recall) and remind participants to maintain their diets and usual PA levels, and not to consume any supplements or change their lifestyle. Moreover, participants were reminded to maintain dietary intake by phone every 2 weeks. Prior to the contribution, each volunteer provided written informed consent. The study was approved by the Ethics Committee of Ahvaz University of medical sciences (IR.AJUMS.REC.1395.55) and was retrospectively registered at the Iranian Registry of Clinical Trials (IRCT20170412033393N2).
Randomisation and blinding
Participants were randomly divided into two groups. Randomisation was carried out by utilising a random number table; for this, an independent coordinator, not otherwise involved in the study, created the allocation sequence assigning participants to the HP or SP diet groups. A dietitian assigned participants to their group (the allocation sequence was concealed by the independent coordinator until the moment of assignment), provided verbal and written dietary instruction on their regimens, facilitated group and one-on-one interventions and, therefore, could not be blinded. However, the dietitian did not participate in data collection and/or analysis. Both the participants and other research team members (except the mentioned dietitian) were blinded to the treatment allocation until the database was unlocked and data analysis was completed.
Dietary interventions
Following randomisation, participants in the SP and HP groups received a dietary regimen of typical (recommended) and HP content, respectively(Reference Shirali, Hosseini and Ashtary-Larky25,Reference Azadbakht, Izadi and Surkan26) . The SP diet contained the RDA of 0·8–1 g of protein/kg of BW, while the HP diet contained 1·8 g of protein/kg of BW, which equalled 15 and 25 % of total energy from protein, respectively, at the beginning of the intervention. The diet regimens had an equal amount of energy content in both groups according to the RMR based on the Harris–Benedict predictive formula(Reference Harris and Benedict27). Participants were provided with a 12-week euenergetic diet based on their RMR and adjusted for their activity level. The composition of the diet regimen was estimated in order to ensure adequate intakes of carbohydrates and fat recommended by the US Institute of Medicine according to age and sex(Reference Trumbo, Schlicker and Yates28). The meal macronutrient composition in the HP diet group was approximately 25 % protein, 30 % fat and 45 % carbohydrate(Reference Shirali, Hosseini and Ashtary-Larky25). The macronutrient composition in the SP diet group was approximately 15 % protein, 30 % fat and 55 % carbohydrate(Reference Shirali, Hosseini and Ashtary-Larky25). In addition, the protein intake consisted of at least 50 % high biological value proteins in both groups. A dietitian designed the energy requirements and macronutrient distribution of the diets and gave specific dietary instructions to participants. Each month, printed sample menus were provided that contained fifteen different meal options (a 6-d cycle of three meal options and three snacks per d). Participants purchased their own food items; none was supplied by the research team.
Anthropometry and body composition
The primary outcomes were the changes in body composition characteristics following 12 weeks of intervention. Body composition characteristics were measured by bioelectrical impedance analysis (310e Bioimpedance analyzer; Biodynamics), which has been previously reported to have high validity and reliability (R 0·95–0·99) compared with other established methods(Reference Demura, Yamaji and Goshi29–Reference Stewart, Bramley and Heighton34). BMI was calculated as BW/height (m2). Waist circumference (WC) was measured at the midpoint between the iliac crest and the lower rib while standing(Reference Shai, Schwarzfuchs and Henkin35). A senior researcher performed these measurements before and after the intervention. We instructed the participants to fast for 12 h (an overnight fast, with at least 8 h of sleep) and refrain from PA for the previous 36 h before the test. The participants were also instructed to avoid exercising consuming alcohol for 48 h before the test. Moreover, 30 min before, the test participants were asked to urinate (void) completely and avoid consuming water.
Appetite levels
The secondary outcome included the change in appetite level. Each participant’s appetite level was evaluated before and at the end of the intervention, by means of visual analogue scales(Reference Arumugam, Lee and Nowak36). Visual analogue scales was completed 5 min prior to lunch (approximately 3 h following a morning snack and ad libitum water intake), traditionally the largest Iranian meal(Reference Tahavorgar, Vafa and Shidfar37). The visual analogue scales questionnaire contained three questions on separate 100 mm scales: How hungry do you feel? How full do you feel? How much would you like to eat? To express their sensations of hunger and satiety, participants drew a vertical mark across the 100-mm marked line of each scale with ‘no appetite’ at one end and ‘uncontrollable appetite’ at the other, with low, average, high and very high points in between(Reference Flint, Raben and Blundell38). After the participants marked the questionnaires, these qualitative values converted to quantitative values from 1 to 100 mm(Reference Flint, Raben and Blundell38).
Dietary intake and physical activity assessment
All 24-h dietary recalls were completed (one weekday and one weekend day) at baseline and at the 4, 8 and 12 weeks’ time points(Reference Rondanelli, Klersy and Iadarola39). Participants were asked to recall the foods consumed over the previous 24 h. A 24-h period was defined as the time between when the participants woke up the previous day until the time they woke up the day of the interview(Reference Grewal, Mosdøl and Aunan40). A dietitian informed participants about the recall procedure at the beginning of each interview and recorded the answers in specially designed paper-based forms(Reference Grewal, Mosdøl and Aunan40). The validity and reliability of this method have been previously described(Reference Beer-Borst and Amado41–Reference Karvetti and Knuts43). Energy and nutrient compositions were calculated using the Nutritionist IV for Windows software program (The Hearst Corporation). The programme contains more than 12 000 food codes, obtained from The United States Department of Agriculture and from food manufacturers(Reference Drewnowski, Renderson and Driscoll44). Diets were analysed for total energy, carbohydrate, protein and fat. Dietary adherence was calculated by dividing the consumed energy content by the expected number of energy content. This was completed for each nutrient (carbohydrates, fats and protein) and total energy. Those participants with <90 % dietary compliance for a specific nutrient and/or total energetic amount prescribed were excluded from the study. PA was recorded by an international PA questionnaire and recorded as metabolic equivalents/week(Reference Thompson and Byers45). Metabolic equivalent values of 3·3, 4·0 and 8·0 were considered for walking, moderate- and vigorous-intensity physical activities, respectively(Reference Thompson and Byers45).
Statistical analyses
Justification of sample size
All participants who completed the study were included in the data analysis. Statistical analysis was conducted using SPSS 24 for Windows (SPSS, Inc.). Estimation of an appropriate sample size was conducted using the G*Power analysis software(Reference Faul, Erdfelder and Lang46). Our rationale for sample size was based on a previous study evaluating LBM in obese individuals receiving HP or SP diet(Reference Farnsworth, Luscombe and Noakes47). This study revealed an effect size for LBM of 0·3 = (mean difference of 1·4 kg/pooled standard deviation of 0·8) after the HP diet. A sample size of twenty patients per group was determined with an effect size of 0·3, and 80 % power at the predetermined level of α = 0·05. To account for potential subject attrition, we planned to recruit an extra five participants per group, which increased the final sample size to twenty-five participants per group.
Main statistical analysis
The normality of data was confirmed using the Shapiro–Wilk test. Possible group differences at baseline were examined using a Student’s t test. A 2 × 2 ANOVA with repeated measures (time (baseline v. 12 weeks) × group (HP v. SP)) was used to determine the effects of the dietary interventions over time. This was followed by the Bonferroni post hoc test when a significant treatment and treatment-by-time interaction was revealed. Values are presented as means and standard deviations, and statistical significance was considered at P < 0·05.
Results
Between May 2018 and June 2019, we screened ninety-one women with NWO. Of these, only fifty qualified for baseline evaluation and were subsequently randomised to either the HP or the SP groups. After randomisation, one participant in the HP group was dropped out of the study for starting an exercise regimen. In the SP group, two participants were dropped out for being unable to maintain their diets. No harms or unintended effects were reported by participants. Data are presented for the forty-seven participants who successfully completed our 12-week intervention; twenty-four and twenty-three participants were in the HP and SP groups, respectively.
Dietary analysis
Among fifty participants who were randomised, forty-seven (94 %) completed the 12-week study. Adherence to the dietary intervention was >90 % in both groups. Baseline values between the two groups were not significantly different (P > 0·05). The carbohydrate intake significantly decreased (27 %), while the protein intake significantly increased (72 %) in the HP group (P < 0·001) compared with no changes after SP (Table 1).
Table 1. Energy and macronutrients at baseline and after 12 weeks
(Mean values and standard deviations)
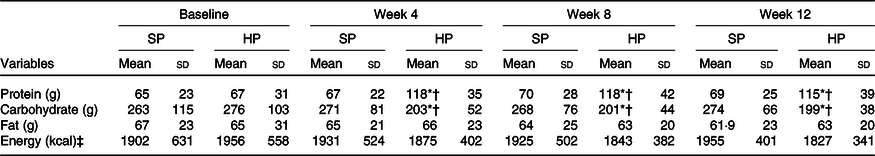
SP, standard protein; HP, high protein.
* P < 0·05 different from baseline.
† P < 0·05 between-group difference at post-intervention.
‡ To convert energy values from kcal to kJ, multiply by 4·184.
Body composition and appetite
Participant’s physiological and body composition characteristics are presented in Tables 2 and 3. At 12 weeks, the HP group had a significantly (P < 0·05) greater increase in LBM than did the SP group (mean between-group difference 1·5 kg; 95 % CI 3·1, 0·01; d 0·4). There were significantly (P < 0·05) greater declines in FM in the HP than in the SP group (mean between-group difference –1·1 kg; 95 % CI 1, –3·3; d –0·2). The change from baseline to 12 weeks in BFP also differed significantly between the two groups (mean between-group difference –2 %; 95 % CI 0·7, –5·2; d –0·3; P < 0·05). In addition, the HP group had significantly larger declines in WC than the SP group (mean between-group difference –1·4 cm; 95 % CI 0·6, –3·6; d –0·2; P < 0·05).
Table 2. Physiological characteristics of participants
(Mean values and standard deviations; numbers and percentages)
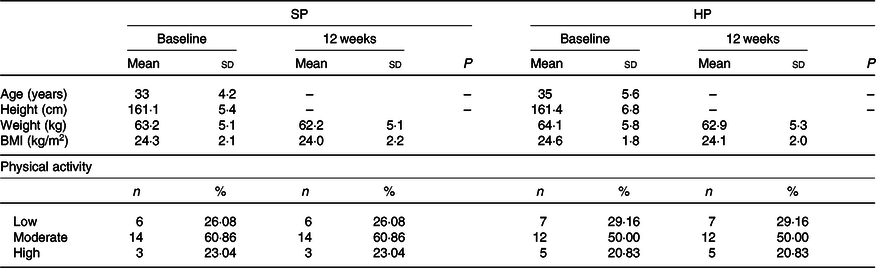
SP, standard protein; HP, high protein.
Table 3. Body composition and appetite at baseline and after 12 weeks
(Mean values and standard deviations)
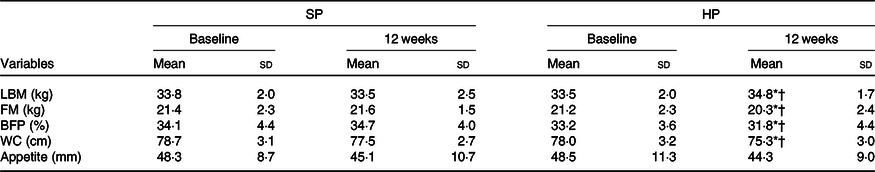
SP, standard protein; HP, high protein; LBM, lean body mass; FM, fat mass; BFP, body fat percentage; WC, waist circumference.
* P < 0·05 different from baseline.
† P < 0·05 between-group difference at post-intervention.
No statistically significant (P > 0·05) differences in appetite levels were detected between groups after 12 weeks (mean between-group difference –1·3 mm; 95 % CI 5·5, –8·3; d –0·08). Similarly, at 12 weeks, the BW remains unchanged in both groups (mean between-group difference –0·2 kg; 95 % CI 1·8, –2·2; d –0·03; P > 0·05). BMI also did not change significantly in either group (mean between-group difference –0·2 kg/m2; 95 % CI 0·6, –0·9; d –0·08; P > 0·05).
Discussion
This study evaluated the effects of 12 weeks of a euenergetic HP diet on body composition characteristics and appetite in women with NWO. The main findings of this study were that women with NWO improved LBM along with a concurrent decrease in FM and BFP following an HP compared with an SP diet. In addition, the HP diet leads to a decrease in WC indicating a decline in central obesity, an effect not shown after the SP intervention. To the best of our knowledge, this is the first study to compare euenergetic HP and SP diets in women with NWO.
Our findings showed that an HP diet produced a significant increase in LBM. In agreement with our results, a recent meta-analysis demonstrated that older adults could preserve LBM during the weight-loss phase more effectively when they undergo an HP diet(Reference Luger, Holstein and Schindler48). The meta-analytic work demonstrated that older overweight and obese adults, who consumed ≥1·0 g/kg per d of protein, preserved LBM as part of a successful weight-loss intervention. In addition, a recent clinical trial evaluated the influence of HP intake on LBM maintenance during hypoenergetic weight loss in athletes, showing improvements in FM (decreased) and LBM (increased) in the HP group compared with the control group(Reference Kim, O’Connor and Sands49). Moreover, other previous studies reported that an HP intake significantly preserves LBM compared with an SP(Reference Piatti, Monti and Magni50) or higher carbohydrate intake(Reference Mettler, Mitchell and Tipton51). A recent meta-analysis of eighty-seven short-term diet studies found that a protein intake >1·05 g/kg of actual BW was associated with 0·6 kg additional LBM gains compared with diets with protein intake of 1·05 g/kg or lower(Reference Johnston, Sears and Perry52). Although it is well established that HP diets preserved LBM during weight-loss phases, we provide the first evidence that a euenergetic HP diet in women with NWO enhances LBM. This finding may have relevant clinical implications as individuals with NWO commonly have lower LBM, which further declines overtime(Reference Renzo, Gobbo and Bigioni15). The mechanism for this purported LBM-improving effect might be related to dietary protein-induced alterations in protein turnover, particularly muscle protein synthesis(Reference Krieger, Sitren and Daniels53). It is widely indicated that the mechanistic target of rapamycin complex 1 signalling regulates muscle protein synthesis in response to anabolic stimuli such as essential amino acid intake(Reference Pasiakos, Cao and Margolis54–Reference Fujita, Dreyer and Drummond56). In the present study, we used 75 % high biological value proteins, which contains abundant essential amino acids, which may have led to an enhanced muscle protein synthesis.
It has been proposed that an HP diet may be an effective strategy to reduce BFP(Reference Smith, Atherton and Reeds57). Shirali et al. showed that an HP and low-fat diet greatly reduced BW and WC compared with a standard HP diet among women with overweight and obesity(Reference Shirali, Hosseini and Ashtary-Larky25). Our results suggest that the euenergetic HP diet is more effective in reducing FM and BFP compared with the SP diet in women with NWO. There are some potential mechanisms that contribute to BFP decrements associated with HP diets, which may involve the increased thermic effect of food and protein-induced alterations in gluconeogenesis to improve glucose homoeostasis. The thermic effect of food values are highest for protein (approximately 15–30 %), followed by carbohydrate (approximately 5–10 %) and fat (approximately 0–3 %)(Reference Pesta and Samuel58,Reference Westerterp59) . Based on a previous meta-analysis study, thermic effect of food increases approximately 29 kJ per 4184 kJ of ingested food for each 10 percentage points elevation in the energy from protein sources(Reference Acheson60). Moreover, it is known that LBM represents a key factor for the magnitude of RMR; thus, the preservation of LBM may be due to the declined FM(Reference Eisenstein, Roberts and Dallal61). HP diets may decrease appetite by increased secretion of satiety hormones (gastric inhibitory polypeptide and glucagon-like peptide 1), reduced orexigenic hormone secretion (ghrelin)(Reference Smith, Atherton and Reeds57). However, our results failed to show any significant alterations in appetite. Therefore, this type of diet may increase fat oxidation in overweight and obese participants.
A decreased WC was observed in the HP group following the 12-week intervention. Our observation is consistent with the results reported by previous studies(Reference Stiegler and Cunliffe62–Reference Mikkelsen, Toubro and Astrup65). A study showed that, in a SPan of 16 weeks, the more abdominal fat loss occurred with an HP diet that contained 27 % of total energy from dietary protein than with a diet that contained 16 % protein(Reference Witjaksono, Jutamulia and Annisa66). Moreover, Farnsworth et al. showed that higher protein intake (2·2 g protein/kg per d) significantly decreased the waist:hip ratio than the control group, suggesting that this reduction might be contributed to a decline in abdominal fat(Reference Farnsworth, Luscombe and Noakes47). The loss of abdominal fat may be predominantly loss of liver fat as these participants are more likely to have elevated TAG synthesis and enhanced fat in the liver(Reference Farnsworth, Luscombe and Noakes47). Consuming lower amounts of carbohydrates would result in a lower synthesis of VLDL and markedly lower stores of TAG in the liver(Reference Farnsworth, Luscombe and Noakes47).
A key strength of the present study is its randomised double-blinded controlled design, in which both the SP and HP dietary interventions were based on previous research(Reference Shirali, Hosseini and Ashtary-Larky25,Reference Chen, Liu and Yang67) . Additionally, the evaluation of PA and dietary intake at baseline and the end of study helped us ruling out PA and dietary intake changes (other than the assigned intervention) as the confounding factors for our results. Our study has some limitations. Firstly, appetite analysis in our study was only based on a visual analogue scales that contains relatively new anchors not widely used in the nutrition/dietetics field(Reference Blundell, De Graaf and Hulshof68), even though it is a valid and reliable method(Reference Flint, Raben and Blundell38,Reference Stubbs, Hughes and Johnstone69) . Moreover, subjective sensations do not provide the full picture of appetite control and energy intake and other variables are contributing to satiety and satiation. Besides visual inspection of appetite, there is a need to determine the strength of satiety through ad libitum intake(Reference Drapeau, King and Hetherington70). Another limitation of the current study is the lack of urine samples collection and analysis, which would have been useful to assess dietary adherence. In addition, our trial involved women with NWO, and therefore we were not able to generalise the results to other cohorts. Although the diets were designed to be weight maintenance, women with NWO lost some weight across both arms of the study. On average, this weight change was small (–1 v. –1·2 kg in SP and HP diet, respectively) and not statistically significant. Thus, it was unlikely to have influenced the results(Reference Goss, Chandler-Laney and Ovalle71). Moreover, this non-significant weight alternation may have been partially influenced by the monthly assessment of dietary intake; and hence, it is plausible that performing 24-h dietary recall more often would have resulted in less weight variability(Reference Krall, Dwyer and Coleman72). A further limitation of our investigation is the use of bioelectrical impedance, which is not the ‘gold standard’ for body composition measurement; however, previous studies have shown that it is a valid and reliable method(Reference Ling, de Craen and Slagboom30,Reference Jackson, Pollock and Graves31) . Lastly, we performed a per-protocol analysis, which may have biased results due to the exclusion of loss-to-follow-up participants. Although this type of analysis better reflects the effects of intervention when performed in an optimal manner, the clinical applicability of this per-protocol effect is limited if the effect in the intervention compliers differs substantially from the effect in other cohorts(73).
In conclusion, consuming an HP diet may significantly improve LBM in women with NWO, a population with lower muscle mass(Reference Renzo, Gobbo and Bigioni15). In addition, this type of diet decreases FM, BFP and WC. Therefore, euenergetic HP diets might be important for ameliorating detrimental complications attributed to poor body composition in women with NWO.
Acknowledgements
The authors wish to thank all the participants in this research project.
The study supported by Ahvaz Jundishapur University of Medical Sciences, Ahvaz, Iran (grant no. 94S87).
Contributions of the authors were as follows: N. H. and D. A.-L.: conducting the experiments and drafting of the manuscript; M. A., W. K. and V. A.: statistical analysis and interpreting the data; R. B., M. M., M. R. and A. W.: revision of the paper; A. W., D. A. L. and R. B.: final minor edits.
The authors declare that there are no conflicts of interest.


