


Diet influences the composition and function of the gut microbiota and thereby the host's health, particularly in patients suffering from food-related diseases. Coeliac disease (CD) is an inflammatory disorder of the small intestine caused by a permanent intolerance to gluten proteins in predisposed individuals. In these patients, gluten peptides trigger an abnormal immune response that causes the typical CD tissue lesion characterised by villous atrophy, crypt hyperplasia, and increased numbers of intra-epithelial and lamina propria lymphocytes(Reference Marsh1, Reference Sollid2). CD enteropathy is sustained by a T-helper (Th)1 immune response with production of pro-inflammatory cytokines (for example, interferon (IFN)-γ), as well as by an innate immune response mediated by IL-15 that activates intra-epithelial lymphocytes and epithelial cell killing(Reference Gianfrani, Auricchio and Troncone3). Increased production of pro-inflammatory cytokines by cells of the innate immune system (monocytes, macrophages and dendritic cells) is also thought to mediate the recruitment of lymphocytes into the lamina propria and epithelium, thus contributing to the disease(Reference Cinova, Palová-Jelínková and Smythies4). The treatment with a gluten-free diet (GFD) usually leads to normalisation of mucosal histology and remission of clinical symptoms. Nevertheless, compliance with this dietary therapy is very complex and patients often suffer from higher health risks and nutritional deficiencies(Reference Cosnes, Cellier and Viola5, Reference Malandrino, Capristo and Farnetti6). The composition and metabolic activity of the intestinal microbiota is currently thought to be involved in a number of chronic inflammatory disorders. Most recent studies indicate that CD patients untreated and treated with a GFD have unbalanced microbiota that can play a pathogenic role or constitute a risk factor for this disorder(Reference Nadal, Donat and Ribes-Koninckx7, Reference Sanz, Sánchez, De Palma, Overton and Ewente8). Nevertheless, part of the detected microbial changes could be due not only to the underlying disease but also to the dietary intervention by a GFD in treated CD patients. A GFD has also been tested as dietary treatment for autism(Reference Elder, Shankar and Shuster9). However, the possible effect of a GFD in the gut ecosystem remains largely unknown.
The objective of the present study was to analyse the impact of a GFD on the composition and immune function of the microbiota in healthy subjects to gain further insights on interactions between diet and gut microbes, as well as on the possible effects of this therapy on gut health and quality of life of CD patients.
Experimental methods
Subjects
Ten volunteers (eight women and two men; mean age 30·3 years; range 23–40 years) were included in the study. All participants included in the present study had no history of digestive pathology or signs of malnutrition. None of the volunteers had been treated with antibiotics at least within the 2 months before the faecal sampling. Informed consent was obtained from the subjects, and the study was approved by the local ethics committee.
Dietary intervention and assessments
Subjects were submitted to a GFD by replacing gluten-containing foods by equivalent ones certified as gluten-free (20 parts per million maximum gluten content) by the Spanish Federation of Coeliac Association (FACE) over a 1-month period. Food diary records were kept for 72 h (2 weekdays and 1 weekend day) both before the start of the intervention and after 1 month to monitor dietary changes. At the front of the diary, detailed information on how to record food and beverages consumed using common household measures was provided. When completing the food diary records, subjects were instructed to record everything they ate or drank. Food diary records were returned to the dietitian as soon as possible after completion when they were reviewed, and analysed for energy, water and macronutrient contents based on the CESNID food composition database of Spanish foods(Reference Farran, Zamora and Cervera10).
Faecal sampling
Faecal samples from each adult volunteer were collected before and after following the GFD and processed as described elsewhere in duplicate(Reference Nadal, Donat and Ribes-Koninckx7, Reference Collado, Calabuig and Sanz11). Briefly, 2 g (wet weight) were 10-fold diluted in PBS (130 mm-sodium chloride, 10 mm-sodium phosphate, pH 7·2) and homogenised for 5 min in a Lab Blender 400 stomacher (Seward Medical, London, UK). The homogenised samples were subjected to a low-spin centrifugation (2000 rpm, 2 min) to remove large particulate material, and samples of the obtained supernatant fractions were used for either DNA extraction or hybridisation. Before hybridisation, one volume of the supernatant fraction was mixed with three volumes of fresh 4 % paraformaldehyde, fixed at 4°C overnight, and stored in 50 % ethanol–PBS at − 80 °C until use for hybridisation(Reference Nadal, Donat and Ribes-Koninckx7, Reference Collado, Calabuig and Sanz11). DNA extractions were done by using the QIAamp DNA Stool Mini Kit (Qiagen, Hilden, Germany) following the manufacturer's instructions.
Fluorescence in situ hybridisation and flow cytometry detection
Enumeration of bacteria present in faecal samples was carried by fluorescence in situ hybridisation (FISH) using 16S rRNA-targeted oligonucleotide probes (MOLBIOL, Berlin, Germany), as previously described(Reference Nadal, Donat and Ribes-Koninckx7, Reference Collado, Calabuig and Sanz11). The following probes were used: EUB 338 for the detection of total bacteria(Reference Amann, Binder and Olson12); Ato291 for Atopobium group(Reference Harmsen, Wildeboer-Veloo and Grijpstra13); Bif164 for Bifidobacterium genus(Reference Langendijk, Schut and Jansen14); Lab158 for Lactobacillus and other lactic acid bacteria(Reference Harmsen, Gibson and Elfferich15); Bac303 for Bacteroides–Prevotella group(Reference Manz, Amann and Ludwig16); Ecol1513 for Escherichia coli (Reference Poulsen, Lan and Kristensen17); Erec0482 for Eubacterium rectale–Clostridium coccoides group(Reference Franks, Harmsen and Raangs18); CHis159 for C. histolyticum group(Reference Harmsen, Wildeboer-Veloo and Grijpstra13); CLis135 for C. lituseburense group(Reference Hold, Schwiertz and Aminov19); Fprau645 for Faecalibacterium prausnitzii (Reference Suau, Rochet and Sghir20). Cells were enumerated by combining in the same hybridisation tube one group-specific fluorescein isothiocyanate probe with the EUB 338-Cy3 probe. The proportion of group cells was corrected by eliminating background fluorescence, which was measured using the negative control NON 338 probe(Reference Nadal, Donat and Ribes-Koninckx7, Reference Wallner, Amann and Beisker21). Fixed cells were incubated in the hybridisation solution (10 mm-2-amino-2-hydroxymethyl-propane-1,3-diol-HCl, 0·9 m-NaCl, pH 8·0, and 10 % SDS) containing 4 ng/μl of each fluorescent probe at appropriate temperatures overnight, washed and re-suspended in PBS solution for flow cytometric analysis(Reference Nadal, Donat and Ribes-Koninckx7, Reference Collado, Calabuig and Sanz11).
Flow cytometry detections were performed using an EPICS® XL-MCL flow cytometer (Beckman Coulter, Miami, FL, USA) as previously described(Reference Nadal, Donat and Ribes-Koninckx7, Reference Collado and Sanz22). This instrument is equipped with two light scatter detectors that measure forward and side scatter and fluorescence detectors that detect appropriately filtered light at green (FL1; 525 nm) and red-orange (FL3; 620 nm) wavelengths. The event rate was kept at the lowest setting (200–300 events per s) to avoid cell coincidence. A total of 15 000 events were recorded in a list mode file and analysed with System II V.3 software (Beckman Coulter). The proportion of each bacterial group was expressed as a ratio of cells hybridising with the fluorescein isothiocyanate-labelled specific probe to cells hybridising with the universal EUB 338-Cy3 probe(Reference Nadal, Donat and Ribes-Koninckx7, Reference Collado and Sanz22).
Quantitative real-time polymerase chain reaction analysis
Quantitative PCR (qPCR) was used to characterise the composition of the faecal microbiota by the use of specific primers targeting different intestinal bacterial groups as described elsewhere(Reference Matsuki, Watanabe and Fujimoto23, Reference Malinen, Kassinen and Rinttilä24). PCR amplification and detection were performed with an ABI PRISM 7000-PCR sequence detection system (Applied Biosystems, Warrington, Cheshire, UK). Each reaction mixture of 25 μl was composed of SYBR® Green PCR Master Mix (SuperArray Bioscience Corporation, Frederick, MD, USA), 1 μl of each of the specific primers at a concentration of 0·25 μm and 1 μl of template DNA. The bacterial concentration from each sample was calculated by comparing the Ct (cycle threshold) values obtained from standard curves. Standard curves were created using serial 10-fold dilution of pure culture DNA corresponding to 102 to 109 cells as determined by microscopy counts using 4′,6-diamidino-2-phenylindole.
Isolation and stimulation of peripheral blood mononuclear cells
Peripheral blood mononuclear cells (PBMC) were isolated from heparinised peripheral blood of four healthy volunteers (aged 26–28 years) as previously described(Reference Medina, Izquierdo and Ennahar25). Briefly, PBMC were isolated by centrifugation over a Ficoll density gradient (Amersham Biosciences, Piscataway, NJ, USA) and adjusted to 1 × 10⁶ cells/ml in Roswell Park Memorial Institute (RPMI) 1640 (Cambrex, New York, NY, USA), supplemented with 10 % fetal bovine serum (Gibco, Barcelona, Spain), 2 mm-l-glutamine, streptomycin (100 μg/ml) and penicillin (100 U/ml) (Sigma, St Louis, MO, USA). PBMC were incubated in twenty-four-well flat-bottomed polystyrene microtitre plates (Corning, Madrid, Spain) and incubated at 37°C under 5 % CO2. Faecal samples, 30 μl, of each subject before and after following the GFD were used to stimulate PBMC for 24 h. Purified lipopolysaccharide (LPS) from Escherichia coli O111:B4 (Sigma) was used at a concentration of 1 μg/ml as a positive control. Non-stimulated PBMC were also evaluated as controls of basal cytokine production. All reagents were tested by the E-toxate test for LPS (Sigma) and shown to be below the limit of detection (2 pg/ml). Every sample used as stimulant was assayed in duplicate. Cell-culture supernatant fractions were collected by centrifugation, fractionated in samples, and stored at − 20°C until cytokines were analysed.
Cytokine assays
Cytokine concentrations of supernatant fractions were measured by ELISA. The pro-inflammatory cytokines TNF-α and IFN-γ and the regulatory cytokine IL-10 were analysed by using the Ready SET Go! Kit (eBioscience, San Diego, CA, USA), and the chemokine IL-8 by using a Diaclone ELISA commercial kit (Diaclone, Madrid, Spain), according to the manufacturers' instructions. The sensitivity of assays for each cytokine was as follows: 4 pg/ml for TNF-α and IFN-γ, 2 pg/ml for IL-10 and < 25 pg/ml for IL-8.
Statistical analyses
Statistical analyses were done using SPSS 11.0 software (SPSS Inc., Chicago, IL, USA). Dietary composition (mean values and standard deviations) was calculated for crude (unadjusted) nutrients from the 72 h dietary registers and data were averaged for the analysis. Dietary variables were submitted to log-transformation and mean comparisons before and after the intervention were determined by applying the Student's t test. Microbial data are expressed as medians with interquartile ranges (IQR) and the differences in bacterial counts before and after GFD were determined by applying the Mann–Whitney U test. Results of cytokine production are expressed as means with standard deviations and differences were determined by applying the Student's t test. In every case, P values < 0·05 were considered statistically significant.
Results and discussion
Gluten-free diet influences the composition of the intestinal microbiota in healthy subjects
A preliminary study was carried out to establish the effects of a GFD on the composition of the intestinal microbiota and to gain insights into the possible relationship of this dietary therapy with gut health. The adult human subjects included in the study, 80 % female (eight out of ten) and 20 % male (two out of ten), maintained a good health status during the intervention, and followed a conventional diet without any restriction except for gluten-containing products. Dietary data before and after the intervention are shown in Table 1. No significant differences in dietary intake were found in energy and macronutrients as a result of the GFD except for significant reductions (P = 0·001) in polysaccharide intake. Previous studies on the nutritional quality of the GFD also indicated that it is associated with reductions in the intake of polysaccharides together with energy compared with the standard gluten-containing diet of healthy individuals, according to the present results(Reference Kinsey, Burden and Bannerman26). The composition of the faecal microbiota under the effects of the GFD determined by FISH is shown in Table 2. Individual baseline variability of bacterial populations expressed as median of differences in proportions of bacterial cells hybridising with group-specific probes related to total bacteria hybridising with EUB probe 338 was as follows: 2·38 (IQR 1·01–5·30) for Atopobium group; 1·86 (IQR 1·42–3·10) for Bifidobacterium; 1·54 (IQR 1·09–2·13) for Lactobacillus group; 2·16 (IQR 0·86–3·26) for Bacteroides–Prevotella; 1·29 (IQR 0·84–1·47) for Escherichia coli; 6·54 (IQR 0·21–10·41) for Eubacterium rectale–C. coccoides; 1·04 (IQR 0·41–2·48) for C. histolyticum; 1·63 (IQR 0·59–3·61) for C. lituseburense; 6·65 (IQR 0·62–6·72) for F. prausnitzii. Bifidobacterium, C. lituseburense and F. prausnitzii proportions decreased significantly (P = 0·007, P = 0·031 and P = 0·009, respectively) as a result of the GFD (Table 2). Lactobacillus group proportions were also almost significantly reduced (P = 0·058) after the GFD (Table 2). Bacteroides–Prevotella, Eubacterium rectale–C. coccoides and C. histolyticum group proportions were slightly reduced, while those of Escherichia coli were increased after the GFD but not significantly (Table 2). Total counts determined by FISH using 4′,6-diamidino-2-phenylindole also showed significant reductions after the GFD from 10·25 to 9·98 log cells/g faeces (P = 0·030). The composition of the faecal microbiota analysed by qPCR is shown in Table 3. Individual baseline variability of bacterial populations expressed as median of differences in log cells per g faeces was as follows: 0·37 (IQR 0·17–0·65) for Bifidobacterium; 1·50 (IQR 0·21–1·68) for Bacteroides; 0·40 (IQR 0·08–0·82) for C. coccoides; 0·27 (IQR 0·13–1·05) for C. leptum; 0·27 (IQR 0·33–0·37) for C. histolyticum; 0·87 (IQR 0·20–1·13) for Lactobacillus; 0·48 (IQR 0·24–1·18) for Escherichia coli; 0·80 (IQR 0·15–1·37) for Enterobacteriaceae. The counts of Bifidobacterium and Lactobacillus groups decreased significantly after the GFD (P = 0·020 and P = 0·001, respectively), while those of Escherichia coli (P = 0·003) and total Enterobacteriaceae (P < 0·005) significantly increased as a result of the GFD, following a similar trend as that detected by FISH. Total counts were also reduced after the GFD when determined by qPCR from 9·85 to 9·71 log cells/g faeces (P = 0·089), following the same trend as by FISH quantification. Therefore, introduction of a GFD implied a reduction in bacterial populations generally regarded as beneficial for human health such as Bifidobacterium and Lactobacillus, and an increase in those of opportunistic pathogens such as Escherichia coli and total Enterobacteriaceae. These changes could be related to reductions in polysaccharide intake, since these dietary compounds usually reach the distal part of the colon partially undigested, and constitute one of the main energy sources for beneficial components of the gut microbiota(Reference De Graaf and Venema27). In addition, reductions in Bifidobacterium and Lactobacillus populations relative to Gram-negative bacteria (Bacteroides and Escherichia coli) were previously detected in untreated CD children and particularly in treated CD patients with a GFD(Reference Nadal, Donat and Ribes-Koninckx7). These findings indicate that this dietary therapy may contribute to reduce beneficial bacterial group counts and increase enterobacterial counts, which are microbial features associated with the active phase of CD(Reference Nadal, Donat and Ribes-Koninckx7, Reference Collado, Donat and Ribes-Koninckx28) and, therefore, it would not favour completely the normalisation of the gut ecosystem in treated CD patients. The relative proportion of F. prausnitzii was also significantly reduced after the GFD in healthy adults following a similar trend as that detected in untreated or treated CD patients compared with controls(Reference Nadal, Donat and Ribes-Koninckx7). A depletion of F. prausnitzii population in faecal mucus of active Crohn's disease patients has also been detected, leading to an inverse relationship between the abundance of this population and inflammatory bowel disorders(Reference Swidsinski, Loening-Baucke and Vaneechoutte29). Bifidobacterium species composition was also analysed under the effect of the GFD by qPCR (Table 3). Individual baseline variability of bacterial populations expressed as median of differences in log cells/g faeces was as follows: 0·71 (IQR 0·08–1·33) for Bifidobacterium longum; 0·68 (IQR 0·07–1·03) for B. breve; 1·16 (IQR 0·77–1·07) for B. bifidum; 0·86 (IQR 0·17–1·29) for B. adolescentis; 1·21 (IQR 0·63–1·72) for B. catenulatum; 0·30 (IQR 0·002–0·45) for B. angulatum; 0·35 (IQR 0·19–0·82) for B. lactis. The counts of B. angulatum were significantly increased (P = 0·038) after the GFD, while those of B. longum decreased (P = 0·017), indicating that this species contributed to the reduction detected in total Bifidobacterium population (Table 3). The genome sequence of B. longum subsp. longum showed that more than 8 % of the annotated genes were involved in carbohydrate and polysaccharide metabolism(Reference Schell, Karmirantzou and Snel30), which could explain the reduction of their levels after the GFD, parallel with a reduction in polysaccharide intake.
Table 1 Daily energy and nutrient intake before and after the gluten-free diet (GFD) intervention
(Mean values and standard deviations)
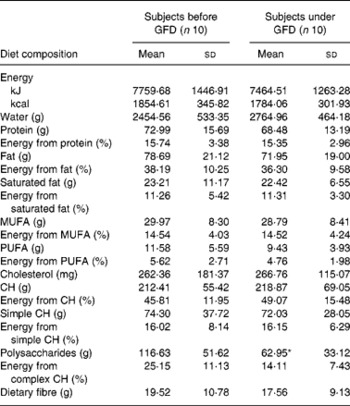
CH, carbohydrates.
* Mean value was significantly different from that before the GFD (P < 0·05; Student's t test).
Table 2 Composition of the faecal microbiota of healthy adults before and after following a gluten-free diet (GFD) analysed by fluorescent in situ hybridisation (FISH) and flow cytometry detection (FCM)†
(Medians and interquartile ranges (IQR))
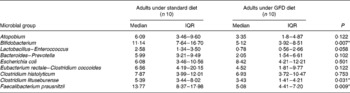
* P < 0·05 (Mann–Whitney U test).
† Data are group-specific bacterial proportions related to total population detected with the EUB universal probe as determined by FCM–FISH.
Table 3 Composition of the faecal microbiota of healthy adults before and after following a gluten-free diet (GFD) analysed by quantitative PCR†
(Medians and interquartile ranges (IQR))
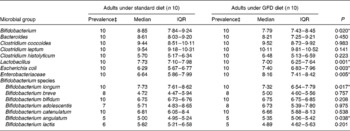
* P < 0·05 (Mann–Whitney U test).
† Data are log cell number/g faeces.
‡ Prevalence reflects the number of positive amplifications from total samples analysed by quantitative PCR.
Gluten-free diet influences immunostimulatory activity of the intestinal microbiota
Changes in cytokine production patterns stimulated by faecal samples of healthy individuals after and before the GFD are shown in Fig. 1. Immunostimulatory properties of the colonic content of these individuals, representing an altered microbiota, were remarkably reduced after following a GFD, inducing a significantly lower production of the pro-inflammatory cytokines TNF-α (P = 0·021) and IFN-γ (P = 0·037) and the chemokine IL-8 (P = 0·007). Thus, a GFD could contribute to reduce the pro-inflammatory signals in the gut by introducing modifications in the microbiota structure. In addition, the faecal samples of individuals under a GFD induced significantly lower production of the anti-inflammatory cytokine IL-10 (P = 0·002) than those of individuals on a standard gluten-containing diet. IL-10 inhibits the production of pro-inflammatory and Th1 cytokines such as TNF-α and IFN-γ(Reference Mosmann31). Therefore, it could be expected that reductions in Th1-type cytokine production were accompanied by increases in the Th2-type and regulatory cytokine IL-10. However, when a stimulus increases IFN-γ production, IL-10 production can also be increased by counter-regulatory mechanisms and vice versa. In this case, it seems likely that GFD led to a generalised reduction of bacterial-induced cytokine production in vitro as a result of the generalised reduction caused by this dietary intervention in the total luminal bacterial load of the large intestine. Moreover, specific bacterial group changes could also be partially responsible for the differences detected in cytokine induction since, for instance, Bifidobacterium genus and particularly some B. longum strains have been acknowledged for their ability to stimulate IL-10 production(Reference Medina, Izquierdo and Ennahar25) and their levels were significantly reduced after the GFD. The immune-suppressive effects associated with the GFD may be partly beneficial for CD patients, which are prone to a Th1-biased immune response, but may also imply a defect of their defence and regulatory mechanisms against harmful antigens and chronic inflammation.
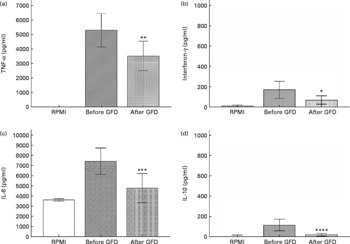
Fig. 1 Cytokine production (TNF-α (a), interferon-γ (b), IL-8 (c), IL-10 (d)) by peripheral blood mononuclear cells (PBMC) stimulated with faecal samples from healthy volunteers before and after the gluten-free diet (GFD) and controls (non-stimulated PBMC). Results are expressed as means of duplicate measures determined in four independent experiments, with standard deviations represented by vertical bars. Statistically significant differences were established by applying Student's t test at P < 0·050. RPMI, Roswell Park Memorial Institute medium. Mean value was significantly different from that before the GFD: * P < 0·037, ** P < 0·021, *** P < 0·007, **** P < 0·002.
Conclusions
The obtained results suggest that a GFD may influence the composition and immune function of the gut microbiota in healthy individuals, without the influence of any underlying disease, parallel with reductions in polysaccharide intake. Although this is a preliminary short-term intervention study, bacterial changes are similar to those detected previously in children after compliance with a long-term GFD. As intestinal bacteria constitute a constant challenge of antigens to their host that modulate immunity, the GFD should be considered as a possible environmental factor that may shape the microbiota composition and gut health in treated CD patients.
Acknowledgements
The present study was supported by grants AGL2008-01 440/ALI and Consolider Fun-C-Food CSD2007-00 063 from the Spanish Ministry of Science and Innovation.
G. D. P. and M. C. C. were recipients of I3P scholarships from the Spanish National Research Council (CSIC, Spain) and I. N. from Generalitat Valenciana (Spain) and CSIC (200570F0091).
G. D. P. carried out the immunological and statistical analyses. I. N. and M. C. C. carried out the microbiological analyses. Y. S. conceived of and coordinated the study, and wrote the manuscript. All authors read, reviewed and approved the final version of the manuscript.
The authors do not have any conflict of interest.


