


1 Introduction
The dynamics and energy dissipation processes in shallow-water breaking waves are important components in the transfer of mass, momentum and energy between ocean and atmosphere, and the correct modelling of breaking waves constitutes an important and incompletely understood component in climate modelling (Memery & Merlivat Reference Memery and Merlivat1985; Melville Reference Melville1996; Monahan & Dam Reference Monahan and Dam2001; Deike & Melville Reference Deike and Melville2018). Given also the proximity of coastal urban development to the nearshore wave environment, understanding the wave dynamics can inform engineering and construction efforts in this development, for example with respect to storm flood estimation (Yin, Lin & Yu Reference Yin, Lin and Yu2016; Lin & Shullman Reference Lin and Shullman2017). In this study, we present an inertial model for the energy dissipation in shallow-water breakers, with an emphasis on solitary waves.
There has been considerable research into the energetics of breaking wave fields over many years, and a broad historical review can be found in Kirby (Reference Kirby2017). The two general approaches involve, on the one hand, wave-averaged methods, where waves are modelled in statistical distributions satisfying appropriately averaged equations of motion (see e.g. Battjes & Janssen Reference Battjes and Janssen1978; Thornton & Guza Reference Thornton and Guza1983), and, on the other, wave-resolved methods, which directly model individual waves and their dynamics and energetics. This latter approach has yielded many rich results, including the well-known fundamental Boussinesq equations for dispersive shallow-water waves and corresponding travelling-wave solutions (Boussinesq Reference Boussinesq1872; Lamb Reference Lamb1932), which influence modern studies (Kirby Reference Kirby2016) to which the present investigation is addressed.
In the analysis of the energetics of breaking waves in wave-resolved models, there is the important question of the relative effects of local wave parameters, such as the dimensions and dynamical characteristics of the wave at the moment of breaking, and of the initial conditions of the wave in the far field, however defined. A review of the relevant parameters, especially of the former class, can be found in Robertson et al. (Reference Robertson, Hall, Zytner and Nistor2013). There are also different treatments between progressive waves (Peregrine Reference Peregrine1998; Chanson Reference Chanson2009; Martins et al. Reference Martins, Blenkinsopp, Deigaard and Power2018), which have also seen significant research in deep-water contexts – most relevantly for this study Duncan (Reference Duncan1981), Drazen, Melville & Lenain (Reference Drazen, Melville and Lenain2008), Romero, Melville & Kleiss (Reference Romero, Melville and Kleiss2012), Perlin, Choi & Tian (Reference Perlin, Choi and Tian2013), Deike, Popinet & Melville (Reference Deike, Popinet and Melville2015), Deike, Melville & Popinet (Reference Deike, Melville and Popinet2016), Deike, Pizzo & Melville (Reference Deike, Pizzo and Melville2017) and Derakhti, Banner & Kirby (Reference Derakhti, Banner and Kirby2018) – and for solitary waves.
Solitary waves provide a context where it is easy to estimate the wave parameters at the point of breaking, and efforts to relate the breaking conditions to the initial conditions are an active research problem. The breaking index  $\unicode[STIX]{x1D6FE}_{b}\equiv h_{b}/d_{b}$ relating wave amplitude $h_{b}$ to depth at breaking $d_{b}$ (Robertson et al. Reference Robertson, Hall, Zytner and Nistor2013) is of particular interest in this effort. Since the classic study of solitary waves by Peregrine (Reference Peregrine1967), lines of investigation have centred on scaling laws for the amplitude of the shoaling wave (Synolakis & Skjelbreia Reference Synolakis and Skjelbreia1993; Knowles & Yeh Reference Knowles and Yeh2018), the wave amplitude and water depth at the point of breaking (notably Grilli, Svendsen & Subramanya (Reference Grilli, Svendsen and Subramanya1997) and discussed at length by Robertson et al. (Reference Robertson, Hall, Zytner and Nistor2013)) and the runup characteristics of these waves (Synolakis Reference Synolakis1987). Of particular interest to predicting wave runup is the energy dissipated from the wave as it shoals. For non-breaking waves on steep slopes, viscous dissipation in the bottom boundary layer of the wave dominates the energy loss (Pedersen et al. Reference Pedersen, Lindstrøm, Bertelsen, Jensen, Laskovski and Sælevik2013), but breakers on more moderate slopes suffer energy loss from a variety of sources.
In breaking waves, the energy dissipation is dominated by the processes in the breaking part of the wave itself (Li & Raichlen Reference Li and Raichlen2001). Unlike considerable development of deep-water energy dissipation models (Duncan Reference Duncan1981; Rapp & Melville Reference Rapp and Melville1990; Drazen et al. Reference Drazen, Melville and Lenain2008; Tian, Perlin & Choi Reference Tian, Perlin and Choi2011; Romero et al. Reference Romero, Melville and Kleiss2012; Pizzo & Melville Reference Pizzo and Melville2013; Deike et al. Reference Deike, Popinet and Melville2015, Reference Deike, Melville and Popinet2016; Derakhti et al. Reference Derakhti, Banner and Kirby2018), to our knowledge a precise accounting of the energy budget for this part of the process does not exist, in part because of the difficulty of measuring these quantities coupled with a large parameter space and class of breakers. In addition, a fundamental understanding of the energy dissipated during the shallow-water breaking process has not been provided.
Resolving all energetic processes in the wave by direct numerical simulation (DNS) of these breakers provides an attractive option that has become more computationally feasible in recent years (Emarat et al. Reference Emarat, Forehand, Christensen and Greated2012; Deike et al. Reference Deike, Popinet and Melville2015). Other numerical approaches have historically comprised depth-averaged models, as in Peregrine (Reference Peregrine1967); fully nonlinear potential flow techniques, which provide accurate shape evolution results but which do not survive the breaking event; and certain large-eddy simulation and Reynolds-averaged Navier–Stokes techniques (Lubin & Caltagirone Reference Lubin and Caltagirone2010; Derakhti et al. Reference Derakhti, Kirby, Shi and Ma2016). The DNS approach proved feasible in deep-water studies (Song & Sirviente Reference Song and Sirviente2004; Iafrati Reference Iafrati2011; Deike et al. Reference Deike, Popinet and Melville2015, Reference Deike, Melville and Popinet2016) but has not yet, to our knowledge, been applied to shallow-water breakers. Despite the three-dimensional nature of turbulence, a striking similarity between two- and three-dimensional simulations with regard to the dissipation of energy has been noted by Iafrati (Reference Iafrati2009), Derakhti & Kirby (Reference Derakhti and Kirby2014, Reference Derakhti and Kirby2016) and Deike et al. (Reference Deike, Popinet and Melville2015, Reference Deike, Melville and Popinet2016). Therefore, while the three-dimensional turbulent dissipation rate is naturally expected to be slightly greater than the one observed in two-dimensional simulations, the latter have been proposed as a reasonable proxy and will be used in the present study.
In this study we present DNS results of shallow-water solitary waves with a range of amplitudes, shoaling onto a range of beaches with uniform slope, along with their energy budgets. Our study is structured as follows. In § 2 we develop a theoretical scaling to predict a given wave’s energy dissipation rate in terms of the breaking conditions, inspired by the inertial scaling of Taylor (Reference Taylor1935) and Drazen et al. (Reference Drazen, Melville and Lenain2008). In § 3 we discuss the numerical method and formulation. We then compare the theory with the numerical scaling results in § 4. In § 5 we relate the local variables to the initial conditions using empirical scalings inspired by the literature. We conclude in § 6 with some remarks on further work.
2 Inertial model for shallow-water wave breaking
We develop a model for energy dissipation resulting from breaking waves. The derivation follows the original approach used by Drazen et al. (Reference Drazen, Melville and Lenain2008) in deep-water breakers; here we adapt it for the purpose of shallow water. We assume that, as the wave breaks, it dissipates energy in a cloud of homogeneous and isotropic turbulence with dissipation rate  $\unicode[STIX]{x1D716}=\unicode[STIX]{x1D712}(w^{3}/l)$, $\unicode[STIX]{x1D712}$ being a proportionality constant (Taylor Reference Taylor1935; Vassilicos Reference Vassilicos2015). If the turbulent cloud is cylindrical with cross-section $A$, then the energy dissipation rate per unit length of crest is $\unicode[STIX]{x1D716}_{l}=\unicode[STIX]{x1D70C}A\unicode[STIX]{x1D716}$, where $\unicode[STIX]{x1D70C}$ is the water density. Assuming that the energy dissipation depends only on the local breaking conditions, the physical parameters of the problem are the energy dissipation per unit length of breaking wave $\unicode[STIX]{x1D716}_{l}$ (with dimensions [ML/T $^{3}$], where M is mass, L is length and T is time), gravity $g$ [L/T $^{2}$], water kinematic viscosity $\unicode[STIX]{x1D708}$ [L $^{2}$/T], water density $\unicode[STIX]{x1D70C}$ [M/L $^{3}$], surface tension $\unicode[STIX]{x1D70E}$ [M/T $^{2}$], wave amplitude at breaking $h_{b}$ [L], undisturbed depth at breaking $d_{b}$ [L] and a reference depth $d_{0}$ [L], which sets the length scale. The beach slope $\unicode[STIX]{x1D6FC}$ (dimensionless) and initial amplitude $h_{0}$ [L] constitute initial conditions that are not directly associated with the dissipation at breaking; we consider these in more detail as a secondary focus in § 5. Following the deep-water literature, we also assume the viscosity and density ratios between the water and air phases are very large and do not significantly influence the dissipation (Drazen et al. Reference Drazen, Melville and Lenain2008; Deike et al. Reference Deike, Popinet and Melville2015, Reference Deike, Melville and Popinet2016). Thus, by Buckingham’s theorem, we form the five dimensionless parameters:
 $$\begin{eqnarray}\frac{\unicode[STIX]{x1D716}_{l}}{\unicode[STIX]{x1D70C}g^{3/2}d_{0}^{5/2}},\quad \frac{h_{b}}{d_{0}},\quad \frac{d_{b}}{d_{0}},\quad \frac{g^{1/2}d_{0}^{3/2}}{\unicode[STIX]{x1D708}}\equiv Re,\quad \frac{\unicode[STIX]{x1D70C}gd_{0}^{2}}{\unicode[STIX]{x1D70E}}\equiv Bo.\end{eqnarray}$$
 Assuming the breaking characteristics are independent of Reynolds number ( $Re$) and Bond number ( $Bo$), as they take sufficiently high values, this finds that the dimensionless energy depends only on local dimensionless amplitude and depth.
In order to connect this dimensional analysis with the isotropic turbulence estimate, our theoretical model must supply estimates for the turbulent integral length scale  $l$, the characteristic velocity scale $w$ and the turbulent cloud cross-section $A$ in terms of the breaking amplitude and depth. Following Drazen et al. (Reference Drazen, Melville and Lenain2008), we consider the impact velocity of the plunging breaker, which is calculated ballistically as $w=(2gh_{b})^{1/2}$. To estimate $l$, we recognize that for many shallow-water breakers, the undisturbed breaking depth $d_{b}/d_{0}<h_{b}/d_{0}$. Thus, unlike the deep-water case, for these cases we have $l/d_{0}\simeq d_{b}/d_{0}$ since $d_{b}/d_{0}$ sets the upper limit on the size of eddies that form from the breaking process. Finally, we estimate $A/d_{0}^{2}\propto (h_{b}/d_{0})^{2}$, since $h_{b}/d_{0}$ describes an effective diameter for the amount of available water supplied to the turbulent cloud. We thus obtain
 $$\begin{eqnarray}\frac{\unicode[STIX]{x1D716}_{l}}{\unicode[STIX]{x1D70C}g^{3/2}d_{0}^{5/2}}=\unicode[STIX]{x1D6FD}\left(\frac{h_{b}}{d_{0}}\right)^{7/2}\left(\frac{d_{b}}{d_{0}}\right)^{-1}\quad \text{or}\quad \unicode[STIX]{x1D716}_{l}=\unicode[STIX]{x1D6FD}\unicode[STIX]{x1D70C}g^{3/2}\frac{h_{b}^{7/2}}{d_{b}},\end{eqnarray}$$
 where  $\unicode[STIX]{x1D6FD}$ is a dimensionless constant. Note that when $d_{b}/d_{0}\simeq h_{b}/d_{0}$, the deep-water scaling is automatically recovered. For collapsing breakers, where the wave breaks directly onto the dry beach, $d_{b}/d_{0}$ has no meaning as a turbulent length scale and the model no longer applies. This theoretical argument applies most clearly to plunging breakers. While spilling breakers are similar energetically and dynamically to plunging breakers (Grilli et al. Reference Grilli, Svendsen and Subramanya1997; Pizzo & Melville Reference Pizzo and Melville2013; Deike et al. Reference Deike, Popinet and Melville2015), in the spilling cases where $h_{b}/d_{b}\ll 1$ it is likely that the largest eddies generated by the breaker do not approach $d_{b}$ in size and can instead be approximated by $l\sim h_{b}$, which again recovers the deep-water scaling. This argument does not extend to collapsing or surging waves.
3 Problem methodology and formulation
3.1 Numerical method
We use the Basilisk code, developed as the successor to Gerris by the same authors (Popinet Reference Popinet2003, Reference Popinet2009). The Basilisk package is a free software program that can be used to solve a variety of partial differential equation systems on regular adaptive Cartesian meshes (Popinet Reference Popinet2019). For this study we use it to solve the nonlinear incompressible Navier–Stokes (NS) equations in two phases with variable density and surface tension. The momentum equation is solved using the Bell–Colella–Glaz projection method (Bell, Colella & Glaz Reference Bell, Colella and Glaz1989), and the liquid–gas boundary is advected with a volume-of-fluid (VOF) advection scheme with momentum conservation. This VOF method has the advantage of maintaining a sharp representation of the interface, while minimizing the appearance of spurious numerical parasitic currents (Fuster & Popinet Reference Fuster and Popinet2018; Lopez-Herrera, Popinet & Castrejón-Pita Reference Lopez-Herrera, Popinet and Castrejón-Pita2019; van Hooft et al. Reference van Hooft, Popinet, van Heerwaarden, van der Linden, de Roode and van de Wiel2018). Surface tension is modelled with the method of Brackbill, Kothe & Zemach (Reference Brackbill, Kothe and Zemach1992) as further developed by Popinet (Reference Popinet2009). The Basilisk framework uses a quadtree-based adaptive mesh refinement scheme for computational efficiency. The refinement criterion is based on estimation of the discretization error of the velocity and VOF fields using a wavelet algorithm. The adaptive meshing significantly reduces the computational cost of representing a solitary wave which propagates within an extended physical domain at a high resolution.
For purposes of numerical comparison we also use the Green–Naghdi (GN) solver in the Basilisk package (Popinet Reference Popinet2015). The GN equations are depth-averaged, inviscid and model only the liquid phase, and hence are much simpler to solve. This solver is not intended to model the breaking event directly since the GN equations do not support overturning wave profiles, but rather to compare with the NS solver the nonlinear steepening process up to the breaking point. The one-dimensional mesh is refined on a bitree grid with an adaptivity scheme. Further methodological and implementation details on the Basilisk package can be found on the Basilisk website (Popinet Reference Popinet2019).

Figure 1. Schematic for the conditions at initialization and the point of breaking. When breaking, the leading interface of the wave develops a vertical tangent at  $x=x_{b}$ and time $t=t_{b}$, where the undisturbed water depth is $d_{b}$. The amplitude of the wave is $h_{b}$ measured at the instant at which the vertical tangent forms.
3.2 Formulation
Solitary waves are simple to initialize and the relevant local breaking parameters are easy to define. Consider such a wave travelling over a uniform water depth  $d_{0}$, setting the length scale, with amplitude $h_{0}$, in the direction $x$, approaching a beach with uniform slope $\unicode[STIX]{x1D703}$ (see figure 1). The wave is initialized at a distance $x_{w}=5d_{0}$ from the left boundary using the exact soliton solution to the GN equations (Le Métayer, Gavrilyuk & Hank Reference Le Métayer, Gavrilyuk and Hank2010):
 $$\begin{eqnarray}\displaystyle & \displaystyle \unicode[STIX]{x1D702}(x)=h_{0}\,\text{sech}^{2}\left((x-x_{w})\sqrt{\frac{3h_{0}}{4d_{0}^{3}\left(1+\displaystyle \frac{h_{0}}{d_{0}}\right)}}\right), & \displaystyle\end{eqnarray}$$
 $$\begin{eqnarray}\displaystyle & \displaystyle u_{x}(x)=\frac{c\unicode[STIX]{x1D702}(x)}{d_{0}+\unicode[STIX]{x1D702}(x)},\quad u_{y}(x,y)=\frac{c(y+d_{0})}{d_{0}+\unicode[STIX]{x1D702}(x)}\frac{\unicode[STIX]{x2202}\unicode[STIX]{x1D702}}{\unicode[STIX]{x2202}x}\left(1-\frac{\unicode[STIX]{x1D702}}{d_{0}+\unicode[STIX]{x1D702}_{0}}\right), & \displaystyle\end{eqnarray}$$
 where  $u_{y}$ is determined from $u_{x}$ by quadrature of the incompressibility condition and enforcing $u_{y}(y=-d_{0})=0$. To avoid confusion with the GN equations themselves, which are used to produce some results for comparisons in this study, we refer to (3.1) as the Green–Naghdi soliton (GNS) solution. The wave phase speed is $c/c_{0}=\sqrt{(1+h_{0}/d_{0})}$, where the linear speed $c_{0}=\sqrt{gd_{0}}$ is the reference velocity scale. Together with the length scale $d_{0}$, this defines the time scale $t_{0}=\sqrt{d_{0}/g}$. The initial air velocity is zero. The bathymetry transitions from uniform flatness to a uniform slope at $x=L_{c}=10d_{0}$.
The parameter space in this problem comprises the initial wave amplitude  $h_{0}/d_{0}$ and the slope $\unicode[STIX]{x1D703}$. In practice, we define the slope using $\unicode[STIX]{x1D6FC}=\tan \unicode[STIX]{x1D703}$ (Grilli et al. Reference Grilli, Svendsen and Subramanya1997). In this problem, we sweep the space defined by $\unicode[STIX]{x1D6FC}=2^{\circ }{-}7^{\circ }$ and $h_{0}/d_{0}=0.1{-}0.6$. We also consider a single case at $\unicode[STIX]{x1D6FC}=1^{\circ }$, $h_{0}/d_{0}=0.1$ as a weak spilling breaker for a qualitative comparison with the other cases (see § 4).
The surface tension  $\unicode[STIX]{x1D70E}$ is set by the Bond number, $Bo=\unicode[STIX]{x0394}\unicode[STIX]{x1D70C}gd_{0}^{2}/\unicode[STIX]{x1D70E}=1000$, with $\unicode[STIX]{x1D70C}_{air}/\unicode[STIX]{x1D70C}=1/850$ the ratio of air density to water density. To set the water viscosity, we set a Reynolds number $Re=c_{0}d_{0}/\unicode[STIX]{x1D708}=40\,000$, where $\unicode[STIX]{x1D708}$ is the water kinematic viscosity. These definitions of $Re$ and $Bo$ are used to define the viscosity and surface tension in terms of scales that remain constant across the parameter space we explore in this paper. On scales of the dissipative structures induced by the breaking wave, the turbulent Reynolds number may be smaller. If compared to air–water systems, this value of $Re$ corresponds to waves over a depth of approximately 5 cm and amplitudes ranging over 0.5–3 cm. We nevertheless expect that Reynolds-number effects should not fundamentally alter the basic nature of the scaling we have derived.
We use the air–water viscosity ratio,  $\unicode[STIX]{x1D707}_{air}/\unicode[STIX]{x1D707}=1.955\times 10^{-2}$, where $\unicode[STIX]{x1D707}=\unicode[STIX]{x1D70C}\unicode[STIX]{x1D708}$. The domain size $L_{0}$ is chosen so that the wave can reach its maximum runup point within it. We set $L_{0}=50d_{0}$, and the effective mesh size $\unicode[STIX]{x0394}x$ varies with the initial wave amplitude. For $h_{0}/d_{0}=0.6$ we choose $\unicode[STIX]{x0394}x=L_{0}/2^{13}$; for $0.6>h_{0}/d_{0}\geqslant 0.15$, we choose $\unicode[STIX]{x0394}x=L_{0}/2^{14}$; and for $h_{0}/d_{0}=0.1$, we choose $\unicode[STIX]{x0394}x=L_{0}/2^{15}$. For the $\unicode[STIX]{x1D6FC}=1^{\circ }$ case, we set $L_{0}=100d_{0}$ to allow the wave sufficient space to break, and concomitantly set $\unicode[STIX]{x0394}x=L_{0}/2^{16}$ to maintain the effective resolution. The mesh cells are square, so that $\unicode[STIX]{x0394}x=\unicode[STIX]{x0394}y$.
These choices are related to the numerical convergence of the problem. An effective resolution of  $2^{14}$ implies $\unicode[STIX]{x0394}x=L_{0}/2^{14}\simeq 3\times 10^{-3}d_{0}$ at the smallest physical scales. A key physical feature in the problem is the viscous boundary layer, of thickness $\unicode[STIX]{x1D6FF}$, at the wave surface (Deike et al. Reference Deike, Popinet and Melville2015, Reference Deike, Melville and Popinet2016). Here we adapt Batchelor’s estimate applied to the defining length scale in the flow, $\unicode[STIX]{x1D6FF}\sim d_{0}/\sqrt{Re}=5\times 10^{-3}d_{0}$. An alternative estimate uses the wave amplitude, so that $\unicode[STIX]{x1D6FF}\sim h_{0}/\sqrt{\vphantom{\unicode[STIX]{x1D6F7}}Re_{h_{0}}}$, where $Re_{h_{0}}=Re\,h_{0}/d_{0}$, yields $\unicode[STIX]{x1D6FF}\simeq 2.7\times 10^{-3}d_{0}$ at $h_{0}/d_{0}=0.3$, for example. These estimates thus suggest that we resolve the viscous sublayer with up to two grid cells. From previous studies (Deike et al. Reference Deike, Popinet and Melville2015, Reference Deike, Melville and Popinet2016), and keeping in mind that such orders of estimates of the viscous boundary layer are only approximate, these mesh sizes should allow us to resolve the dissipation rate associated with the breaking waves. Note that the Kolmogorov microscale can be estimated as $\unicode[STIX]{x1D702}_{K}=(\unicode[STIX]{x1D708}^{3}/\unicode[STIX]{x1D716})^{1/4}$, and, for typical values in the turbulent cloud, this leads to $\unicode[STIX]{x1D702}_{K}$ being of the order of $5\times 10^{-4}d_{0}$.
Direct measurement of the numerical convergence is done on the energy budget of the system. The kinetic and gravitational potential energies,  $E_{k}$ and $E_{p}$, are
 $$\begin{eqnarray}E_{k}=\frac{1}{2}\int _{V}\unicode[STIX]{x1D70C}|\mathbf{u}\boldsymbol{\cdot }\mathbf{u}|\,\text{d}V,\quad E_{p}=\int _{V}\unicode[STIX]{x1D70C}gy\,\text{d}V-E_{p0},\quad E=E_{k}+E_{p},\end{eqnarray}$$
 with  $E_{0}=E(t=t_{0})$. The integrals are computed over the entire liquid phase and do not include the gas phase. The quantity $E_{p0}$ is the potential energy of the undisturbed mass of liquid. There is also a surface tension energy contribution, which we neglect in this study, since it has been shown to be negligible at high Bond numbers in deep-water breakers (Deike et al. Reference Deike, Popinet and Melville2015). The non-conservative energy dissipation from the action of viscosity, $E_{d}$, can be calculated directly from the deformation tensor
 $$\begin{eqnarray}E_{d}(t)=\int _{0}^{t}\int _{V}\unicode[STIX]{x1D707}\frac{\unicode[STIX]{x2202}u_{i}}{\unicode[STIX]{x2202}x_{j}}\frac{\unicode[STIX]{x2202}u_{j}}{\unicode[STIX]{x2202}x_{i}}\,\text{d}V\,\text{d}t^{\prime },\end{eqnarray}$$
 such that the total conserved energy budget is given by  $E_{t}=E_{k}+E_{p}+E_{d}=E_{m}+E_{d}$, where $E_{m}=E_{k}+E_{p}$ is the conservative part of the total energy. The energy dissipation rate due to the breaking wave is thus defined as $\unicode[STIX]{x1D716}_{l}=\unicode[STIX]{x0394}E/\unicode[STIX]{x0394}t$, where $\unicode[STIX]{x0394}t$ is the active breaking time and $\unicode[STIX]{x0394}E$ is a change in energy determined from either a decrease in $E_{m}$ or an increase in $E_{d}$.

Figure 2. Grid convergence of energy budget for case  $\unicode[STIX]{x1D6FC}=3^{\circ },~h_{0}/d_{0}=0.3$: dotted, $2^{13}$; dashed, $2^{14}$; solid, $2^{15}$. Bottom to top on the right for a given resolution: kinetic energy $E_{k}$, gravitational potential energy $E_{p}$, their sum $E_{m}$, and the total energy $E_{t}=E_{m}+E_{d}$ including the dissipation $E_{d}$ calculated from (3.4).
We show that numerical convergence is achieved if  $\unicode[STIX]{x1D716}_{l}$ is calculated based on the conservative energy, that is $\unicode[STIX]{x0394}E=|\unicode[STIX]{x0394}E_{m}|$. The energy budgets for the plunging wave case $\unicode[STIX]{x1D6FC}=3^{\circ },~h_{0}/d_{0}=0.3$ at different effective resolutions are presented in figure 2. For each resolution are plotted $E_{p},~E_{k},~E_{m}$ and $E_{d}$. Out of these four energies, the first three are indeed satisfactorily converged at the resolution of $2^{14}$, while the dissipated energy $E_{d}$ is not, the total budget missing between 10 % and 15 % for the highest tested resolution and between 15 % and 20 % for the intermediate resolution. This error, however, appears reasonable regarding the large variations of $\unicode[STIX]{x1D716}_{l}$ in the range of controlling parameters we explore. This suggests that two grid cells is not enough to fully capture the dissipated energy directly; however, since the wave dissipation rate $\unicode[STIX]{x1D716}_{l}$ can be calculated from $E_{m}$ directly, the primary physical result, the turbulent dissipation rate $\unicode[STIX]{x1D716}_{l}$, is grid-converged nonetheless. We also remark that we numerically regularly recover up to 90 % of the total energy budget, so that full energy conservation is nearly attained in any case. Thus we define the derived dissipation rate as
 $$\begin{eqnarray}\unicode[STIX]{x1D716}_{l}=|\unicode[STIX]{x0394}E_{m}|/\unicode[STIX]{x0394}t,\end{eqnarray}$$
 which is numerically converged to 5 % for the tested cases. Details on the measurement of  $\unicode[STIX]{x0394}t$ are discussed in § 4. These results suggest that 50–100 mesh points within the amplitude of the initial wave are sufficient for our purpose. For the amplitude $h_{0}/d_{0}=0.1$, we therefore use the resolution $2^{15}$, and for $h_{0}/d_{0}=0.6$ it suffices to use $2^{13}$.
Because of the large range of scales involved, and since these results are grid-converged, we refer to them as DNS. However, we remark that, since the numerical methods employed by Basilisk are not energy-conserving by construction, it is difficult to recover the full energy budget including dissipation from the deformation tensor in our simulations. But it is consistent with other DNS of breaking waves and turbulent multiphase problems with interface reconnection (Elghobashi Reference Elghobashi2019) and use in the literature (Scardovelli & Zaleski Reference Scardovelli and Zaleski1999; Iafrati, Babanin & Onorato Reference Iafrati, Babanin and Onorato2013; Deike et al. Reference Deike, Popinet and Melville2015, Reference Deike, Melville and Popinet2016), and in the sense that our computed dissipation rate  $\unicode[STIX]{x1D716}_{l}$ is grid-converged and would not be improved by the use of subgrid-scale models such as those used by Lubin & Caltagirone (Reference Lubin and Caltagirone2010), Derakhti & Kirby (Reference Derakhti and Kirby2016) and Derakhti et al. (Reference Derakhti, Banner and Kirby2018). Also, this approach led to computations of the dissipation rate in good agreement with that derived from laboratory experiments on deep-water breakers (Iafrati Reference Iafrati2011; Deike et al. Reference Deike, Popinet and Melville2015, Reference Deike, Melville and Popinet2016; Derakhti & Kirby Reference Derakhti and Kirby2016). Note that the transfer of energy to the air is negligible in the present energy budget, with the dissipation rate in the air always remaining below 7 % of that in the water.
3.3 Solitary-wave verification
Since the soliton initialization (3.1) is an exact solution of the GN equations (in uniform bathymetry), but not of the two-phase viscous NS equations with surface tension, we first examine the behaviour of the solitary wave produced. Indeed, in the numerical solution of the NS equations, there appear initial transients in the solitary-wave amplitude of up to 5 %. After the initial transients, the solitary wave retains an amplitude close to the nominal value, apart from a slight decay due to viscous drag in the bottom boundary layer and the surface boundary layers, before undergoing nonlinear steepening and breaking in the presence of the varying bathymetry.

Figure 3. Comparison of wave steepening for various cases. (a) Amplitude evolution over time until breaking for NS and GN solvers for case  $h_{0}/d_{0}=0.3$, $\unicode[STIX]{x1D6FC}=2.86^{\circ }$. The NS solver is very consistent with the resolution of the GN equations during the steepening of the wave. (b) Amplitude–depth dependence on depth for both solvers, with experimental data from Synolakis & Skjelbreia (Reference Synolakis and Skjelbreia1993) and the so-called ‘Green’s law’ theoretical exponent. Experimental and numerical data are very close and follow the theoretical scaling. (c) Amplitude–depth dependence on distance travelled for the NS solver, with experimental data from Camfield & Street (Reference Camfield and Street1969b), where $1:22$ and $1:33$ correspond to $\unicode[STIX]{x1D6FC}\simeq 2.6^{\circ }$ and $1.74^{\circ }$, respectively, also showing ‘Green’s law’ exponent. Again, good agreement between the NS data, experiments and the theoretical scaling is observed.
We verify briefly the amplitude increase of the wave in the presence of the beach. Figure 3(a) shows the case  $h_{0}/d_{0}=0.3$ on a beach of slope $\unicode[STIX]{x1D6FC}=2.86^{\circ }$ using the NS and GN solvers. The NS solution indicates an initial decay in wave amplitude, probably associated with dissipation due to the bottom boundary layer, before increasing monotonically over $x$ until breaking just after reaching its maximum value at approximately $x/d_{0}=25$. In this case the solitary wave encounters the toe of the beach at approximately $t/t_{0}=4.5$. The GN solution is similar, but it shows an initial amplitude increase before the wave encounters the beach at $x/d_{0}=L_{c}/d_{0}=10$. The GN solution also reaches a maximum amplitude at close to $x/d_{0}=25$, but fails to represent breaking properly, since it does not allow for multivalued wave heights. However, prior to breaking, the two solvers are in reasonable agreement. Figure 3(b) shows the theoretical ‘Green’s law’ result, which can be derived from the linear long-wave equation, that $h/d\propto (d/d_{0})^{-5/4}$ for shallow beaches. The theoretical aspects of the Green’s law scaling are discussed at length by Synolakis & Skjelbreia (Reference Synolakis and Skjelbreia1993) and this continues to be an active research topic (Knowles & Yeh Reference Knowles and Yeh2018). The experimental data of Synolakis & Skjelbreia (Reference Synolakis and Skjelbreia1993) for the case $h_{0}/d_{0}=0.3$, $\unicode[STIX]{x1D6FC}=2.86^{\circ }$ are also included for the comparison, which is very good; the GN and NS solutions are indistinguishable and lie on top of the experimental data for most of the evolution. Data showing good comparison with a different set of experimental data (Camfield & Street Reference Camfield and Street1969b) are also included for amplitude variation over travel distance in figure 3(c). Finally, this excellent agreement between our numerical models and experimental data suggests that the uncertainty in the amplitude decay and initialization of the steady propagation problem does not affect the reliability of our wave amplitude evolution. These data lend confidence to the model with respect to the estimation of the conditions at the point of breaking, especially the breaking amplitude $h_{b}$ discussed in § 2. We are now ready to consider the energetics of the breaking wave, which requires a separate numerical verification.
In this study, our chosen ranges of  $\unicode[STIX]{x1D6FC}$ and $h_{0}/d_{0}$ allow the formation of a diversity of breaker types while remaining feasible for numerical solution. Waves in nature often steepen and break over shallower slopes in a process that may yield a different scaling from Green’s law above (Synolakis & Skjelbreia Reference Synolakis and Skjelbreia1993; Grilli et al. Reference Grilli, Svendsen and Subramanya1997; Knowles & Yeh Reference Knowles and Yeh2018). Likewise, we do not here consider very steep slopes, which appear in certain laboratory settings.
4 Breaking characteristics and energy dissipation
As the wave approaches the shore, it develops an asymmetric shape, steepens and may break in one of a variety of forms. Breaking is defined by the wave overturning: the interface profile  $\unicode[STIX]{x1D702}(x)$ becomes multivalued at some point $x=x_{b}$. The instant of breaking can thus be defined as the time at which the tangent to the interface becomes vertical at some point (Grilli et al. Reference Grilli, Svendsen and Subramanya1997; Perlin et al. Reference Perlin, Choi and Tian2013; Deike et al. Reference Deike, Popinet and Melville2015), although various dynamic and kinematic criteria are discussed in the literature (Perlin et al. Reference Perlin, Choi and Tian2013; Robertson et al. Reference Robertson, Hall, Zytner and Nistor2013). At this instant, the wave has an amplitude $h_{b}$, and the vertical face of the wave is at a point with undisturbed depth $d_{b}$. This instant is sketched schematically in figure 1.
There are four phases constituting the wave breaking process. First, the wave approaches the beach, developing an asymmetric profile and growth in amplitude (Synolakis & Skjelbreia Reference Synolakis and Skjelbreia1993; Knowles & Yeh Reference Knowles and Yeh2018). Second, the wave breaks by overturning or collapsing onto itself, depending on the type of breaker, and undergoes significant turbulent energy dissipation. Third, the wave runs up the beach to a maximum elevation, still seeing some turbulent dissipation. The influence of a viscous bottom boundary layer may be significant during this phase (Pedersen et al. Reference Pedersen, Lindstrøm, Bertelsen, Jensen, Laskovski and Sælevik2013; Arthur & Fringer Reference Arthur and Fringer2014). Finally, the wave retreats down the beach in a drawdown phase and may undergo secondary breaking.
Various types of breaker can be exhibited during the second phase. These are typically classed as plunging, spilling, collapsing and surging breakers. Plunging breakers exhibit an obvious jet projecting ahead of the wave bulk and ingesting a tube of air, while in spilling breakers the initial overturning process is localized to a very small portion of the wave surface. Nonetheless, spilling and plunging breakers are dynamically similar, with the overturning phenomenon merely taking place at different length scales (Grilli et al. Reference Grilli, Svendsen and Subramanya1997; Drazen et al. Reference Drazen, Melville and Lenain2008; Pizzo & Melville Reference Pizzo and Melville2013; Deike et al. Reference Deike, Popinet and Melville2015). Energetically, in this study we expect spilling and plunging breakers to behave similarly provided the turbulent cloud formed by the breaker extends to the sea bottom at depth  $d_{b}$.
This will only cease to be true for weak spilling breakers, such as the one in figure 4. Here, the wave steepens from its initial condition while maintaining a roughly constant speed (figure 4a), and collapses onto itself locally (figure 4b), forming a disturbed surface that propagates ahead down the wave face (figure 4c,d). This disturbance develops in turn a turbulent dissipation cloud, which remains localized underneath the wave (figure 4e,f). Some vortices are formed in this cloud, which trail behind the breaking portion of the wave. The key feature of this weak spilling breaker is that the turbulent cloud formed by this breaker does not extend to the bottom (figure 4g,h). This description is essentially similar to those of spilling breakers observed in deep-water conditions (Deike et al. Reference Deike, Popinet and Melville2015). Such weak breakers will develop for small amplitude and small beach slope, while the present study will focus on stronger breakers obtained for steeper slope and higher amplitude.

Figure 4. Sequence of the breaking event for the weak spilling breaker case  $\unicode[STIX]{x1D6FC}=1^{\circ }$, $h_{0}/d_{0}=0.1$, coloured by vorticity content in the liquid phase: (a) $t/t_{0}=58$, (b) $t/t_{0}=59$, (c) $t/t_{0}=60$, (d) $t/t_{0}=61$, (e) $t/t_{0}=62$, (f) $t/t_{0}=63$, (g) $t/t_{0}=64$ and (h) $t/t_{0}=65$. During the breaking event, the mixing zone does not reach the seabed and is thus not bounded by the depth, hence (2.2) does not apply. (Movies of all achieved breaker types are available in the supplementary movies.)

Figure 5. Sequence of the breaking event for the strong spilling breaker case  $\unicode[STIX]{x1D6FC}=2^{\circ }$, $h_{0}/d_{0}=0.15$, coloured by vorticity content in the liquid phase: (a) $t/t_{0}=30.0$, (b) $t/t_{0}=30.5$, (c) $t/t_{0}=31.0$, (d) $t/t_{0}=31.5$, (e) $t/t_{0}=32.0$, (f) $t/t_{0}=32.5$, (g) $t/t_{0}=34.0$ and (h) $t/t_{0}=36.0$. Active breaking time occurs between $t_{1}^{b}=30.5$ and $t_{2}^{b}=40.6$. The mixing zone at the impact zone reaches the seabed so that the model (2.2) applies. (Movies of all achieved breaker types are available in the supplementary movies.)
A stronger spilling breaker is shown in figure 5. After steepening in a similar fashion (figure 5a), it develops a locally vertical interface (figure 5b), which is more easily distinguishable than it is in the weak spilling breaker above, and breaks down the water surface ahead of the wave (figure 5c,d). The breaking wave is violent enough to create a splash-up directly ahead of the wave (figure 5e,f), and the resulting turbulent cloud is immediately limited by the water depth (figure 5g,h), before proceeding to run up the beach, losing kinetic energy in exchange for gravitational potential energy (figure 5h).
Next, a plunging breaker is shown in figure 6. Again, the wave steepens from its initial condition (figure 6a), but now the overturning process is very well distinguished; the interface becomes multivalued at the breaking point, and a jet is produced (figure 6b,c). This jet projects ahead of the wave body and impacts on the water surface ahead of the wave (figure 6d), causing a more dramatic splash-up than in the spilling breaker case (figure 6e,f). The resulting mixing phase is vigorous, and the turbulent cloud is clearly bounded by the depth underneath the wave (figure 6g). Finally, this intense dissipative phase gives way to the runup onto the beach (figure 6h). This is the most prevalent type of breaker in this study, with spilling breakers only appearing at small beach slopes and wave amplitudes, but (2.2) is applicable to each wave in figures 5 and 6.
Collapsing and surging breakers appear at large beach slopes and small wave amplitudes, that is, for large values of the slope parameter  $S_{0}=\unicode[STIX]{x1D6FC}\unicode[STIX]{x1D706}_{0}/d_{0}$, where $\unicode[STIX]{x1D706}_{0}$ is a representative wavelength (Grilli et al. Reference Grilli, Svendsen and Subramanya1997). (In contrast to Grilli et al. (Reference Grilli, Svendsen and Subramanya1997), who use a different definition for spilling breakers, $S_{0}$ does not distinguish between spilling and plunging breakers in the present study.) The collapsing breakers resemble strong plungers where the toe projects directly onto the beach, while at the largest values of $S_{0}$, surging waves form that reach the dry beach before properly overturning. Figure 7 shows example stills of collapsing and surging breakers, respectively, when they hit the beach. Movies of all breaker types are available in the supplementary movies available at https://doi.org/10.1017/jfm.2020.83.

Figure 6. Sequence of the breaking event for the plunging breaker case  $\unicode[STIX]{x1D6FC}=3^{\circ },~h_{0}/d_{0}=0.3$, coloured by vorticity content in the liquid phase: (a) $t/t_{0}=17.9$, (b) $t/t_{0}=18.5$, (c) $t/t_{0}=19.0$, (d) $t/t_{0}=19.5$, (e) $t/t_{0}=20.0$, (f) $t/t_{0}=20.5$, (g) $t/t_{0}=22.0$ and (h) $t/t_{0}=23.0$. Active breaking time occurs between $t_{1}^{b}=17.95$ and $t_{2}^{b}=26.3$. (Movies of all achieved breaker types are available in the supplementary movies.)

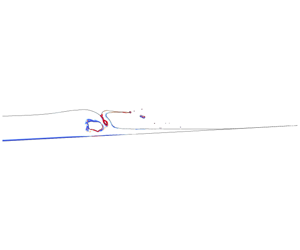
Figure 7. Snapshots of breaker types during breaking, coloured by vorticity content in the liquid phase: (a) collapsing breaker,  $\unicode[STIX]{x1D6FC}=6^{\circ },~h_{0}/d_{0}=0.5$; and (b) surging breaker, $\unicode[STIX]{x1D6FC}=7^{\circ },~h_{0}/d_{0}=0.2$.

Figure 8. Energy budgets for various cases showing kinetic energy  $E_{k}$ (dotted), gravitational potential energy $E_{p}$ (dashed) and their sum $E_{m}$ (thick solid): (a) mild breaker, $\unicode[STIX]{x1D6FC}=2^{\circ },~h_{0}/d_{0}=0.2$; (b) plunging breaker, $\unicode[STIX]{x1D6FC}=3^{\circ },~h_{0}/d_{0}=0.3$; and (c) collapsing breaker, $\unicode[STIX]{x1D6FC}=6^{\circ }$, $h_{0}/d_{0}=0.4$. Upright lines: beginning and end markers for active breaking time.
We now discuss the energy budget, focusing on the strong dissipation in the breaking phase. In the transition from the active breaking to the runup phase, the dominant mechanism of dissipation transitions from turbulence to bottom boundary layer friction, with significant overlap between them. Therefore, the breaking time must be chosen judiciously so that the bottom boundary layer friction during runup does not influence the calculation of the dissipation during breaking. By contrast, Li & Raichlen (Reference Li and Raichlen2001), for example, used a control volume approach to estimate the energy loss  $\unicode[STIX]{x0394}E$ directly from the breaking process, which absorbed boundary layer effects during runup, since these were assumed to have negligible contribution to the total energy loss.
Figure 8(a–c) shows the energy budget for various cases for a period of time extending through three phases of the breaking process and part of the fourth. Initially, during the approach phase,  $E_{k}$ and $E_{p}$ remain roughly stable after the initial transient, showing a decay corresponding to viscous effects. Just after the breaking time $t_{1}^{b}$ (defined as the time at the instant at which the face of the wave becomes vertical), $E_{k}$ abruptly peaks and $E_{p}$ rapidly decreases. For consistency we define the end of the active breaking period as the time at which $E_{k}=E_{p}$. This moment is denoted $t_{2}^{b}$, with energy $E_{2}$, and marks the latest easily identifiable time in the energy budget, which is not dominated by bottom boundary layer dissipation, as figure 8 shows. Shortly before $t_{2}^{b}$, $E_{p}$ reaches a minimum and begins to increase, while $E_{k}$ steadily decreases as the wave begins to climb the slope. Maximum runup is achieved at or before the maximum in $E_{p}$, which presents in figure 8(c) at $t\sqrt{g/d_{0}}\simeq 38$, and in figure 8(d) at $t\sqrt{g/d_{0}}\simeq 22$. Maximum runup does not always coincide with maximum $E_{p}$ or minimum $E_{k}$; we attribute this to roughness on the interface, ongoing turbulent motion within the liquid, and particularly to drawdown motion, which may have already begun at the moment of maximum runup. From figure 8, we define the per-length volumetric dissipation rate, or dissipation per unit length of the breaking crest, $\unicode[STIX]{x1D716}_{l}=\unicode[STIX]{x0394}E/\unicode[STIX]{x0394}t$, where $\unicode[STIX]{x0394}E=E_{b}-E_{2}$ and $\unicode[STIX]{x0394}t=t_{2}^{b}-t_{1}^{b}$. Note that both $t_{1}^{b}$ and the length of the active breaking time $\unicode[STIX]{x0394}t$ tend to decrease with increasing breaker strength characterized by $\unicode[STIX]{x1D6FC}$ and $h_{0}/d_{0}$. It is clear from figure 8 that, in certain configurations, the dissipation attained during the active breaking phase is much greater than the dissipation from other sources such as the bottom boundary layer (figure 8a,b), while in other cases, the subsequent events (runup, drawdown and secondary breaking) have a greater effect at later times (figure 8c). We restrict our discussion of dissipation rate to the active breaking period.

Figure 9. Dissipation rate scalings: variation of (a)  $\unicode[STIX]{x1D716}_{l}/\unicode[STIX]{x1D716}_{0}$ and (b) $(\unicode[STIX]{x1D716}_{l}/\unicode[STIX]{x1D716}_{0})(d_{b}/d_{0})=F(h_{b}/d_{0})$ as a function of wave amplitude $h_{b}/d_{0}$. In panel (b) the dashed line shows the fit $0.0281(h_{b}/d_{0})^{3.152}$ to the data for which $\unicode[STIX]{x1D6FC}\leqslant 5^{\circ }$. The inset shows $\unicode[STIX]{x1D716}_{l}/\unicode[STIX]{x1D716}_{0}\propto (h_{b}/d_{0})^{7/2}(d_{b}/d_{0})$. Panel (b) shows significant data collapse for $\unicode[STIX]{x1D6FC}=2^{\circ }{-}5^{\circ }$, confirming the validity of our theoretical scaling. Energy dissipation increases with wave breaking amplitude and increasing beach slope.
Figure 9 shows  $\unicode[STIX]{x1D716}_{l}/\unicode[STIX]{x1D716}_{0}$ plotted with respect to the local conditions of breaking, where $\unicode[STIX]{x1D716}_{0}=\unicode[STIX]{x1D70C}g^{3/2}d_{0}^{5/2}$ is a normalizing dissipation rate constant. Figure 9(a) shows the variation over local breaking height $h_{b}/d_{0}$. A correlation is present, with the dissipated energy increasing with the local wave height at breaking – that is, with the available potential energy at breaking – for any constant beach slope. Moreover, the dissipation rate increases with $\unicode[STIX]{x1D6FC}$. Figure 9(b) shows the scaling (2.2), $\unicode[STIX]{x1D716}_{l}d_{b}/(\unicode[STIX]{x1D716}_{0}/d_{0})$, as a function of $h_{b}/d_{0}$, exhibiting a clear data collapse for $\unicode[STIX]{x1D6FC}\leqslant 5^{\circ }$. At high $\unicode[STIX]{x1D6FC}$, collapsing and surging breakers are produced, shown by red diamonds and yellow crosses, and the theoretical scaling (2.2) is not expected to hold. The dashed line shows a power-law fit on the collapsed portion of the data, which is slightly below the expected exponent. The inset of figure 9(b) shows the data rescaled exactly according to (2.2) and reasonable agreement is still observed. This good agreement between our theoretical scaling from § 2 and the numerical data obtained is the central result of our paper.
5 Relation to initial conditions
Finally, we relate the scalings obtained in § 4 to the initial conditions and derive a relationship for the breaking parameter  $b$ (Duncan Reference Duncan1981; Drazen et al. Reference Drazen, Melville and Lenain2008), as defined for deep-water breaking waves. Figure 9 shows that the dissipation rate can be described as a function of the local conditions at breaking, $\unicode[STIX]{x1D716}_{l}/\unicode[STIX]{x1D716}_{0}(h_{b}/h_{0},d_{b}/d_{0})$, reflecting the relationship found in § 2, equation (2.2). Now we seek a dependence of the dissipation on the initial conditions of the solitary wave, which requires first a dimensional analysis and description of $h_{b}/d_{0}$ and $d_{b}/d_{0}$ as a function of the initial conditions. In addition to $\unicode[STIX]{x1D716}_{l},~g,~\unicode[STIX]{x1D70C},~d_{0},~h_{b},~d_{b},~\unicode[STIX]{x1D708}$ and $\unicode[STIX]{x1D70E}$, the initial amplitude $h_{0}$ and beach slope $\unicode[STIX]{x1D6FC}$ are also included. The latter is already non-dimensional, and $h_{0}/d_{0}$ forms the remaining dimensionless group. Thus, we seek $h_{b}/d_{0}=\unicode[STIX]{x1D6F9}_{h}(h_{0}/d_{0},\unicode[STIX]{x1D6FC})$ and $d_{b}/d_{0}=\unicode[STIX]{x1D6F9}_{d}(h_{0}/d_{0},\unicode[STIX]{x1D6FC})$, and then use (2.2) together with these new relationships to determine the energetic scaling with respect to the initial conditions, still assuming for the purposes of this theory development that there is no dependence on the Bond or Reynolds numbers.
We seek the dependences  $\unicode[STIX]{x1D6F9}_{h}$ and $\unicode[STIX]{x1D6F9}_{d}$. The previous analysis of Grilli et al. (Reference Grilli, Svendsen and Subramanya1997) focused on the role of the slope parameter, $S_{0}=\unicode[STIX]{x1D6FC}\unicode[STIX]{x1D706}_{0}/d_{0}\simeq 1.521\unicode[STIX]{x1D6FC}/\sqrt{h_{0}/d_{0}}$, and proposed empirical relationships on numerical and experimental data of $\unicode[STIX]{x1D6F9}_{h}$ and $\unicode[STIX]{x1D6F9}_{d}$ for spilling and plunging breakers. For our analysis, the use of the slope parameter is attractive since it is consistent with the dimensional analysis above. We set
 $$\begin{eqnarray}\tilde{S}_{0}=\frac{\unicode[STIX]{x1D6FC}^{q}}{\sqrt{h_{0}/d_{0}}},\end{eqnarray}$$
 where we allow the exponent on  $\unicode[STIX]{x1D6FC}$ to vary. The choice of Grilli et al. (Reference Grilli, Svendsen and Subramanya1997) corresponds with $q=1$, with the fit
 $$\begin{eqnarray}\frac{d_{b}}{d_{0}}=G_{1}\left(\frac{\tilde{S}_{0}}{h_{0}/d_{0}}\right)^{\unicode[STIX]{x1D701}_{1}}\quad \text{or}\quad \frac{d_{b}}{d_{0}}=G_{1}\left(\frac{\unicode[STIX]{x1D6FC}^{q}}{(h_{0}/d_{0})^{3/2}}\right)^{\unicode[STIX]{x1D701}_{1}},\end{eqnarray}$$
 for  $\tilde{S}_{0}<0.3$, where Grilli’s fit has the non-dimensional constant $G_{1}=0.149$ and exponent $\unicode[STIX]{x1D701}_{1}=-0.523$. We aim to improve this fit using our numerical dataset.
In the following, for  $h_{0}/d_{0}$ we consider the wave amplitude measured at the time $t=8\sqrt{g/d_{0}}$ instead of the nominal initial amplitude. This minimizes the effect of the initial transients, most of which have disappeared by this time. Proceeding then, figure 10(a) shows equation (5.2) for the choice $q=2,~\unicode[STIX]{x1D701}_{1}=-152/225\simeq -0.676$, which is close to $-2/3$, with the basic result of Grilli ( $q=1,\unicode[STIX]{x1D701}_{1}=-0.523$, close to $-1/2$), shown in the inset of figure 10(a). The collapse is reasonable for both cases, suggesting that there is some freedom in the choice of $q$ for $d_{b}/d_{0}$. The particular choice $q=2,~\unicode[STIX]{x1D701}_{1}\simeq -0.676$ leads to better collapse in the other scalings, as discussed below. Note that values of $q$ between 1 and 2.5 and $\unicode[STIX]{x1D701}_{1}$ between $-1/2$ and $-1$ can lead to reasonable rescaling of the data for the breaking depth. Our particular choice will be justified a posteriori by the success of also rescaling the breaking height and the dissipation rate in a consistent way. Thus our scaling for the breaking depth is a modified form of Grilli’s result.

Figure 10. Scalings for the wave parameters at breaking (a,b), and energy dissipation (c,d) with respect to initial (offshore) conditions. (a) Breaking depth  $d_{b}/d_{0}$ from (5.2) with $q=2,~\unicode[STIX]{x1D701}_{1}=-152/225\simeq -0.676$. (b) Breaking amplitude, $h_{b}/d_{0}$ from (5.4) with the parameter choice of (a) and $p=-289/420\simeq -0.688$. Upper left inset in (b): scaling $h_{b}/d_{b}$ from Grilli et al. (Reference Grilli, Svendsen and Subramanya1997) with $q=1,~\unicode[STIX]{x1D701}_{1}=-0.523$. Lower right inset in (b): scaling of (5.4) with $q=1,~p=0,~\unicode[STIX]{x1D701}_{1}=-152/225\simeq -0.676$. (c) Plot of $\unicode[STIX]{x1D716}_{l}/\unicode[STIX]{x1D716}_{0}$ scaled as in the first of equations (5.5) with $s=1/8,~\unicode[STIX]{x1D709}=8/5$. (d) Breaking parameter $b$ scaled as in the second of equations (5.5) with the parameter choice of (c). Solid line (all plots): linear plot for comparison.
To obtain the breaking amplitude, we depart from the proposed fit of Grilli et al. (Reference Grilli, Svendsen and Subramanya1997) and instead consider the Green’s law scaling discussed in § 3.3, which can be written as  $h_{b}/d_{0}\propto (d_{b}/d_{0})^{-1/4}$. As figure 3 shows, while the law is robust for most of the amplitude evolution from the toe of the beach, it does not exactly capture the breaking amplitude of the wave. The naive choice $h_{b}/d_{0}=(h_{0}/d_{0})(d_{b}/d_{0})^{-1/4}$, with (5.2) substituted, is plotted as the lower-right inset in figure 10(b), showing that the data are not properly collapsed. But comparison of the $1:22$ and $1:33$ results in figure 3(b) suggests that there is a slight effect of $\unicode[STIX]{x1D6FC}$ on the departure of the steepening curve from the true Green’s law scaling near the point of breaking. Hence we propose the scaling law
 $$\begin{eqnarray}\frac{h_{b}}{d_{0}}=\unicode[STIX]{x1D6FD}_{2}^{\prime }\unicode[STIX]{x1D6FC}^{p}\frac{h_{0}}{d_{0}}\left(\frac{d_{b}}{d_{0}}\right)^{-1/4},\end{eqnarray}$$
 where  $\unicode[STIX]{x1D6FD}_{2}^{\prime }$ is a dimensionless constant and the exponent $p$ on $\unicode[STIX]{x1D6FC}$ is a free parameter. Substituting for (5.2) we obtain
 $$\begin{eqnarray}\frac{h_{b}}{d_{0}}=\unicode[STIX]{x1D6FD}_{2}\unicode[STIX]{x1D6FC}^{r}\left(\frac{h_{0}}{d_{0}}\right)^{\unicode[STIX]{x1D701}_{2}},\quad \unicode[STIX]{x1D701}_{2}=1+3\unicode[STIX]{x1D701}_{1}/8,\quad r=p-\unicode[STIX]{x1D701}_{1}q/4.\end{eqnarray}$$
 The resulting amplitude scaling, with  $q=2,~p=-289/420\simeq -0.689$, which is close to $-2/3$, and $\unicode[STIX]{x1D701}_{1}=-152/225\simeq -0.676$ (hence $\unicode[STIX]{x1D701}_{2}=56/75\simeq 0.747$, close to $3/4$) is plotted in figure 10, showing good collapse of the numerical data. On the other hand, the naive choice for the exponent on $\unicode[STIX]{x1D6FC}$, $q=1,~p=0$ so that $r=38/225\simeq 0.169$, still with $\unicode[STIX]{x1D701}_{1}\simeq -0.676$, is shown in the lower-right inset, not showing data collapse. However, any choice of $q$ that reasonably describes the depth at breaking $d_{b}$ can be made compatible with figure 10(b) by appropriate choice of $p$ such that $r$ remains unchanged, for example. Our choice $q=2,~p=-289/420$ obtaining $r=-2207/6300\simeq -0.351$ is thus not unique, but the form of the power-law scaling is in any case effective. Values for $r$ that admit collapse of these data may range between $-1/4$ and $-1/2$. By comparison, Grilli’s exponential scaling is shown in the upper-left inset of figure 10(b); the data are not collapsed and display a distinct slope for each $\unicode[STIX]{x1D6FC}$.
Note that, while the breaking index  $h_{b}/d_{b}$ shown here is greater than the analytical prediction of ${\sim}0.8$ from solitary-wave theory due to McCowan (Reference McCowan1894), Yamada & Shiotani (Reference Yamada and Shiotani1968) and Tanaka et al. (Reference Tanaka, Dold, Lewy and Peregrine1987), it is qualitatively consistent with the literature (e.g. Grilli et al. Reference Grilli, Svendsen and Subramanya1997) on solitary waves shoaling on plane beaches. Moreover, the predictions in question were derived for solitary waves propagating over uniform bathymetry, unlike the waves in this study. Besides Grilli et al. (Reference Grilli, Svendsen and Subramanya1997), some experimental studies of solitary waves on shallow beaches, such as Camfield & Street (Reference Camfield and Street1969a), propose a dependence of $h_{b}/d_{b}$ solely on the beach slope $\unicode[STIX]{x1D6FC}$. In particular, they propose a model that yields breaker indices greater than unity. Other definitions are often derived for progressive waves and include dependences such as the wavelength and wave period, which are not strictly well defined for solitary waves. The picture is further complicated by variation in the definitions for what constitutes breaking. See Robertson et al. (Reference Robertson, Hall, Zytner and Nistor2013), which includes a lengthy comparison of different models for the breaking parameter. To our knowledge, however, the Green’s law scaling has not been used in a model for the breaking index for breaking waves of the type considered in this study.
A properly theoretical justification for (5.2)–(5.4) beyond the Green’s law scaling presented here has not, to our knowledge, been found and is beyond the scope of this study. However, as empirical scalings, they supply the necessary information to relate the dissipation  $\unicode[STIX]{x1D716}_{l}$, equation (2.2), to the initial conditions. Substituting (5.2) and (5.4) into (2.2), we obtain
 $$\begin{eqnarray}\frac{\unicode[STIX]{x1D716}_{l}}{\unicode[STIX]{x1D716}_{0}}=\unicode[STIX]{x1D6FD}_{3}\unicode[STIX]{x1D6FC}^{s}\left(\frac{h_{0}}{d_{0}}\right)^{\unicode[STIX]{x1D709}},\quad b=\unicode[STIX]{x1D6FD}_{3}\left(\frac{\sqrt{gd_{0}}}{c}\right)^{5}\unicode[STIX]{x1D6FC}^{s}\left(\frac{h_{0}}{d_{0}}\right)^{\unicode[STIX]{x1D709}},\end{eqnarray}$$
where
 $$\begin{eqnarray}s=\frac{7p}{2}-\frac{15\unicode[STIX]{x1D701}_{1}q}{8},\quad \unicode[STIX]{x1D709}=\frac{7}{2}+\frac{45\unicode[STIX]{x1D701}_{1}}{16}\end{eqnarray}$$
 and  $\unicode[STIX]{x1D6FD}_{3}$ is a dimensionless constant depending on the pre-constant $\unicode[STIX]{x1D712}$ for turbulent dissipation and the precise proportionality constant in the estimates leading to (2.2). To recapitulate, a range of values of $p$ and $q$ can be chosen provided $-1/2\lessapprox r\lessapprox -1/4$ and $1\lessapprox q\lessapprox 2.5$, while keeping $-1\lessapprox \unicode[STIX]{x1D701}_{1}\lessapprox -1/2$. Here we have chosen $p=-289/42$, $q=2$, $\unicode[STIX]{x1D701}_{1}=-152/225$ and $\unicode[STIX]{x1D701}_{2}=56/75$ so that $r=-2207/6300$.
The breaking parameter, defined as
 $$\begin{eqnarray}b=g\unicode[STIX]{x1D716}_{l}/(\unicode[STIX]{x1D70C}c^{5}),\end{eqnarray}$$
 is an alternative dimensionless representation of the energy dissipation, which is included here for the purpose of comparison with deep-water studies (Duncan Reference Duncan1981; Drazen et al. Reference Drazen, Melville and Lenain2008). With our choices of  $p,~q,~\unicode[STIX]{x1D701}_{1}$ from above, we obtain $\unicode[STIX]{x1D709}=8/5$ and $s=1/8$, leading to the following semi-empirical scaling for energy dissipation:
 $$\begin{eqnarray}\frac{\unicode[STIX]{x1D716}_{l}}{\unicode[STIX]{x1D716}_{0}}=\unicode[STIX]{x1D6FD}_{3}\unicode[STIX]{x1D6FC}^{1/8}\left(\frac{h_{0}}{d_{0}}\right)^{8/5},\quad b=\unicode[STIX]{x1D6FD}_{3}\left(\frac{\sqrt{gd_{0}}}{c}\right)^{5}\unicode[STIX]{x1D6FC}^{1/8}\left(\frac{h_{0}}{d_{0}}\right)^{8/5},\end{eqnarray}$$
 which is used in figure 10(c,d) and describes well the numerical data. In particular, the rescaling of the dissipation rate is excellent. This shows similar data to those of figure 9(b), except that the initial conditions are used to predict the breaking conditions, with good collapse. These results, combining a local inertial turbulent argument and dimensional analysis to relate to far-field conditions, give a predictive dissipation rate for breaking solitary waves in shallow water and should prompt further theoretical studies. We note that the values of  $b$ obtained in this study are approximately in the range $(10^{-3},10^{-2})$, similar to deep-water studies (Drazen et al. Reference Drazen, Melville and Lenain2008; Romero et al. Reference Romero, Melville and Kleiss2012; Deike et al. Reference Deike, Popinet and Melville2015, Reference Deike, Melville and Popinet2016).
6 Concluding remarks
In this study, we have presented a theoretical model and numerical results for the energy dissipation in breaking solitary waves onto uniform beaches. Using a physically informed model based on deep-water schemes (Drazen et al. Reference Drazen, Melville and Lenain2008), we assume a Taylor-type scaling in the turbulent zone immediately after the wave initially breaks, choosing the relevant length and velocity scales from the local parameters of the breaking wave and the beach slope. This leads to a proposed scaling for the energy dissipation rate, equation (2.2). Next, we use an empirical model to relate the wave breaking conditions to the offshore, initial parameters of the wave, and from there we are able to write the energetic scaling of the wave with respect to these initial parameters with equation (5.5), including the final presentation of the related dimensionless  $b$ parameter often seen in the literature and useful for cross-study comparisons. Although our methodology is based on that of deep-water studies, particularly Drazen et al. (Reference Drazen, Melville and Lenain2008), the resulting scaling is clearly distinct. This study provides a novel theoretical argument together with an extensive dataset on the kinematics and dynamic of shoaling and breaking solitary waves, which may be of use to future studies.
Acknowledgements
We thank W. K. Melville for his insights on discussions of energy dissipation by breaking waves and S. Popinet for his development and assistance with the Basilisk code. This work was supported by the Princeton Environmental Institute at Princeton University and the Urban Grand Challenge programme, and the Cooperative Institute for Modeling the Earth System between NOAA and Princeton University. Simulations were substantially performed using Princeton Research Computing resources, including the Princeton Institute for Computational Science and Engineering and the High Performance Computing Center. This work also used the Extreme Science and Engineering Discovery Environment, which is supported by NSF grant number ACI-1548562, via allocation TG-OCE180010.
Declaration of interests
The authors report no conflict of interest.
Supplementary movies
Supplementary movies are available at https://doi.org/10.1017/jfm.2020.83.
Appendix. Comparison of initial transients in solitary waves
We verify that the solitary-wave initialization used in this study performs better than some well-known alternatives. Figure 11(a) shows solitary-wave amplitude evolution at early times for the Boussinesq, Grimshaw and GNS initializations in the NS solver. For details on the Grimshaw and Boussinesq initializations, see Grimshaw (Reference Grimshaw1971) and Lubin & Lemonnier (Reference Lubin and Lemonnier2004) respectively. For comparison, a GNS initialization on the GN solver is also included and serves as a reference. In this comparison, among the NS solutions, the GNS initialization (3.1) shows the least initial oscillation and underestimates the nominal value, while the Grimshaw and Boussinesq initializations show larger oscillations and under- and overestimates of the nominal amplitude.

Figure 11. Comparison of initial transients in wave amplitude relative to the nominal value for different initializations (solid) and reference solution with the GNS initialization (3.1) in the GN solver (dashed).


