


Since the 1950s, the nutrition transition has occurred in many countries worldwide in different periods and at different rates(Reference Popkin, Corvalan and Grummer-Strawn1). Progressive and long lasting in developed countries(Reference Baker, Machado and Santos2), it is more rapid and recent in emerging and developing countries and is associated with increasing urbanisation, industrialization and population growth(Reference Popkin3). In developed countries, it marks the passage from a diet rich in minimally processed plant-based foods with limited variety (with a significant part of the diet composed of homemade dishes) before the Second World War to a diet richer in animal-based products and increasingly industrially processed foods (IPFs), and latter ultra-processed foods (UPFs)(Reference Monteiro and Cannon4,Reference Monteiro, Cannon and Levy5) , showing peak sales in Western countries in the 1980s(Reference Monteiro, Cannon and Levy5). Therefore, this nutrition transition paralleled the industrial one, bringing together with an increase of non-communicable diseases(Reference Popkin6).
Indeed, current analyses of developed countries indicate that excess animal and UPF calories are associated with increased risks of chronic diseases(Reference Monteiro and Cannon4,Reference Elizabeth, Machado and Zinöcker7) , especially overweight, obesity, metabolic syndrome, type 2 diabetes and hepatic steatosis(Reference Askari, Heshmati and Shahinfar8–Reference Wijarnpreecha, Thongprayoon and Edmonds11), cardiovascular diseases, renal function decline and total cancers(Reference Lane, Davis and Beattie10,Reference Rey-García, Donat-Vargas and Sandoval-Insausti12,Reference Fiolet, Srour and Sellem13) , all-cause mortality(Reference Rico-Campà, Martínez-González and Alvarez-Alvarez14), and with the degradation of food system sustainability as well(Reference Baker, Machado and Santos2,Reference Fardet and Rock15,Reference Fardet and Rock16) . Notably, UPFs supply empty calories and numerous xenobiotic substances foreign to human body(Reference Monteiro and Cannon4), and are mainly hyperglycaemic and poorly satiating food matrices(Reference Fardet and Rock17).
Thus, numerous studies have focused on the relationship between nutrition and health to alleviate the pandemic level of overweight and obesity, and their associated chronic diseases, these latter being addressed by medical advances and public health policies, but leading to either decrease or stagnation of healthy life years in Western countries from 1990 to 2017(Reference Kyu, Abate and Abate18). Starting from calories(Reference Scrinis19), these studies included successively the nutrients, the food groups, the dietary patterns and the level of processing of industrial foods as potential inputs(Reference Monteiro, Geoffrey and Jean-Claude20,Reference Fardet and Rock21) , together with sedentary lifestyles and low level of physical activities(Reference Murray, Aravkin and Zheng22). Finally, the nutrition transition, which initially included food security and safety, should now include nutritional and environmental securities relative to food systems underlying the developed countries(Reference Johnston, Fanzo and Cogill23).
From these observations in developed countries, the issue arises whether or not a similar chronic diseases-related nutritional transition is happening in developing and emerging countries where nutritional transition came latter. Notably, emerging countries, beginning nutrition transition in the early 1990s(Reference Popkin3), offer a unique model to address the diet-chronic diseases relationship, these latter progressively replacing micronutrient deficiencies and critical infectious diseases(Reference Forouzanfar, Afshin and Alexander24). Among emerging countries, China is the one with the largest population in the world, i.e. approximately >1·4 million people in 2020 (≈18·5 % of the total world population), only closely followed in number by India with 1·38 million people. Thus, China appears as a relevant study laboratory for this recent nutritional transition. However, although studied many times in the past, the Chinese nutritional transition has not been studied as much through the lens of both human health and a sustainability perspective (i.e. global health), especially including the degree of food processing(Reference Yin, Zhang and Huang25,Reference Lei and Shimokawa26) .
For this, from all data provided by these successive studies and nutrition transitions observed in Western countries, an innovative holistic framework has been proposed under the name of 3Vs rule to address both health and environmental securities(Reference Fardet and Rock16,Reference Fardet and Rock27) . This rule is based on three inclusive and interconnected metrics that governs the diet-global health relationship, namely the plant/animal calorie ratio (Rule 1 in French: ‘Végétal’ for plant, 85 % optimum daily calories), the food degree of processing (Rule 2: ‘Vrai’ for real foods, 85 % minimum daily calories), and food diversity, if possible organic, local and/or seasonal (Rule 3: ‘Varié’ for Varied). This simple tool theoretically and potentially suggests that the more a dietary pattern deviates from these rules, the less global health is preserved, for example with excess animal-based foods, and/or excess UPFs and/or an overly monotonous diet. The 3Vs rule therefore constitutes a holistic indicator to robustly determine whether the overall dietary pattern of a specific country/region deviate or not from global health sustainability.
Through this new lens, the objective of this study was therefore to evaluate the evolution of the prevalence of chronic diseases during the Chinese nutrition transition in the last three decades (1990–2019), based on calories and nutrient intakes (Rule 3), and on food sources (Rule 1) and their industrial processing (Rule 2).
Materials and methods
Data sources and collection
In order to target the widest possible population, the main sources of data were the OECD.Stat(28), Statista(29), FAO.Stat(30) and Our World in Data(Reference Roser and Ritchie31) web platforms. Notably, the Our World in Data platform retrieves data from the FAO food supply database (since 1961), The Complex Emergency Database (CE-DAT, since 1998), and the Inequality of Food Consumption database (for developing countries only; since 1990); Statista provides statistics and facts on retail and trades, and statistics and market data on consumer goods and Fast-Moving Consumer Goods (FMCG); and OECD.Stat includes data and metadata relating to OECD countries and select non-member economies (including China). In addition to these generic crude data, and to complete them when necessary, the other main source was The China Health and Nutrition Survey (that began in 1989) designed to provide representation of rural, urban and suburban areas varying substantially in geography, economic development, public resources and health indicators(Reference Popkin, Du and Zhai32), and from which food consumptions, and chronic disease risks were collected during the 1989–2015 period based on several epidemiological studies(Reference Wang, Su and Ouyang33–Reference Yan, Li and Li40). Other data were extracted from original articles or review papers about China and/or nutrition transitions through the ISI Web of Science database, with the following topic fields and Boolean operators: ‘Animal product* OR processed food*’ OR ‘Chronic disease*’ AND ‘Consumption* OR intake* OR sale*’ AND ‘China OR Chinese’, and the affiliated keywords for each lexical field.
The total, food group-specific, animal, and IPF calorie intakes/d in the Chinese population during the 1990–2019 period were extracted from the collected data. The following thirteen food groups were considered: fruits, sweetened beverages, vegetables, plain and fortified cereals, legumes, tubers, meats, dairy products, eggs, fishes and seafood, oils and fats, nuts and seeds, and sugars.
For the first part of the 3Vs rule, i.e. ‘Végétal/Plant’, animal-based foods encompassed white and red meat, dairy products, eggs, and seafood and fishes. For the second part of the 3Vs rule, i.e. ‘Vrai/Real’, due to the virtual absence of data for UPF consumption in China, only IPFs were retrieved (even if all IPFs are not UPFs): data concerned product vector categories for sugar, fat and salt consumption for the years 1999, 2006, 2012 and 2017(Reference Baker and Friel41), i.e. oils and fat, fruit/vegetable juices, frozen processed foods, dried processed foods, dairy, confectionary, biscuits, chilled processed foods, carbonated soft drinks, baked goods and other processed foods. For the lacking data during the 1990–2019 period, IPF data were extrapolated from these 4 years. For the third part of the 3V rule, i.e. ‘Varié/Varied’, information about access to detailed food diversity in the Chinese population during the 1990–2019 period was not available in the literature; therefore, this was approached as follows: (1) the change in the calorie shares accounted for by the main food groups, i.e. diminishing calorie shares by overly dominant food groups during 1990–2019 indirectly suggests an increasing variety (provided these changes were not to the benefits of IPF calories); and (2) the evaluation of the supply of macro- and micronutrients and fibre and the corresponding adequacy with regard to the international DRI(42), based on food group quantities consumed and the median food group composition.
Data processing, calculations and analyses
The basis of the calculations was the average calorie intake (kcal/d/capita) during the 1990–2019 period calculated from the main food groups consumed. When it was necessary to convert grams to kcal (except for sweetened beverages), we used all ‘as eaten’ food products within each food group and retrieved them from the recently updated French Ciqual database(43) (due to the absence of an available online Chinese food database). After checking for normality of the distribution of the data (Shapiro-Wilk’s test, non-significant), the non-parametric median calorie content for one gram of each food group (see the number of foods considered within each food group in Table 1) was determined. Then, fish and seafood were aggregated for calculations. For cereal intake, the 2016–2019 values were only available for the urban population. The values were corrected based on data before 2016 in urban and rural populations with a ratio of 0·67, rural populations consuming more cereals. For sugar intake, the 2014–2019 values were also extrapolated from the 1990–2013 data. Finally, concerning sweetened beverages, available data only covered the 2009–2014 period, with an increase each year of +1·14 %(Reference Malik and Hu44); this rate was applied to extrapolate to the previous 1990–2008 and subsequent 2015–2019 periods. However, for the extrapolation of either sugar or sweetened beverage data, due to their low contributions to calorie intake among all other food groups, we estimated that these extrapolations were rather reliable.
Table 1 Median calorie content by main food groups

* Median calorie contents within each food group were based on all ready-to-eat foods (therefore including IPFs) as retrieved from the Ciqual database on 17 August 2020(43).
† Number of ready-to-eat foods considered for the calculation of the median calorie content.
For the first dimension of the 3Vs rule (‘Végétal’/Plant), data regarding the consumption of animal food groups were in most cases expressed in g/d or in kg/year/capita and were more rarely expressed in calories. Therefore, when necessary, data were converted into calories to determine the median percentages of calories consumed for each animal group (Table 1). For the second dimension of the 3V rule (‘Vrai’/Real), we first considered the total amount of IPFs consumed in 1999, 2006, 2012 and 2017(Reference Baker and Friel41) and, based on the quasi linear growth rates, extrapolated the data to other years between 1990–1999, 2000–2006, 2007–2012, 2013–2017 and 2018–2019. For these first two dimensions of the 3V rule, the total calories from animal and IPF sources were reported with regard to the total daily consumed calories for a Chinese adult, leading to daily animal and IPF calorie percentages (%). The same calculations were also performed for other calorie sources from other food groups.
For the third dimension of the 3Vs rule (‘Varié’/Varied), we calculated the contribution in calorie percentages of each of the thirteen main food groups and their evolution during the 1990–2019 period. From the DRI(42,45) , and the supplies of macro- and micro-nutrients in each of these thirteen food groups, we also evaluated the DRI adequacy (%) in the 1990–2019 period for each micronutrient (fibre, vitamins, minerals and trace elements: see the number of ‘as eaten’ foods considered within each food group in Table 1 (43)) and the evolution of the protein, carbohydrate, and lipid calorie percentages. Due to the lack of data for vitamin K1 content(43), no data were reported for this vitamin. Finally, -carotene was converted to vitamin A with 12 mg -carotene = 1 mg vitamin A/retinol equivalent.
For chronic disease prevalence, percentages were also extracted from the scientific literature as described above. Because the prevalence of CVD was not available, the data were based on the percentage of cardiovascular death out of all deaths. Then, these percentages were correlated with food group, animal and IPF calorie shares (%) during the 1990–2019 period, and the best fitted equations (i.e. with the highest correlation coefficient, R 2, as calculated by Excel software, Microsoft Office 2016©, USA) were identified for each association.
Instead of means, median values were always used in this study (e.g. median calorie and nutrient contents for food groups) due to the non-significant result for Shapiro-Wilk’s test, indicating a non-normal distribution of the data (SPAD 9.1 software, Coheris©).
Results
Calorie intake by food group
Calorie intake was calculated for each food group and then summed (Fig. 1). Overall, total calorie intake tended to decrease during the 1990–2019 period from 2991 to 2725 kcal/d (approximately -9 %). When we looked at changes over time in food groups there was an approximately two-fold decrease in cereal calorie intake from 2440 to 1220 kcal/d. This decrease was notably accompanied by increases in calorie intake from meat-based products (+220 %, i.e. from 205 to 450 kcal/d), dairy products (+455 %, i.e. from 33 to 150 kcal/d) and oils and fats (+7120 %, i.e. from 5 to 356 kcal/d). The intakes of legumes, tubers, nuts and seeds, sugars, sweet beverages and fruits and vegetables were consistently below 80 kcal/d during the 1990–2019 period (Fig. 1).

Fig. 1 Changes in calorie intake by food group during the 1990–2019 period
Percentages of animal and industrially processed calorie intakes
The percentages of animal and IPF calorie intakes substantially increased during the 1990–2019 period (Fig. 2(a)). Estimated data from 1990 to 2019 indicate that the IPF calorie share increased from 1·5 to 28·7 %, according to a polynomial curve (R 2 = 1·00). Animal calorie intake also increased from 9·5 % in 1990 to 30·0 % in 2019, i.e. a three-fold increase with two more acute increases in 1999 (+6 %) and 2016 (+3 %) (polynomial curve, R 2 = 0·97). Animal calorie intake was strongly and exponentially correlated with IPF calorie intake (R 2 = 0·97, Fig. 2(b)), meaning that the percentage of IPF calorie intake increased more rapidly than the percentage of animal calorie intake.

Fig. 2 During the 1990–2019 period: (a) Changes (%) in animal and industrially processed food calorie intakes (large squares are real data in 1999, 2006, 2012 and 2017 for IPF, and small points are extrapolated data); (b) Correlations between percentages of animal and industrially processed calorie intakes. Fitted curves were chosen based on the highest R 2
Percentages of variety among food groups and DRI adequacy
Overall, calorie shares among the thirteen food groups importantly changed during the 1990–2019 period, with a more balanced calorie percentage shares among them in 2019 (Fig. 3). In 1990, cereals constituted 82 % of the total calorie intake, while they only accounted for 45 % in 2019, i.e. a decrease by approximately 50 %. At the same time, total meat calorie intake (including processed meats) more than doubled in 30 years, from 7 to 17 %. The most striking increase was observed for oil and fat calorie intake, which changed from 0·2 to 13·1 %, and for dairy products which changed from 1·1 to 5·5 %. Finally, the calorie shares of less processed plant-based food groups other than cereals did not increase that much: thus, fruits, vegetables, legumes, tubers, and nuts and seeds calorie shares increased from 0·4–2·2 % to only 1·1–2·8 % (Fig. 3). These changes in food group intake were reflected in the evolution of the protein/carbohydrate/lipid calorie ratios, which changed from 13/72/15 % to 16/45/39 % (Fig. 4). While the protein share remained quite stable, an important portion of carbohydrate calories was replaced by lipid calories.

Fig. 3 Percentages of food group (n 11) calorie shares during the 1990–2019 period

Fig. 4 Percentages of macronutrient calorie shares during the 1990–2019 period
The changes in some food group shares with regard to calorie intake was accompanied with different evolutions of fibre, minerals and trace elements (Fig. 5(a)) or vitamins (Fig. 5(b)) intakes. Although above DRI during the 1990–2019 period, the intakes of iron, copper, magnesium, vitamin E, C, B1, B2, B3, B5, B6 and B9 decreased. In the same time, calcium, retinol, vitamins E and D (but most of vitamin D is supposed to be supplied through sun exposure) remained below DRI while iodine intake increased to levels above DRI, and fibre intake decreased below DRI. Vitamin B12 and selenium intakes remained above DRI and increased during this period. In 2019, fibre, retinol and calcium intakes were insufficient, addressing only 74, 37 and 44 % of DRI, respectively.

Fig. 5 The adequacy of the diet with regard to the DRI (%) for: (a) fibre, minerals and trace elements; and (b) vitamins during the 1990–2019 period. A negative percentage indicates a deficiency
Chronic disease prevalence during the 1990–2019 period
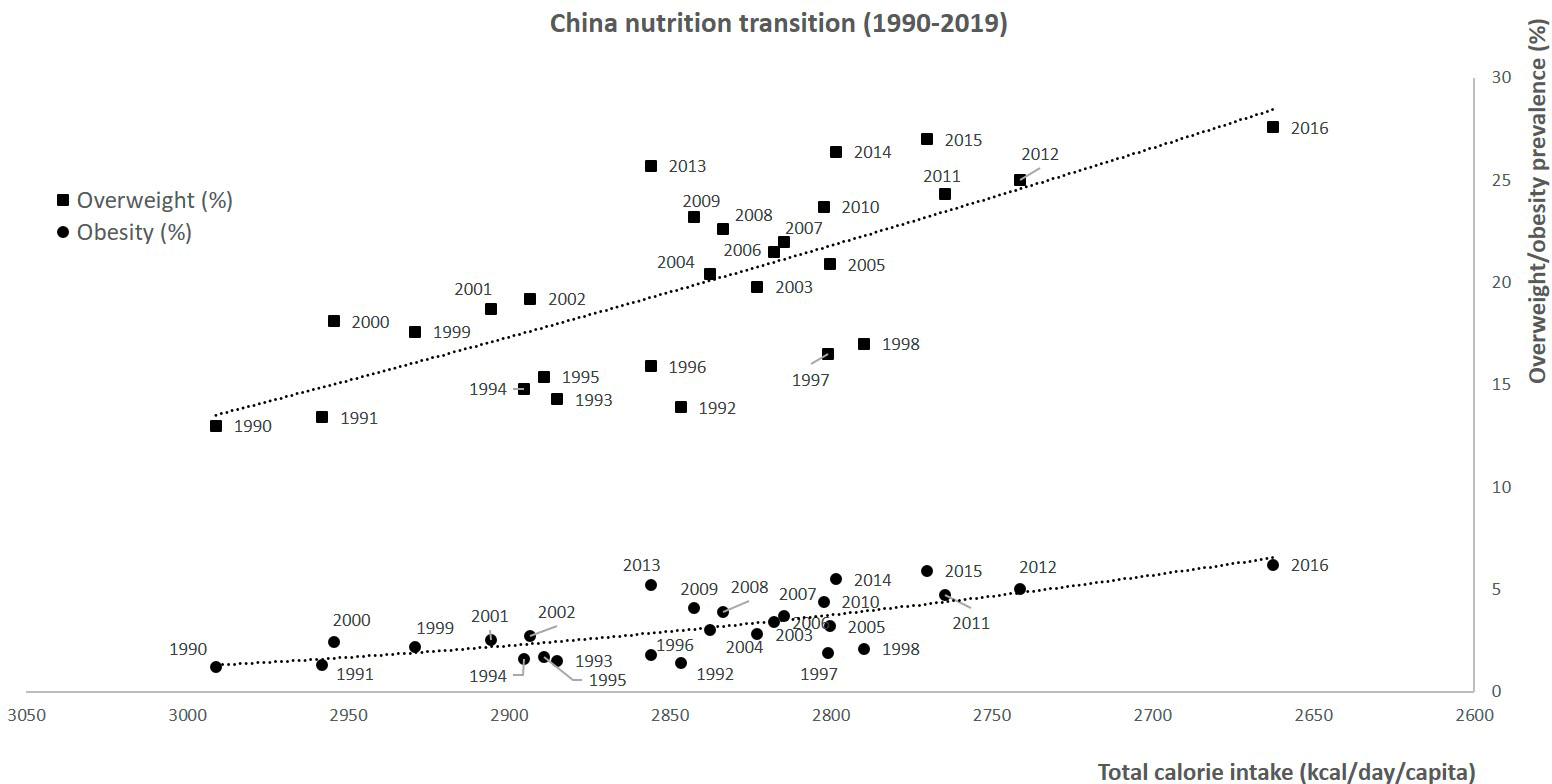
First, total calorie intake was inversely correlated with the overweight/obesity prevalence during the 1990–2016 period (Fig. 6, polynomial curve, R 2 = 0·53–0·55). During this period, the prevalence of overweight increased from 13·0 to 27·6 %, and the prevalence of obesity increased from 1·2 to 6·2 %. Then, the prevalence of overweight was plotted against food group, animal and IPF calorie shares during the 1990–2019 period (i.e. n 15 calorie groups). For the fifteen correlations, the R 2 ranged from 0·21 (vegetable) to 0·99 (oils and fats), with the highest correlations found for sweet beverages (R 2 = 0·997), fish and seafood (R 2 = 0·966), oils and fats (R 2 = 0·994), IPF (R 2 = 0·992), and animal (R 2 = 0·952) calorie shares (Fig. 7(a)). Concerning the first two dimensions of the 3Vs rule, the evolutions of animal and IPF calories followed those of the prevalence of overweight and obesity during the 1990–2019 period, with linear, exponential or polynomial curves (R 2 range = (0·97–1·00)) (Fig. 7(b)). Notably, the prevalence of overweight linearly increased at least two-fold during the 1990–2019 period (R 2 = 1·00), while the prevalence of obesity increased exponentially (R 2 = 1·00), ultimately increasing six-fold over the 30 years (Fig. 7(b)). In addition, the IPF calorie share (%) was linearly correlated with the prevalence of obesity (%) (R 2 = 1·00, Fig. 8(a)), and the animal calorie share (%) was exponentially correlated with the prevalence of obesity (R 2 = 0·943, Fig. 8(b)).

Fig. 6 Associations between total calorie intake (kcal/d/capita) and the prevalence of overweight and obesity during the 1990–2019 period

Fig. 7 During the 1990–2019 period: (a) percentages of food group calorie share and the prevalence of overweight (%); and (b) changes in animal and industrially processed calorie shares (%) and the prevalence of overweight and obesity (%) (larger triangles are real data in 1999, 2006, 2012 and 2017 for IPF, and small triangles are extrapolated data). Fitted curves were chosen based on the highest R 2

Fig. 8 During the 1990–2016 period: percentages of: (a) industrially processed food calorie share; and (b) animal calorie shares and the prevalence of obesity (%) (larger circles are real data in 1999, 2006 and 2012 for IPF, and small triangles are extrapolated data). Fitted curves were chosen based on the highest R 2
Concerning other chronic diseases, significant correlations were found between animal (Fig. 9(a)) and IPF (Fig. 9(b)) calorie intakes (%) and type 2 diabetes, metabolic syndrome, hepatic steatosis and total cancer prevalence and with the CVD mortality rate (among all deaths), i.e. all prevalence increased with increased consumption. Due to the lack of data for hepatic steatosis before 2001, the adjusted curves were less well fitted (lowest R 2, Fig. 9(a) and (b)). The types of correlations differed according to the considered chronic diseases: for the animal calorie share (%), the best fitted curves are linear; for metabolic syndrome, all cancers and hepatic steatosis, the best fitted curves are exponential (Fig. 9(a)); and for IPF calorie share (%), except diabetes, all other chronic disease prevalence follow a polynomial curve with a high R 2, i.e. above 0·96 (Fig. 9(b)).

Fig. 9 During the 1990–2019 period, chronic disease prevalence (other than overweight/obesity) correlated with percentages of: (a) animal calorie consumption; and (b) industrially processed calorie consumption (larger symbols are real data in 1999, 2006 and 2012 for IPF, and small triangles are extrapolated data). Fitted curves were chosen based on the highest R 2
Discussion
Calorie intake and overweight/obesity
The first result showed a slight decrease in total calorie intake of approximately 9 % during the last three decades. Based on data from the China Statistical Yearbook (1980–2011)(46), a decrease had been previously observed during the 1992–2010 period (-20 % total calories/d), with disparities between rural and urban populations, the latter consuming fewer calories on average than rural populations who perform physical work on farms and therefore need to consume more calories(Reference Jian Ping and Zhou Ping47). The urban population has increased dramatically in the last three decades, and the proportion of the population accounted for by rural residents decreased from 80 % (796 million) in 1980 to 50 % (671 million) in 2010(Reference Jian Ping and Zhou Ping47). The overall observed decrease in calorie intake(Reference Jian Ping and Zhou Ping47) during dietary transition could have resulted from demographic transition and the associated urban migration, which was estimated to be 30 % in 2010. In the same study, the overall changes in the consumption of the main food groups during the period 1980–2010(Reference Jian Ping and Zhou Ping47) is similar to that described in the present study also showing further continuation until 2019. According to a recent model to project food demand between 2010 and 2050, this trend will continue due to the fact that the highest income per capita in China is associated with a higher animal-based product consumption in kcal/capita/d(Reference Gouel and Guimbard48).
In addition, the present data indicate that the total calorie intake was negatively associated with the prevalence of overweight and obesity highlighting that the explanation might be found elsewhere than the only total calorie intake. Obviously, the decrease in physical activity and increase in sedentary lifestyle have probably played relevant roles, especially for urban populations(Reference Ding, Feng and Yuan49). Beyond this first explanation, concerning diets and food factors, two hypotheses may also be proposed: (1) despite the decrease in physical activity, the total calorie intake did not sufficiently decrease, making the calorie intake remains too high, i.e. an average of 2700 kcal/d/capita in 2019; and/or (2) the quality of the calorie predominates over the quantity consumed(Reference Camacho and Ruppel50). This second hypothesis, previously proposed by Camacho and Ruppel(Reference Camacho and Ruppel50), is supported by our data, which show strong correlations between increased prevalence of overweight/obesity during the 1990–2019 period and increased shares of calories from plant oils and fat, sweetened beverages, animal and IPF products, the access to which has likely increased with a higher industrialisation and income per capita of the urban population(Reference Gouel and Guimbard48). A similar observation was previously made by Dr. Campbell (2004), looking at mortality rates from cancer and other chronic diseases from 1973–1975 in 65 counties in China(Reference Campbell51). The data showed that people living in the countryside with a diet based on minimally processed plant-based foods did not suffer from overweight or obesity, unlike city dwellers who nevertheless consumed nearly 800 fewer calories but obtained their calories from more IPFs(Reference Campbell51).
Adequacy to the 3Vs rule
Rule 1: 85 % plant calories
The animal calorie share increased from 9 % in 1990 to 30 % in 2019, which is 15 % above the optimum value determined in the 3Vs rule. This increase was strongly correlated with the increased prevalence of the main chronic diseases, especially mortality due to CVDs, which increased from 28 % of all deaths in 1990 to 42 % in 2017. Notably, it was reported in 2019 that China had the highest age-standardized rates of diet-related CVD deaths (299 (275–324) deaths per 100 000 population)(Reference Afshin, Sur and Fay52). Animal-based product intake was also significantly correlated with the prevalence of obesity (R 2 = 0·94), which is in agreement with a previous ecological study showing that meat availability contributes to the global prevalence of obesity and that this contribution is comparable to that of sugar(Reference You and Henneberg53). Therefore, a decrease in total dietary calories, but with more than 15 % of the calorie intake provided by animal-based foods appears to be associated with a higher prevalence of chronic diseases. Correlations obviously do not mean a strict causal link with increased animal-based product consumption. Other dietary factors (i.e. a diet low in whole grains, nuts, seeds, seafood, fruits, legumes and/or fibre)(Reference Meier, Gräfe and Senn54), decreased physical activity(Reference Shi, Cai and Qin55) with the enormous increases in urbanization and population density(Reference Wang, Qin and He56) (but also in the rural population(Reference Tu, Li and Shen57)), and environmental pollution, which is especially high in China (e.g. chronic obstructive pulmonary disease was the fourth leading cause of years of life lost in 2013, just behind CVDs and road injuries)(58) can also be involved in the observed association.
Rule 2: 85 % minimum real foods calories
Concerning this second dimension, which is linked to the degree of processing, IPF calorie intake (%) was strongly correlated with increased risks of the main chronic diseases, excepting CVD mortality, which plateaued after 20 % was reached for IPF calories. Notably, the prevalence of overweight, which is observed before obesity, increased two-fold in 30 years (from 13 to 28 %). This constant increase led us to consider that IPFs have been progressively substituted with UPF. In France, UPFs were evaluated to correspond to 67 % of packaged IPFs(Reference Davidou, Christodoulou and Fardet59). And, the increase in the UPF calorie share has been consistently associated with the prevalence of overweight and obesity and with the prevalence of chronic diseases(Reference Monteiro and Cannon4,Reference Askari, Heshmati and Shahinfar8,Reference Pagliai, Dinu and Madarena9) , e.g. +9 % risk of obesity for an absolute increase of 10 % of UPFs in the French diet(Reference Beslay, Srour and Méjean60). This suggests that in China, if UPF calorie shares continue to increase from the reported values in 2013 (≈11 % calorie share)(61) and 2019 (≈18 %)(Reference Baker, Machado and Santos2), the prevalence of obesity prevalence will rapidly exceed 6 %, reaching a prevalence similar to that in Western countries, e.g. between 15 and 25 % in Europe(Reference Monteiro, Moubarac and Levy62). Between 2013 and 2019, the UPF calorie share therefore increased by +7 % while, at the same time, the prevalence of obesity increased from 5·2 to 6·2 %. Today, several countries have UPF calorie intake levels far above 15 %(Reference Baker, Machado and Santos2,61) , even reaching more than 30 %, and the prevalence of obesity in these countries is generally above 10 %. One can then predict that the tendency for an increased UPF intake will be associated with a still higher prevalence of obesity in China in 2030, as already predicted in 2008(Reference Kelly, Yang and Chen63).
Concerning other chronic diseases, the increased prevalence of cardiovascular diseases, type 2 diabetes, and metabolic syndrome has been shown to be also associated with increased consumption of UPFs(Reference Srour, Fezeu and Kesse-Guyot64–Reference Tavares, Fonseca and Garcia Rosa67). Regarding diabetes during the transition period of 1990–2019, Chinese people were used to consume a high level of cereals, which still constitute 45 % of their total calorie intake today. Consuming wholegrain cereal is usually considered a healthy dietary habit, particularly with regard to preventing diabetes(Reference Wu, Qiu and Wang68). However, through the lens of the 3Vs rule, the important question is whether these cereals are refined or not. In the USA, a previous study reported that people who consumed high levels of refined white rice had a higher risk of type 2 diabetes than those who consumed high levels of unrefined brown rice, which highlights the main role played by the outer layers of the grains in health(Reference Sun, Spiegelman and van Dam69). More generally, whole grain cereals have a stronger protective effect than refined cereals(Reference Fardet and Boirie70), especially with regard to diabetes(Reference Della Pepa, Vetrani and Vitale71). Therefore, the high level of consumption of white rice-based foods in China(Reference Liang, Lee and Binns72) might also explain the increased prevalence of type 2 diabetes – although studies give contradictory results(Reference Li, Su and Liang73,Reference Dong, Howard and Herring74) , which substantially increased between 1990 and 2019 from ≈2 to ≈14 %. A high intake of processed meats is also associated with an increased risk of type 2 diabetes(Reference Fardet and Boirie70,Reference Kouvari, Notara and Kalogeropoulos75) . Finally, the substantially increased prevalence rates of hepatic steatosis – also called the ‘soda disease’(Reference Bray, Nielsen and Popkin76) – can also be related to increased consumption of UPFs, notably those with added fructose.
Rule 3: varied among real foods
This third dimension appears independent of the two first ones since the variations of adequacy of the Chinese diet to the DRI (possibly overestimated due to fortified cereals) did not prevent the increases in the prevalence of chronic diseases – despite deficiencies observed for some nutrients in 2019 (i.e. calcium, vitamin E and retinol) and a still slightly too high lipid share as regards to the protein/carbohydrate/protein ratio(77). This statement in general population was in agreement with the one observed in rural China from 1991 to 2011(Reference Su, Zhao and Wu78) and with those found in the China Health and Nutrition Survey (1991–2015) for 40 088 females aged 18–64 years(Reference Zhao, Su and Wang35) and other data reported in 2017(Reference Wan, Wang and Yuan79). This analysis at the level of food nutrients suggests an apparent more diversified dietary pattern during this nutrition transition, but not really reflected by an overall improvement of the DRI, except for iodine, selenium, and vitamins D and B12, probably due to the increase in the consumption of animal products. Other decreases in fibre and micronutrients intakes during the 1990–2019 period are very likely to be due to the low level of consumption of minimally-processed plant-based food groups together with a sharp increase in IPF, and oils and fats intake. This evolution corresponds to the previously described shift from a traditional to a modern dietary pattern (with more IPFs) during the 1991–2011 period in The China Health and Nutrition Survey, and associated with increase cardio metabolic risks(Reference Li and Shi37).
Nutrition transition towards a Western dietary pattern
With regard to nutrition transition in developed countries, there is therefore an underestimated sub-transition from IPF to UPF(Reference Monteiro, Cannon and Levy5,Reference Monteiro, Moubarac and Cannon80) , with peak sales in Western countries occurring in the 1980s(Reference Monteiro, Cannon and Levy5,Reference Monteiro, Moubarac and Cannon80) . In emerging countries, this transition is more recent, beginning in the early 1990s(Reference Popkin3), with increasing rates of sales of UPF, with the sales peak yet to be reached(61,81) . Thus, the main large emerging countries, such as Brazil, Russia, India and China (i.e. BRIC), are facing a rapid nutritional transition, notably characterised by an important increase in animal and IPF/UPF energy consumption(Reference Burggraf, Kuhn and Zhao82–Reference Conde and Monteiro84), e.g. greater than 4 % of the compounding annual UPF growth rate for sales occurred in China and India(Reference Baker, Machado and Santos2). There was a 115 % growth rate of UPF sales between 2000 and 2013 in Asia and the Pacific region, while in the same period, the growth rates were only 2·3 % in the saturated market of the USA, 18·5 % in Western Europe and 25 % in Australia, compared with a global growth rate of 44 %(61). This rapid increase in UPF sales, both in China and Western countries, appears linked to rapid increases in chronic disease prevalence. The trends emphasised in this study support the previous analyses of the nutrition transition in developing and emerging countries, with a pattern of degenerative disease that is accelerating(Reference Popkin85). Notably, we observed that UPF sales in China increased from 138·3 g/d/capita in 2013(61) to 218·3 g/d/capita in 2019(Reference Baker, Machado and Santos2), i.e. +58 %, a percentage close to the increase in IPF consumption between 2013 and 2019 (+50 %).
Limitations of the study
First, the ecological nature of our study may involve inference fallacies because correlations are not causalities, and chronic diseases are multifactorial. Other factors are obviously involved, such as the rapid migration from the countryside to cities, accelerating the transition from an active to a sedentary lifestyle(Reference Wang, Qin and He56,Reference Tu, Li and Shen57) , as well as environmental pollution, which reaches very high levels in China, notably leading to chronic obstructive pulmonary disease(Reference Chen, Wang and Qiu86) and CVD(Reference Xu, Geng and Geng87). However, the observations made in this study are in agreement to what is observed in other countries where the prevalence of chronic diseases parallels the industrialisation of diets and foods, e.g. the Western countries(Reference Raj, Noland, Drisko and Wagner88) and Brazil(Reference Conde and Monteiro84).
Second, another potential limitation of this study comes from some of the extrapolations made from the original crude data, notably for calculating the food group and IPF energy intakes. Although several sources showed a decrease in total energy intake during the 1990–2019 period, total energy intake was not consistent in those sources. For example, Li et al. found a total energy intake of approximately 2000/d in 2010(Reference Jian Ping and Zhou Ping47), while we found, based on food groups, 2700 kcal/d. Despite discrepancies in absolute values, the relative tendencies to a lower energy intake shown in this study are in agreement with the previous literature. In addition, the IPF energy intake was extrapolated from only four data points(Reference Baker, Machado and Santos2). However, the change in the intake of IPF was quasi linear between 1999 and 2017 (R 2 = 0·99, P < 0·05), which suggests that the extrapolation for the missing period was quite reliable. Otherwise, it should not be excluded, especially in overweight/obese individuals, that participants in surveys tend to underreport their food intakes and can contribute to the observed decreased energies intake during the 1990–2019 period.
Finally, our data are very broad in scope and obviously do not reflect important disparities between urban and rural populations or between different Chinese regions, counties and/or ethnicities. Therefore, results of this study are only indicative and only reflect a very global tendency of the nutrition transition in China.
Conclusions and perspectives
As regard to the increased rates of diet-associated chronic disease prevalence, China is undoubtedly joining the ranks of developed countries. Despite a slight decreased total energy consumption and small variations of adequacy with DRI, the farther the Chinese population moved away from the 3Vs rule during the 1990–2019 period, the more the prevalence of chronic diseases increased. Therefore, the types of food groups and their degree of processing, rather than their only nutrient content, are very likely to be involved in the relationship between calorie consumption and health, showing that addressing only one dimension of the 3Vs rule is insufficient for achieving a healthy diet and preventing chronic diseases. This may show that the adequacy of the diet with regard to the DRI is an insufficient indicator of a healthy diet, especially when animal and UPF energy intakes drastically increase, as has occurred in many Western countries. Thus, food health potential cannot be summarised as the sum of nutrients and/or energies, and the quality of energies – and the complex food matrix environment in which they are embedded – matters more than macro- and micro-nutrient and total energetic intakes as such, i.e. the composition of foods. In the end, analysing food group-based diets by including the degree of processing may better reflect their real overall nutritional quality. Therefore, to conform to the 3Vs rule, it appears more relevant to consume mildly processed nutrient-dense foods than micronutrient-enriched IPF or UPF.
Such correlations between the 3Vs rule and chronic disease prevalence deserve attention, and this analysis should be carried out in other emerging countries, such as Brazil and Russia, as well as in less developed countries, notably in South-Asia and Africa. In the latter regions, national recommendations are still based on satisfying the nutrients’ need while the population tend to adopt Western dietary patterns, increasing energies provided by animal-based foods, IPF and UPF, and sedentary lifestyles. Therefore, the 3Vs rule appears as a relevant lever to ‘drive’ the nutrition transitions in emerging countries, and those beginning in developing countries. It means improving the already existing traditional food systems while developing minimal food processing and avoiding industrialisation of traditional foods that irremediably leads to an economy of scale of food system in favour of food security and safety, but detrimental for sustainable health and environmental securities.
Acknowledgements
Acknowledgements: None. Financial support: This review article has been funded by the INRAE/Cirad’s GloFoodS (‘Transitions for World Food Security’) metaprogram. Conflict of interest: Anthony Fardet has been a member of the scientific committee of the Siga and Wuji & Co. societies since 2017. He is also co-president of the scientific committee of the Complexus Care Association. Edmond Rock declares no conflicts of interest. The INRAE/Cirad GloFoodS metaprogram funder had no role in the design of the study; in the collection, analyses, or interpretation of the data; in the writing of the manuscript or in the decision to publish the results. Authorship: The present study was developed by A.F. and E.R., who formulated the research question and designed the study. Data collection and formatting according to the 3Vs rule was carried out by K.A. and A.F. A.F. took the lead on writing the manuscript. A.F. and K.A. designed the figures and tables and analysed the data. All authors reviewed and approved the final manuscript. Ethics of human subject participation: Not applicable.


