


1. Introduction
Particle migration at a finite channel (or particle) Reynolds number  $Re$ ( $Re_{p}$) in microchannels has been studied intensively not only from the viewpoint of pure physics, but also in terms of bioengineering applications such as label-free cell alignment, sorting, and separation techniques (Martel & Toner Reference Martel and Toner2014; Warkiani et al. Reference Warkiani, Khoo, Wu, Tay, Bhagat, Han and Lim2016; Zhou et al. Reference Zhou, Mukherjee, Gao, Luan and Papautsky2019). Such microfluidic techniques allow us to reduce the complexity and costs of clinical applications by using small amounts of blood samples. While a number of studies have analysed the inertial migration of rigid spherical particles using a variety of approaches, such as analytics (Ho & Leal Reference Ho and Leal1974; Schonberg & Hinch Reference Schonberg and Hinch1989; Asmolov Reference Asmolov1999), numerical simulations (Feng, Hu & Joseph Reference Feng, Hu and Joseph1994; Yang et al. Reference Yang, Wang, Joseph, Hu, Pan and Glowinski2005; Bazaz et al. Reference Bazaz, Mashhadian, Ehsani, Saha, Krüger and Warkiani2020) and experimental observations (Karnis, Goldsmith & Mason Reference Karnis, Goldsmith and Mason1966; Matas, Morris & Guazzelli Reference Matas, Morris and Guazzelli2004; Di Carlo Reference Di Carlo2009), the inertial migration of biological cells, which can be assumed to be deformable particles consisting of the internal fluid enclosed by a thin membrane, has not yet been fully described.
Red blood cells (RBCs) are a major component of human blood cells, with volume fraction 45 % (the other 55 % is plasma) and density  $\sim$5 million ml $^{-1}$. The behaviour of individual RBCs subject to finite $Re$ is of paramount importance in manipulating cells or quantifying cell state. Due to their unique biconcave shape and high deformability, it is expected that the problem of inertial migration of RBCs is made more complex in comparison with rigid spherical particles originally reported by Segré & Silberberg (Reference Segré and Silberberg1962), where the particles exhibit lateral movement and flow in the equilibrium position away from the channel centre as a consequence of the force balance between the shear-induced and wall-induced lift forces, the so-called ‘inertial migration’ or ‘tubular pinch effect’ (Segré & Silberberg Reference Segré and Silberberg1962). Jeffery (Reference Jeffery1922) speculated that an ellipsoid may alter its orientation so that the viscous energy dissipation of the system becomes minimal. However, this is not true for soft particles with large deformation. Although many former studies have examined the dynamics of a non-spherical capsule, e.g. in Omori et al. (Reference Omori, Imai, Yamaguchi and Ishikawa2012), none of them have fully answered this question.
The behaviour of a single, almost inertialess RBC in a microchannel whose scale is comparable to the cell size has been well investigated, e.g. in Fedosov, Peltomäki & Gompper (Reference Fedosov, Peltomäki and Gompper2014), Guckenberger et al. (Reference Guckenberger, Kihm, John, Wagner and Gekle2018), Noguchi & Gompper (Reference Noguchi and Gompper2005) and Takeishi et al. (Reference Takeishi, Yamashita, Omori, Yokoyama and Sugihara-Seiki2021). These studies have revealed velocity-dependent transitions in RBC shapes. Tomaiuolo et al. (Reference Tomaiuolo, Simeone, Martinelli, Rotolib and Guido2009) found parachutes at smaller velocity ( $\sim$0.11 cm s $^{-1}$) and slippers at higher velocity ( $\sim$3.6 cm s $^{-1}$) in circular channels of 10 $\mathrm {\mu }$m diameter. Cluitmans et al. (Reference Cluitmans, Chokkalingam, Janssen, Brock, Huck and Bosman2014) detected croissants at lower velocities ( $\leq$5 mm s $^{-1}$) and slippers at higher velocities ( $\geq$10 mm s $^{-1}$) in square channels with widths $\leq$10 $\mathrm {\mu }$m. Using the same parameters as Cluitmans et al. (Reference Cluitmans, Chokkalingam, Janssen, Brock, Huck and Bosman2014), Quint et al. (Reference Quint, Christ, Guckenberger, Himbert, Gekle and Wagner2017) found a stable slipper and a metastable croissant in a rectangular channel of size $25\,\mathrm {\mu } {\rm m}\times 10\,\mathrm {\mu }{\rm m}$. The shape transition from croissant/parachute to slipper shape was also identified in a more recent study by Guckenberger et al. (Reference Guckenberger, Kihm, John, Wagner and Gekle2018) that used a rectangular channel of size $12\,\mathrm {\mu } {\rm m}\times 10\,\mathrm {\mu } {\rm m}$. The slipper shape was associated with an off-centre position (Guckenberger et al. Reference Guckenberger, Kihm, John, Wagner and Gekle2018), which is counter to traditional knowledge about the axial focusing of spherical deformable particles toward the channel axis (Karnis, Goldsmith & Mason Reference Karnis, Goldsmith and Mason1963). Hereafter, we call this phenomenon ‘axial migration’. A more recent numerical study showed further that compared to the parachute shape, the off-centre slipper shape had low energy expenditure associated with membrane deformations, and the equilibrium radial positions of these two RBC centroids correlated well with the energy expenditure (Takeishi et al. Reference Takeishi, Yamashita, Omori, Yokoyama and Sugihara-Seiki2021). Despite these insights, it is still uncertain whether the aforementioned stable shapes of RBCs persist even under finite inertia in larger microchannels with diameters of several dozen micrometres, and whether the equilibrium radial positions can be described by the energy expenditure. Therefore, the objective of this study was to clarify the relationship between the stable flow mode of RBCs, equilibrium radial position, and energy expenditure associated with membrane deformations in several dozen circular microchannels for finite $Re$.
$Re$.
So far, inertial migration of rigid spherical particles has been well investigated, e.g. in Martel & Toner (Reference Martel and Toner2014), Morita, Itano & Sugihara-Seki (Reference Morita, Itano and Sugihara-Seki2017), Nakagawa et al. (Reference Nakagawa, Yabu, Otomo, Kase, Makino, Itano and Sugihara-Seki2015) and Nakayama et al. (Reference Nakayama, Yamashita, Yabu, Itano and Sugihara-Seki2019). Under moderate  $Re_{p}$, the rigid particles align in an annulus at a radius of about 0.6 $R$, where $R$ is the channel wall radius (Segré & Silberberg Reference Segré and Silberberg1962). The radius of the equilibrium annulus increases with $Re_{p}$ because of the increase in the shear-induced inertial lift force (Matas et al. Reference Matas, Morris and Guazzelli2004; Matas, Morris & Guazzelli Reference Matas, Morris and Guazzelli2009). The equilibrium position 0.6 $R$ was observed for $Re= 2R\bar {V}/\nu = O(1)$ and shifted to larger radius for larger $Re$, where $\bar {V}$ was the average axial velocity (Matas et al. Reference Matas, Morris and Guazzelli2004).
Studies of inertial migration of biological cells have attracted particular attention recently (Warkiani et al. Reference Warkiani, Khoo, Wu, Tay, Bhagat, Han and Lim2016; Zhou et al. Reference Zhou, Mukherjee, Gao, Luan and Papautsky2019). For instance, Hur et al. (Reference Hur, Henderson-MacLennan, McCabe and Di Carlo2011) investigated experimentally the inertial migration of various cell types (including RBCs, leukocytes, and cancer cells such as a cervical carcinoma cell line, breast carcinoma cell line, and osteosarcoma cell line) with a cell-to-channel size ratio  $0.1 \leq d/W \leq 0.8$, using a rectangular channel with a high aspect ratio $W/H \approx 0.5$, where $d$,
$d$,  $W$ and $H$ are the cell diameter, channel width and height, respectively. Their results showed that the cells could be separated according to their size and (elastic) deformability (Hur et al. Reference Hur, Henderson-MacLennan, McCabe and Di Carlo2011).
The experimental results can be described qualitatively by a spherical capsule model (Kilimnik, Mao & Alexeev Reference Kilimnik, Mao and Alexeev2011) and a droplet model (Chen et al. Reference Chen, Xue, Zhang, Hu, Jiang and Sun2014). In a more recent experiment by Hadikhani et al. (Reference Hadikhani, Hashemi, Balestra, Zhu, Modestino, Gallaire and Psaltis2018) involving bubbles in rectangular microchannels and different bubble-to-channel size ratios  $0.48 \leq d/W \leq 0.84$, the authors investigated the effect of bubble diameter $Re$ ( $1 < Re < 40$) and capillary number $Ca$ ( $0.1 < Ca < 1$) on the lateral equilibrium, where $Ca$ is the ratio between the fluid viscous force and the membrane elastic force. The equilibrium position of such soft particles results from the competition between $Re$ and $Ca$, because at high $Re$, the flow pushes the particles towards the wall, while at high $Ca$, i.e. high deformability, particles can move towards the channel centre.
Numerical analysis showed more clearly that ‘deformation-induced lift force’ became stronger as the particle deformation increased (Raffiee, Dabiri & Ardekani Reference Raffiee, Dabiri and Ardekani2017; Schaaf & Stark Reference Schaaf and Stark2017). Although numerical analysis of inertia migration has been investigated intensively in recent years mostly for spherical particles (Bazaz et al. Reference Bazaz, Mashhadian, Ehsani, Saha, Krüger and Warkiani2020), equilibrium positions of soft particles are still debated owing to the complexity of the phenomenon. Shin & Sung (Reference Shin and Sung2011) investigated the equilibrium position of a two-dimensional spherical capsule in the range  $1 \leq Re \leq 100$ for different capsule-to-channel size ratios $0.1 \leq d/H \leq 0.4$. Their numerical results showed that the equilibrium position peaked in the $Re$ range between 30 and 40 for $d/H \leq 0.3$, while the capsule migrated to the channel centreline regardless of $Re$ for $d/H = 0.4$ (i.e. small channel) (Shin & Sung Reference Shin and Sung2011). On the other hand, in a numerical analysis using a three-dimensional spherical capsule model, Kilimnik et al. (Reference Kilimnik, Mao and Alexeev2011) showed that the equilibrium peak position in a rectangular microchannel with $d/H = 0.2$ tended to increase with channel $Re$ in the range between 1 and 100. Schaaf & Stark (Reference Schaaf and Stark2017) also performed numerical simulations of spherical capsules in a square channel for $0.1 \leq d/H \leq 0.4$ and $5 \leq Re \leq 100$ without viscosity contrast (i.e. $\lambda = 1$), and showed that the equilibrium position was nearly independent of $Re$ (Schaaf & Stark Reference Schaaf and Stark2017). In a more recent numerical analysis by Alghalibi, Rosti & Brandt (Reference Alghalibi, Rosti and Brandt2019), simulations of a spherical hyperelastic particle in a circular channel with $d/D = 0.2$ were performed with $100 \leq Re \leq 400$ and Weber number $0.125 \leq We \leq 4.0$, the latter of which is the ratio of the inertial effect to the elastic effect acting on the particles. Their numerical results showed that regardless of $Re$, the final equilibrium position of a deformable particle was the centreline, and harder particles (i.e. with lower $We$) tended to migrate rapidly towards the channel centre (Alghalibi et al. Reference Alghalibi, Rosti and Brandt2019).
Although the equilibrium positions of non-spherical rigid particles have been investigated by both experimental observations (Masaeli et al. Reference Masaeli, Sollier, Amini, Mao, Camacho, Doshi, Mitragotri, Alexeev and Carlo2012) and a numerical simulation (Huang & Lu Reference Huang and Lu2017), the inertial migration of biconcave capsules that model RBCs has not been fully described yet. Numerical analyses have investigated the behaviour of RBCs under small  $Re$ in small microchannels, with simulations performed for a viscosity ratio $\lambda = 1$ and circular microchannels with $0.3 < d/D < 0.8$ (Fedosov et al. Reference Fedosov, Peltomäki and Gompper2014), and for a physiologically relevant viscosity ratio $\lambda = 5$ and a rectangular microchannel with $d/H = 0.8$ (Guckenberger et al. Reference Guckenberger, Kihm, John, Wagner and Gekle2018). Despite these efforts, there has been no comprehensive analysis of the inertial migration of RBCs in large microchannels with diameters of several dozen micrometres, $d/D \sim 0.1$.
Aiming for the precise description of the inertial migration of RBCs in a microchannel, we thus performed numerical simulations for individual RBCs with major diameter  $d = 8\,\mathrm {\mu }$m, subject to various $Ca$ in a circular microchannel with $D = 50\,\mathrm {\mu }$m (i.e. $d/D = 0.16$). Each RBC is modelled as a biconcave capsule, whose membrane follows the Skalak constitutive (SK) law (Skalak et al. Reference Skalak, Tozeren, Zarda and Chien1973). Since this problem requires heavy computational resources, we resort to graphics processing unit (GPU) computing, using the lattice Boltzmann method (LBM) for the inner and outer fluids, and the finite element method (FEM) to analyse the deformation of the RBC membrane. This model has been applied successfully to the analysis of multi-RBC interactions in circular microchannels (Takeishi et al. Reference Takeishi, Imai, Nakaaki, Yamaguchi and Ishikawa2014, Reference Takeishi, Imai, Yamaguchi and Ishikawa2015, Reference Takeishi, Rosti, Imai, Wada and Brandt2019b; Takeishi & Imai Reference Takeishi and Imai2017).
The remainder of this paper is organised as follows. Section 2 gives the problem statement and numerical methods. Section 3 presents the numerical results for single RBCs, and § 4 presents a discussion, followed by a summary of the main conclusions in § 5. Precise descriptions of the numerical set-up and membrane mechanics are presented in Appendices A and B, respectively.
2. Problem statement
2.1. Flow and cell models
We consider a cellular flow consisting of an external fluid (plasma), an internal fluid (cytoplasm), and RBC with major diameter  $d_0$ ( $= 2a_0 = 8\,\mathrm {\mu }$m) and maximum thickness $2\,\mathrm {\mu }$m ( $=a_0/2$) in a circular channel of diameter $D$ (
$D$ ( $=2R=50\,\mathrm {\mu }$m), with a resolution of 16 fluid lattices per major radius of RBC ( $=a_0$). The channel length is set to be 20 $a_0$, following previous numerical studies (Fedosov et al. Reference Fedosov, Peltomäki and Gompper2014; Takeishi et al. Reference Takeishi, Yamashita, Omori, Yokoyama and Sugihara-Seiki2021). To show that the channel length is adequate for investigating the behaviour of an RBC that is subject to inertial flow, we preliminarily assessed the effect of this length on the lateral movement of an RBC in Appendix A. The RBC is modelled as a biconcave capsule, or a Newtonian fluid enclosed by a thin elastic membrane.
The membrane is modelled as an isotropic and hyperelastic material following the SK law (Skalak et al. Reference Skalak, Tozeren, Zarda and Chien1973). The strain energy  $w$ of the SK law is given by
 \begin{equation} w = \frac{G_s}{4} \left( I_1^2 + 2I_1 - 2I_2 + C I_2^2\right), \end{equation}
where  $G_s$ is the surface shear elastic modulus, $C$ is a coefficient representing the area incompressibility, $I_1\ (= \lambda _1^2 + \lambda _2^2 - 2)$ and $I_2\ (= \lambda _1^2 \lambda _2^2 -1 = J_s^2 - 1)$ are the first and second invariants of the Green–Lagrange strain tensor, $\lambda _i$ ( $i = 1,2$) are the two principal in-plane stretch ratios, and $J_s = \lambda _1 \lambda _2$ is the Jacobian, which expresses the ratio of the deformed to reference surface areas. In this study, we set $C = 10^2$ (Barthés-Biesel, Diaz & Dheni Reference Barthés-Biesel, Diaz and Dheni2002). Bending resistance is also considered (Li et al. Reference Li, Dao, Lim and Suresh2005), with bending modulus $k_b = 5.0 \times 10^{-19}$ J (Puig-de-Morales-Marinkovic et al. Reference Puig-de-Morales-Marinkovic, Turner, Butler, Fredberg and Suresh2007). These membrane parameters successfully reproduced the deformation of RBCs in shear flow (Takeishi et al. Reference Takeishi, Imai, Nakaaki, Yamaguchi and Ishikawa2014, Reference Takeishi, Rosti, Imai, Wada and Brandt2019b), and also the thickness of the cell-depleted peripheral layer in circular channels (Takeishi et al. Reference Takeishi, Imai, Nakaaki, Yamaguchi and Ishikawa2014). We define the initial shape of an RBC as a biconcave shape.
Neglecting inertial effects on the membrane deformation, the static local equilibrium equation of the membrane is given by
 \begin{equation} \boldsymbol{\nabla}_s \boldsymbol{\cdot} {\boldsymbol{\mathsf{T}}} + {\boldsymbol{q}} = {\boldsymbol{0}}, \end{equation}
where  $\boldsymbol {\nabla }_s\ (= ( {\boldsymbol {I}} - {\boldsymbol {n}} {\boldsymbol {n}} ) \boldsymbol {\cdot } \boldsymbol {\nabla })$ is the surface gradient operator, ${\boldsymbol {n}}$ is the unit normal outward vector in the deformed state, ${\boldsymbol {q}}$ is the load on the membrane, and ${\boldsymbol{\mathsf{T}}}$ is the in-plane elastic tension that is obtained from the SK law (2.1). A more precise description of membrane mechanics is presented in Appendix B.
It is known that the usual distribution of the haemoglobin concentration in individual RBCs ranges from 27 to 37 g dl $^{-1}$, corresponding to an internal fluid viscosity $\mu _1 = 5\unicode{x2013}15$ cP ( $= 5\unicode{x2013}15$ mPa s) (Mohandas & Gallagher Reference Mohandas and Gallagher2008), while the normal plasma viscosity is $\mu _0 = 1.1\unicode{x2013}1.3$ cP ( $= 1.1\unicode{x2013}1.3$ mPa s) for plasma at 37 $^\circ$C (Harkness & Whittington Reference Harkness and Whittington1970). Hence the physiologically relevant viscosity ratio can be taken as $\lambda \ (= \mu _1/\mu _0) = 4.2\unicode{x2013}12.5$ if the plasma viscosity is set to be $\mu _0 = 1.2$ cP. In our study, therefore, the physiologically relevant viscosity ratio is set to be $\lambda = 5$. Unless otherwise specified, we show the results obtained with $\lambda = 5$.
The fluids are modelled as an incompressible Navier–Stokes equation, with a governing equation of fluid velocity  ${\boldsymbol {v}}$:
 \begin{gather} \rho \left( \frac{\partial {\boldsymbol{v}}}{\partial t} + {\boldsymbol{v}} \boldsymbol{\cdot} \boldsymbol{\nabla} {\boldsymbol{v}} \right)= \boldsymbol{\nabla}\boldsymbol{\cdot} {\boldsymbol{\mathsf{\sigma}}}^f + \rho {\boldsymbol{f}}, \end{gather}
 \begin{gather}\boldsymbol{\nabla}\boldsymbol{\cdot} {\boldsymbol{v}} = 0 \end{gather}
and
 \begin{equation} {\boldsymbol{\mathsf{\sigma}}}^f ={-}p{\boldsymbol{I}} + \mu \left(\boldsymbol{\nabla} {\boldsymbol{v}} + \boldsymbol{\nabla} {\boldsymbol{v}}^{\rm T} \right), \end{equation}
where  ${\boldsymbol{\mathsf{\sigma}}}^f$ is the total stress tensor of the flow, $p$ is the pressure, $\rho$ is the fluid density, ${\boldsymbol {f}}$ is the body force, and $\mu$ is the viscosity of liquids, which is expressed using a volume fraction of the inner fluid $\alpha$ ( $0\leq \alpha \leq 1$) as
 \begin{equation} \mu = \left\{ 1 + \left( \lambda - 1 \right) \alpha \right\} \mu_0. \end{equation}
The dynamic condition requires the load  ${\boldsymbol {q}}$ to be equal to the traction jump ( ${\boldsymbol{\mathsf{\sigma}}}^f_{out} - {\boldsymbol{\mathsf{\sigma}}}^f_{in}$) across the membrane:
 \begin{equation} {\boldsymbol{q}} = \left( {\boldsymbol{\mathsf{\sigma}}}^f_{out} - {\boldsymbol{\mathsf{\sigma}}}^f_{in} \right) \boldsymbol{\cdot} {\boldsymbol{n}}, \end{equation}
where the subscripts ‘out’ and ‘in’, respectively, represent the outer and internal regions of the capsule, and  ${\boldsymbol {n}}$ is the unit normal outward vector in the deformed state.
The problem is characterised by Reynolds number  $Re$ and capillary number $Ca$:
$Ca$:
 \begin{gather} Re = \frac{\rho D\,V_{{max}}^{\infty}}{\mu_0}, \end{gather}
 \begin{gather}Ca = \frac{\mu_0 \dot{\gamma}_{m} a_0}{G_s} = \frac{\mu_0\, V_{{max}}^{\infty}}{G_s}\,\frac{a_0}{4 R}, \end{gather}
where  $V_{{max}}^{\infty }\ (= 2V_{m}^{\infty })$ is the maximum plasma velocity in the absence of any cells, and $\dot {\gamma }_{m}\ (= V_{m}^{\infty }/D)$ is the mean shear rate. Increasing $Re$ under constant $Ca$ corresponds to increasing $G_s$, namely, a harder RBC.
2.2. Numerical simulation and set-up
The governing equations for the fluid are discretised by the LBM based on the D3Q19 model (Chen & Doolen Reference Chen and Doolen1998). We track the Lagrangian points of the membrane material points  ${\boldsymbol {x}}({\boldsymbol {X}},t)$ over time, where ${\boldsymbol {X}}$ is a material point on the membrane in the reference state. Based on the virtual work principle, the above strong-form equation (2.2) can be rewritten in weak form as
 \begin{equation} \int_S {\boldsymbol{\hat{u}}} \boldsymbol{\cdot} {\boldsymbol{q}}\,{\rm d} S = \int_S \hat{\boldsymbol{\mathsf{\epsilon}}} : {\boldsymbol{\mathsf{T}}}\,{\rm d} S, \end{equation}
where  ${\boldsymbol {\hat {u}}}$ and $\hat {\boldsymbol{\mathsf{\epsilon}}} = ( \boldsymbol {\nabla }_s {\boldsymbol {\hat {u}}} + \boldsymbol {\nabla }_s {\boldsymbol {\hat {u}}}^{\rm T})/2$ are the virtual displacement and virtual strain, respectively. The FEM is used to solve (2.10) and obtain the load ${\boldsymbol {q}}$ acting on the membrane (Walter et al. Reference Walter, Salsac, Barthés-Biesel and Tallec2010). The velocity at the membrane node is obtained by interpolating the velocities at the fluid node using the immersed boundary method (Peskin Reference Peskin2002). The membrane node is updated by Lagrangian tracking with the no-slip condition. The explicit fourth-order Runge–Kutta method is used for the time integration. The volume-of-fluid method (Yokoi Reference Yokoi2007) and front-tracking method (Unverdi & Tryggvason Reference Unverdi and Tryggvason1992) are employed to update the viscosity in the fluid lattices. A volume constraint is implemented to counteract the accumulation of small errors in the volume of the individual cells (Freund Reference Freund2007): in our simulation, the volume error is always maintained lower than $1.0 \times 10^{-3}\,\%$, as tested and validated in our previous study of cell flow in circular channels (Takeishi et al. Reference Takeishi, Imai, Ishida, Omori, Kamm and Ishikawa2016). All procedures were fully implemented on a GPU to accelerate the numerical simulation. More precise explanations are provided in our previous work (see also Takeishi et al. Reference Takeishi, Rosti, Imai, Wada and Brandt2019b).
The channel flow is generated by a pressure gradient. Periodic boundary conditions are imposed on flow direction ( $z$-direction). No-slip conditions are employed for the walls (radial direction). The resolution that we set has been shown to represent successfully single- and multi-cellular dynamics (Takeishi et al. Reference Takeishi, Imai, Nakaaki, Yamaguchi and Ishikawa2014, Reference Takeishi, Rosti, Imai, Wada and Brandt2019b, Reference Takeishi, Yamashita, Omori, Yokoyama and Sugihara-Seiki2021); the mesh size of the LBM for the fluid solution was set to be 250 nm, and that of the finite elements describing the membrane was approximately 250 nm (an unstructured mesh with 5120 elements was used for the FEM). This resolution has been shown to represent successfully single- and multi-cellular dynamicsn (Takeishi et al. Reference Takeishi, Imai, Nakaaki, Yamaguchi and Ishikawa2014).
2.3. Analysis
To quantify the effects of the radial position of the RBC centroid and the shape of the deformed cell on fluid flow, the power (or energy dissipation) associated with membrane deformations is considered, and is given by
 \begin{gather} \delta W_{{mem}} = \int \hat{{\boldsymbol{q}}} \boldsymbol{\cdot} \left( {\boldsymbol{v}}^{(m)} - {\boldsymbol{V}}^\infty (r) \right) {\rm d} S, \end{gather}
 \begin{align} \delta W_{mem} &= \frac{\mu_0 D\,V_{max}^{\infty 2}}{2} \int \hat{{\boldsymbol{q}}}^\ast \boldsymbol{\cdot} \left( {\boldsymbol{v}}^{(m)\ast} - {\boldsymbol{V}}^{\infty \ast} (r) \right) {\rm d} S^\ast \nonumber\\ &= \frac{\mu_0 D\,V_{max}^{\infty 2}}{2} \int \left[ \hat{q}_x^\ast v_x^{(m) \ast} + \hat{q}_y^\ast v_y^{(m) \ast} + \hat{q}_z^\ast \left( v_z^{(m) \ast} - {V}_z^{\infty \ast} (r) \right) \right] {\rm d} S^\ast, \end{align}
 \begin{gather} \delta W_{mem}^\ast = \delta W_{mem}/\left( \mu_0 D\,V_{max}^{\infty 2}/2 \right), \end{gather}
where  ${\boldsymbol {V}}^\infty (r) = (0, 0, V_{max}^\infty [ 1 - (r/R)^2] )$ is the fluid flow velocity without cells, $\hat {{\boldsymbol {q}}}$ is the load acting on the membrane and includes the contribution of bending rigidity, $r$ is the membrane distance from the channel centre, ${\boldsymbol {v}}^{(m)}$ is the interfacial velocity of the membrane, and $S$ is the membrane surface area. Here, non-dimensional variables are defined as $\hat {{\boldsymbol {q}}}^\ast = \hat {{\boldsymbol {q}}}/(\mu _0 \dot {\gamma }_{m})$, ${\boldsymbol {v}}^{(m) \ast } = {\boldsymbol {v}}^{(m)}/V_{{max}}^\infty$, ${\boldsymbol {V}}^{\infty \ast } = {\boldsymbol {V}}^{\infty }/V_{{max}}^\infty$ and $S^\ast = S/D^2$.
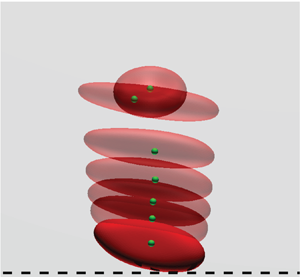
For the following analysis, the behaviour of RBCs in the channel is quantified by an orientation angle  $\varPsi$ on the cross-sectional area of the channel as shown in figure 1(a), where $\varPsi$ is the angle between the radial direction towards the RBC centroid and the normal vector at the initial concave node point. Following previous numerical studies (Takeishi et al. Reference Takeishi, Rosti, Imai, Wada and Brandt2019b, Reference Takeishi, Yamashita, Omori, Yokoyama and Sugihara-Seiki2021), we define two types of RBC flow modes depending on equilibrium orientation angle $\varPsi _\infty$. If $\varPsi$ orients perpendicular to the radial direction, i.e. $|\varPsi _\infty | \sim {\rm \pi}/2$, showing a wheel-like configuration, then the flow mode is defined as a rolling motion (see figure 1b). On the other hand, if $\varPsi$ orients parallel to the radial direction, i.e. $|\varPsi _\infty | \sim 0$ and ${\rm \pi}$, showing a flipping motion, then the flow mode is defined as a tumbling motion (see figure 1c). More detailed transitions of $\varPsi$ in each mode are described in below (see figure 2). Time averaging starts after the orientation angle and radial position of RBC reach their final values, and the time averaging size is usually set to be $\dot {\gamma }_{m} t \geq 10^2$.
(a) Representative snapshot of the RBC orientation angle  $\varPsi$ on the cross-sectional area of the channel, where $\varPsi$ is the angle between the radial direction towards the RBC centroid and the normal vector at the initial concave node point. (b,c) Snapshots of representative (b) stable rolling motion with $|\varPsi _\infty | \sim {\rm \pi}/2$, and (c) tumbling motion with $|\varPsi _\infty | \sim 0$ and ${\rm \pi}$, where green dots represent material points at the initial concave node point, and blue dots represent those at the initial edge node point. Flow direction is from left to right.

(a) Time history of the orientation angle  $|\varPsi |/{\rm \pi}$ on the cross-sectional ( $x$–
$x$– $y$) plane for different initial orientation angles $\varPsi _0$ ( $={\rm \pi} /32$ and ${\rm \pi} /16$) and different $Ca$ ( $=0.05$ and 1.2), where the dashed line and dash-dotted line represent $|\varPsi | = {\rm \pi}/2$ and $|\varPsi | = {\rm \pi}$, respectively (see supplementary movies 1 and 2 available at https://doi.org/10.1017/jfm.2022.936). (b) Time history of the deformation index $a_{max}/a_0$ for different $\varPsi _0$ ( $={\rm \pi} /32$, ${\rm \pi} /16$ and ${\rm \pi} /8$) and different $Ca$ ( $=0.05$ and 1.2). The results are obtained with low $Re$ ( $=0.2$). (c,d) Diagrams of the final stable orientation of the RBC subject to different $Ca$ for different initial orientations $\varPsi _0$. The results for $Re = 0.2$ and 10 are reported in (c,d), respectively. The RBC images represent the steady state of the RBC at the equilibrium orientation $|\varPsi _\infty |$. Circles denote stable rolling motion ( $|\varPsi _\infty | \sim {\rm \pi}/2$), and squares denote stable tumbling motion (cyclic $|\varPsi _\infty | \sim 0$ and ${\rm \pi}$). All results are obtained with $r_0/R = 0.25$ and $\lambda = 5$.

3. Results
3.1. Effect of initial orientation angle  $\varPsi _0$ on stable flow mode

We first investigate the equilibrium orientation angle  $\varPsi _\infty$ on the cross-sectional ( $x$–
$x$– $y$) plane depending on the initial orientation angle $\varPsi _0$. Simulations are started from a slightly off-centre radial position, with the radial position of the RBC centroid set as $r_0/R = 0.25$, where $r_0$ is the distance from the channel centre to the RBC centroid on the cross-sectional plane. The time history of $\varPsi$ for different initial orientation angles $\varPsi _0$ ( $= {\rm \pi}/32$ and ${\rm \pi} /16$) and different $Ca$ ( $=0.05$ and 1.2) are shown in figure 2(a). The results are obtained with low $Re$ ( $=0.2$), and can be assumed to be almost inertialess (Takeishi et al. Reference Takeishi, Rosti, Imai, Wada and Brandt2019b, Reference Takeishi, Yamashita, Omori, Yokoyama and Sugihara-Seiki2021). An RBC that is subject to low $Ca$ ( $=0.05$) and that is only slightly tilted, with $\varPsi _0 = {\rm \pi}/32$, gradually orients parallel to the radial plane, showing a wheel-like configuration, the so-called rolling motion with $|\varPsi _\infty | \sim {\rm \pi}/2$ (blue line in figure 2a) (see supplementary movie 1). In contrast, an RBC that is subject to high $Ca$ ( $=1.2$) and that is further tilted, with $\varPsi _0 = {\rm \pi}/16$, immediately shows a flipping motion, with cyclic $|\varPsi _\infty | \sim 0$ and ${\rm \pi}$, the so-called tumbling motion (red line in figure 2a) (see supplementary movie 2). The characteristic time histories in these modes persist even when $Re$ increases from 0.2 to 10 (data not shown). The results show further that the aforementioned two different types of modes have completed at relatively early time periods $O(\dot {\gamma }_{m} t) \leq 10^2$ (see also figure 3b). Oriented RBCs, however, are still migrating towards the radial direction in each stable mode.
(a) Snapshots of a rolling RBC ( $|\varPsi _\infty | \sim {\rm \pi}/2$) subject to different $Ca$ ( $=0.05$, 0.2, 0.5 and 1.2) in $Re = 10$, where results are at $\dot {\gamma }_{m}t = 1500$ for $Ca = 0.05$ and 0.2, and at $\dot {\gamma }_{m} t = 2000$ for $Ca = 0.5$ and 1.2. The RBCs start from the near-wall position $r_0/R = 0.8$. The temporal changes corresponding to these snapshots are shown in supplementary movies: movie 3 for $Ca = 0.05$, movie 4 for $Ca = 0.2$, and movie 5 for $Ca = 1.2$, respectively. (b) Time history of the radial position of the RBC centroid $r/R$, where the RBC images represent snapshots of the axial view of an RBC subject to $Ca = 0.2$ (at $\dot {\gamma }_{m} t = 0$, 100 and 1500). (c) Time history of the powers associated with membrane deformation $\delta W_{mem}^\ast$.

The degree of cell deformation is quantified by the maximal radius  $a_{max}$ of deformed RBCs, and is obtained from the eigenvalues of the inertia tensor of an equivalent ellipsoid approximating deformed RBCs (Ramanujan & Pozrikidis Reference Ramanujan and Pozrikidis1998). The time history of $a_{max}/a_0$ is shown in figure 2(b). The tumbling RBC exhibits large cyclic extension with the same period as its rotations (figure 2(b), red solid line), while the rolling RBC has relatively small fluctuations in $a_{max}/a_0$ (figure 2(b), blue solid line). For the same $Ca$ ( $=1.2$), the rolling RBC exhibits greater extension than the tumbling RBC (figure 2(b), red dashed line).
The stable orientation  $\varPsi _\infty$ of RBCs is investigated for different initial orientation angles $\varPsi _0$, different $Ca$ ( $=0.05$–1.2), and different $Re$ ( $=0.2$ and 10), and the results are summarised in figures 2(c) and 2(d). At low $Re$ ( $=0.2$), RBCs subject to low $Ca$ ( $=0.05$) have a rolling motion ( $|\varPsi _\infty | \sim {\rm \pi}/2$) for $\varPsi _0 \geq {\rm \pi}/32$ (figure 2c). This result suggests that most RBCs tend to have a rolling motion. As $Ca$ increases, RBCs tend to have a tumbling motion, for $\varPsi _0 \leq {\rm \pi}/16$ (figure 2c). Since the rolling motion of RBCs subject to $Ca = 1.2$ is observed at least for $\varPsi _0 \geq 3{\rm \pi} /32$, the dominant flow mode is still a rolling motion even at high $Ca$ (figure 2c).
At high  $Re$ ( $=10$), all RBCs have a rolling motion even at low $Ca$ ( $= 0.05$), as shown in figure 2(d). Hence finite inertia imposes disturbances on the membrane, which potentially allows RBCs to have a stable rolling motion. For higher $Ca$ ( $= 1.2$), the final stable mode depends on initial orientation angle $\varPsi _0$ but remains the same as in the case with almost no inertia ( $Re = 0.2$), where the tumbling motion appears for $0 \leq \varPsi _0 \leq {\rm \pi}/16$, and the rolling motion is seen for $\varPsi _0 \geq 3{\rm \pi} /32$ (figure 2d). Comparing with the case of low $Re = 0.2$, the higher $Re$ conditions impede the tumbling motion (figures 2c,d).
3.2. Effect of capillary number $Ca$ on equilibrium radial position

Next, we investigate the equilibrium radial position of an RBC centroid at  $Re = 10$ for different $Ca$. Figure 3(a) shows snapshots of stable rolling RBCs ( $|\varPsi _\infty | \sim {\rm \pi}/2$), each subject to different $Ca$, when they have reached each equilibrium radial position (figure 3b). All RBCs start from the near-wall position $r_0/R = 0.8$ with the initial orientation angle $\varPsi _0 = {\rm \pi}/4$. As $Ca$ increases, the RBCs are extended to the flow direction (figure 3a). Figure 3(b) is the time history of the RBC centroid for different $Ca$, where RBC images represent snapshots of the axial view of an RBC subject to low $Ca$ ( $= 0.2$) at specific time points $\dot {\gamma }_{m} t = 0$, 100 and 1500 (see supplementary movie 4). At low $Ca$ ( $= 0.2$), the RBC exhibits a stable rolling motion within a relatively early time period $\dot {\gamma }_{m} t \leq 100$ (see RBC images in figure 3b), and then the RBC attains the radial position $r/R \approx 0.2$. At the highest $Ca$ ( $= 1.2$) in this paper, the RBC is still migrating towards the channel centre even after time $\dot {\gamma }_{m} t = 2000$ (figure 3b) (see supplementary movie 5). Note that the volumetric flow rate, which is inversely proportional to the apparent viscosity, remains almost the same independent of the equilibrium radial position (data not shown), i.e. the flow resistances are not changed significantly by RBC deformation.
The time histories of powers associated with membrane deformations  $\delta W_{mem}^\ast$ are shown in figure 3(c). The result shows that powers $\delta W_{mem}^\ast$ tend to decrease as $Ca$ increases. Although $\delta W_{mem}^\ast$ is still decreasing at the highest $Ca$ ( $= 1.2$), the power basically retains the same order of magnitude for each $Ca$ (figure 3c) after the onset of stable rolling motion.
Figure 4(a) shows the time average of the radial position  $\langle r \rangle /R$ as a function of $Ca$, where the error bars represent standard deviations along the time axis (i.e. time fluctuation). Hereafter, $\langle {\cdot } \rangle$ denotes the time average. As $Ca$ increases, RBCs tend to migrate towards the channel centre, thus inertial migration is impeded by deformability (figure 4a). Since the RBC subject to the highest $Ca$ ( $=1.2$) is still in axial migration, the average radial position $\langle r \rangle /R$ is obtained with data from $\dot {\gamma }_{m} t = 1500$–2000. Figure 4(b) indicates the time average of deformation index $\langle a_{max} \rangle /a_0$, and shows that $\langle a_{max} \rangle /a_0$ increases with $Ca$.
$Ca$.
(a) Time average of the radial position  $\langle r \rangle /R$ of an RBC centroid, (b) maximum length $\langle a_{{max}} \rangle /a_0$ of a deformed RBC, (c) powers $\langle \delta W_{{mem}}^\ast \rangle$ associated with membrane deformations occurring with a stable rolling motion ( $|\varPsi _\infty | \sim {\rm \pi}/2$) – all presented as functions of $Ca$. (d) Replotted data of $\langle \delta W_{{mem}}^\ast \rangle$ as a function of equilibrium radial position $\langle r \rangle /R$ for different $Ca$. Results at $Ca = 1.2$ are for an RBC in transit (still migrating towards the channel centre), represented by shaded triangles. All results are obtained with $Re = 10$ and $r_0/R = 0.8$.

The powers  $\langle \delta W_{mem}^\ast \rangle$ as a function of $Ca$ are shown in figure 4(c). The powers $\langle \delta W_{mem}^\ast \rangle$ decrease as $Ca$ increases, which is similar in tendency to the radial position $\langle r \rangle /R$ (figure 4a) and is opposite to that of the maximum radius $\langle a_{max} \rangle /a_0$ (figure 4b). The relationship between $\langle \delta W_{mem}^\ast \rangle$ and $\langle r \rangle /R$ is replotted in figure 4(d). The order of magnitude of the power $\langle \delta W_{mem}^\ast \rangle$ decreases as the equilibrium radial position $\langle r \rangle /R$ decreases (figure 4d).
3.3. Effects of flow modes and initial positions $r_0/R$ on equilibrium radial position

To clarify how the aforementioned flow modes affect the equilibrium radial positions of RBC centroids, we investigate the effect of the stable flow modes of RBCs on equilibrium radial positions  $\langle r \rangle /R$ as well as the power $\langle \delta W_{{mem}}^\ast \rangle$ under specific $Re = 10$ and $Ca = 1.2$. The effects of the initial radial position $r_0$ on $\langle r \rangle /R$ and $\langle \delta W_{{mem}}^\ast \rangle$ are also investigated. Two different stable modes are controlled by the initial orientation angle $\varPsi _0$, as seen in figure 2.
Figures 5(a) and 5(b) show snapshots of flowing RBCs subject to the highest  $Ca$ ( $= 1.2$) for different initial orientation angles $\varPsi _0$ ( $= 0$ and ${\rm \pi} /4$) at the initial state ( $\dot {\gamma }_{m} t = 0$) and the final time point ( $\dot {\gamma }_{m} t = 1500$). The RBC starting from $\varPsi _0 = 0$ exhibits a flipping or tumbling motion, and assumes a flattened croissant-like shape that is convex at the front and concave at the rear (figure 5a). This tumbling motion allows the RBC to migrate towards the wall from the initial near-centre position $r_0/R = 0.16$ to $r/R = 0.2812$ (figure 5(c), green solid line). The RBCs initially placed near a centre position ( $r_0/R = 0.04$) with $\varPsi _0 = 0$ require a long period of time to reach this $r/R$ threshold ( $= 0.2812$) (figure 5(c), blue solid line). The RBC starting from $\varPsi _0 = {\rm \pi}/4$ exhibits an elongated rolling motion, as shown in figure 5(b), and tends to migrate towards the channel centre (figure 5(c), green dashed line). Such equilibrium radial positions are basically independent of the initial radial position $r_0/R$, except for the case $r_0/R = 0$, where the RBC starting from $\varPsi _0 = 0$ remains almost on the channel axis, $O(r/R) = 10^{-3}$, without an obvious tumbling motion (figure 5(c), black solid line). Travel on the channel axis is also observed in the case with $r_0/R = 0.04$ and $\varPsi _0 = {\rm \pi}/4$ (figure 5(c), blue dashed line). Considering a linear estimation for the speed of axial migration, corresponding to the gradient of the time history of radial positions of RBC centroids, using data between $\dot {\gamma }_{m} t = 1500$ and $\dot {\gamma }_{m} t = 2000$, rolling RBCs starting from $r_0/R = 0.8$ and 0.16 will reach the near-centre position $O(r/R) \leq 10^{-2}$ at $\dot {\gamma }_{m}t = 4500$ and 3800, respectively.
Snapshots of RBCs at initial state ( $\dot {\gamma }_{m} t = 0$) and during fully developed tumbling and rolling motions ( $\dot {\gamma }_{m} t = 1500$), where the initial orientation angles are set to (a) $\varPsi _0 = 0$, and (b) $\varPsi _0 = {\rm \pi}/4$, respectively. The upper and lower snapshots show the top view and side view, respectively. (c) Time history of the radial position of RBC centroids for different $r_0/R$ and $\varPsi _0$. Solid lines indicate $\varPsi _0 = 0$, and dashed lines indicate $\varPsi _0 = {\rm \pi}/4$. The dash-dotted line represents the equilibrium radial position of tumbling RBCs with $r/R = 0.2812$. The results are obtained with $Re = 10$ and $Ca = 1.2$.

Figure 6(a) shows the time average of the radial position  $\langle r \rangle /R$ as a function of the initial radial position $r_0/R$ for different initial orientation angles $\varPsi _0$ ( $= 0$ and ${\rm \pi} /4$). As described above, tumbling RBCs reach the threshold value $r/R = 0.2812$, while rolling RBCs exhibit axial migration (figure 6a). Since rolling RBCs are elongated in the flow direction, their maximal radius $a_{max}$ in the deformed shape tends to be greater than that of tumbling RBCs (figure 6b). Due to the large cyclic extension of tumbling RBCs, as shown in figure 2(b), the time-dependent fluctuation in $a_{max}/a_0$ is greater in tumbling RBCs than in rolling ones.
(a) Time average of the radial position  $\langle r \rangle /R$ of an RBC centroid, (b) maximum length $\langle a_{{max}} \rangle /a_0$ of a deformed RBC, and (c) powers $\langle \delta W_{{mem}}^\ast \rangle$ associated with membrane deformations – all shown as functions of the initial radial position $r_0/R$ and initial orientation angles $\varPsi _0$ ( $= 0$ and ${\rm \pi} /4$). (d) Replotted data of $\langle \delta W_{{mem}}^\ast \rangle$ as a function of equilibrium radial position $\langle r \rangle /R$. Rolling RBCs starting from $\varPsi _0 = {\rm \pi}/4$ and $r_0/R \geq 0.16$ are in transit (still migrating toward the channel centre), and are represented by grey-shaded triangles. All results are obtained with $Re = 10$ and $Ca = 1.2$.

Figure 6(c) shows the powers  $\langle \delta W_{mem}^\ast \rangle$ as a function of the initial radial position $r_0/R$ for different initial orientation angles $\varPsi _0$. Since RBCs flowing near the channel axis are associated with low energy expenditure independently of $\varPsi _0$, it is expected that rolling RBCs with $0.16 \leq r_0/R \leq 0.8$ (grey-shaded triangles in figure 6c) will also reach a small order of magnitude of the powers $O(\langle \delta W_{mem}^\ast \rangle ) \leq$ 10 $^{-3}$. The results of $\langle \delta W_{mem}^\ast \rangle$ are replotted as a function of $\langle r \rangle /R$ (figure 6d). The result suggests that the orders of magnitude of the powers $\langle \delta W_{mem}^\ast \rangle$ correlate with the (equilibrium) radial position, which in turn is associated with stable flow mode.
3.4. Effect of $Re$ on equilibrium radial position

The effect of  $Re$ on the equilibrium radial positions of RBC centroids is also investigated for specific $Ca = 1.2$ and initial radial position $r_0/R = 0.16$. Representative snapshots of RBCs at each equilibrium radial position are shown in figure 7(a). Off-centred rolling of RBCs is seen clearly for $Re \geq 15$, while the axially migrated RBC under $Re = 3$ does not exhibit a characteristic flow mode because of the low shear rate region (figure 7a). Figure 7(b) shows the time history of RBC centroids $r/R$ for different $Re$. The inertial migration of rolling RBCs subject to $Ca = 1.2$ requires at least $Re \geq 15$ (figure 7b). The speed of axial migration increases as $Re$ ( $\leq 10$) decreases (figure 7b). For RBCs at lower $Re \leq 1$, axial speeds estimated linearly using data between $\dot {\gamma }_{m} t = 0$ and $\dot {\gamma }_{m} t=200$ predict axial migration ( $O(\langle r \rangle /R) \leq 10^{-2}$) within $\dot {\gamma }_{m}t = 500$. Complete axial migration at such low $Re$ cannot be confirmed practically due to heavy computational load. Instead, we perform a simulation at $Re = 0.2$ in a smaller channel with $D = 20\,\mathrm {\mu }$m, and find that RBCs exhibit axial migration regardless of $Ca$ (see figure 12, in Appendix A). In the time-averaged results, data are shown only for cases in which RBCs have reached each equilibrium radial position (i.e. $Re = 3$, 15, 20 and 30).
(a) Snapshots of RBCs subject to  $Ca = 1.2$ for different $Re$ at the equilibrium radial position: $\dot {\gamma }_{m} t = 750$ for $Re = 3$, and $\dot {\gamma }_{m} t = 1500$ for $Re = 15$, 20 and 30. (b) Time history of radial positions of RBC centroids for different $Re$. All RBCs exhibit rolling motion ( $|\varPsi _\infty | \sim {\rm \pi}/2$). The results are obtained with $Ca = 1.2$ and $r_0/R = 0.16$.

Figure 8(a) shows the time average of the radial position  $\langle r \rangle /R$ as a function of $Re$. RBCs flowing at large $\langle r \rangle /R$ experience high shear stress, resulting in large deformation $a_{{max}}/a_0$ as shown in figure 8(b).
(a) Time average of the radial position  $\langle r \rangle /R$ of an RBC centroid, (b) maximum length $\langle a_{{max}} \rangle /a_0$ of a deformed RBC, and (c) powers $\langle \delta W_{{mem}}^\ast \rangle$ associated with membrane deformations – all are shown as functions of $Re$. (d) Replotted data of $\langle \delta W_{{mem}}^\ast \rangle$ as a function of equilibrium radial position $\langle r \rangle /R$ for different $Re$. Results are obtained with $Ca = 1.2$ and $r_0/R = 0.16$.

Figure 8(c) shows the powers  $\langle \delta W_{{mem}}^\ast \rangle$ as a function of $Re$. Although axially migrated RBCs are associated with low energy expenditure $O(\langle \delta W_{{mem}}^\ast \rangle ) = 10^{-3}$, inertially migrated RBCs are associated with high energy expenditure $O(\langle \delta W_{{mem}}^\ast \rangle ) = 10^{-2}$ (figure 8c), which is consistent with the results in figure 6(c). The relationship between $\langle \delta W_{mem}^\ast \rangle$ and $Re$ remains the same even when the data are replotted as a function of $\langle r \rangle /R$, where $\langle \delta W_{mem}^\ast \rangle$ increases with increased $Re$ or $\langle r \rangle /R$ increases (figure 8d).
3.5. Effect of viscosity ratio $\lambda$ on equilibrium radial position

To clarify the impact of the physiologically relevant viscosity ratio  $\lambda$ ( $= 5$ in this study) on the equilibrium radial positions of RBC centroids, we simulate the behaviour of RBCs with $\lambda$ being unity. The time histories of radial position $r/R$ obtained with $\lambda = 1$ are added in figures 3(b) and 7(b), and are shown in figures 9(a) and 9(b), respectively. When $\lambda$ decreases from 5 to 1, the RBCs under $Re = 10$ immediately migrate towards the channel centre, and the equilibrium radial position is decreased at each $Ca$ ( $= 0.05$ and 1.2; figure 9a). In particular, at the highest $Ca = 1.2$, the RBC exhibits complete axial migration with $\dot {\gamma }_{m} t = 1500$. The decrease in the equilibrium radial positions of RBC centroids is consistent even for large $Re$, as shown in figure 9(b). However, the RBC subject to $Ca = 1.2$ still exhibits inertial migration, at least for $Re \geq 20$, even for $\lambda = 1$ (figure 9b). For the additional runs with $\lambda = 1$, the stable flow mode remains the rolling motion. Overall, the low $\lambda$ ( $= 1$) condition impedes inertial migration (figures 9a,b).
Time histories of the radial position of an RBC centroid for different (a)  $Ca$ and (b) $Re$, where the results obtained with $\lambda = 1$ are added to figures 3(b) and 7(b). The RBC images show snapshots of a flowing RBC at each equilibrium position for $Re = 30$ and $\lambda = 1$ and 5. Replotted data of $\langle \delta W_{{mem}}^\ast \rangle$ as a function of equilibrium radial position $\langle r \rangle /R$ for different (c) $Ca$ and (d) $Re$. All RBCs exhibit stable rolling motion ( $|\varPsi _\infty | \sim {\rm \pi}/2$).

The relationship between  $\langle r \rangle /R$ and $\langle \delta W_{mem} \rangle$ obtained with $\lambda = 1$ is superimposed on the results for $\lambda = 5$ (figures 4(d) and 8(d)), and the results are plotted on an estimated curve obtained with $\lambda = 5$, as shown in figures 9(c) and 9(d). The tendency remains the same even at low $\lambda$ ( $= 1$).
3.6. Equilibrium radial position of a spherical capsule
To clarify whether the equilibrium radial positions of a biconcave capsule with the initial position  $r_0$ shown in figure 5(c) can also be predicted using a spherical capsule, simulations are performed with a spherical capsule whose radius is defined to yield the same volume as the biconcave capsule (i.e. $a_{sphere} = 2.71\,\mathrm {\mu }$m). Representative snapshots of the spherical capsule starting with $r_0/R = 0.8$ are shown in figure 10(a), where the viscosity ratio $\lambda$ is set to be the same as with the biconcave capsule ( $\lambda = 5$). The capsule gradually migrates towards the centre, exhibiting a tank-treading motion, and reaches $r/R = 0.2665$ at $\dot {\gamma }_{m} t = 1000$, which is almost the same value as that obtained with the tumbling motion of the biconcave capsule ( $r/R = 0.2812$; figure 5c). A spherical capsule initially placed on the channel axis $r_0/R = 0$ remains in the initial radial position, which is consistent with the result obtained with a biconcave capsule (figure 5c). The spherical capsule with $\lambda = 1$ reaches $r/R = 0.2552$ at $\dot {\gamma }_{m} t = 1000$, which is still close to the threshold obtained with the RBC (figure 10b).
(a) Snapshots of a spherical capsule with  $\lambda = 5$ initially placed at $r_0/R = 0.8$ for $Ca = 1.2$ and $Re = 10$ at specific time points $\dot {\gamma }_{m} t = 0$ (left), $\dot {\gamma }_{m} t$ = 100 (centre) and $\dot {\gamma }_{m} t = 1000$ (right). (b) Time history of the radial positions of spherical capsules for different $r_0/R$ ( $= 0$ and 0.8) and different $\lambda = 1$ and 5. The RBC images show snapshots of spherical capsules at each equilibrium position. The equilibrium radial position ( $r/R = 0.2812$) obtained with a tumbling RBC with $\lambda = 5$ (figure 5b) is also displayed as a black dashed line.

4. Discussion
In contrast to a large number of previous studies of RBC flow mode, especially under shear flow, little is known about inertial migration of non-spherical (biconcave) capsules in a channel flow. Furthermore, it is still uncertain what is the relationship between those stable flow modes and the equilibrium radial position of an RBC centroid on the cross-sectional area of the channel. We address these issues by numerical simulations in the present study.
The dynamics of single RBCs has been well investigated experimentally, in particular under simple shear flow fields. For instance, RBCs subjected to a low shear rate exhibit rigid-body-like flipping, the so-called tumbling motion (Schmid-Schönbein & Wells Reference Schmid-Schönbein and Wells1969; Fischer Reference Fischer2004; Dupire, Abkarian & Viallat Reference Dupire, Abkarian and Viallat2010), and wheel-like rotation, the so-called rolling motion (Dupire, Socol & Viallat Reference Dupire, Socol and Viallat2012; Lanotte et al. Reference Lanotte, Mauer, Mendez, Fedosov, Fromental, Claveria, Nicoul, Gompper and Abkarian2016). Meanwhile, RBCs subjected to high shear rates exhibit the so-called tank-treading motion (Schmid-Schönbein & Wells Reference Schmid-Schönbein and Wells1969; Fischer, Stöhr-Liesen & Schmid-Schönbein Reference Fischer, Stöhr-Liesen and Schmid-Schönbein1978; Fischer Reference Fischer2004). The swinging motion was introduced by Abkarian, Faivre & Viallat (Reference Abkarian, Faivre and Viallat2007) as an oscillating orientation of tank-treading motion in the case of relatively low viscosity  $\lambda \sim 0.5$. Despite these reports, it is still difficult to control the initial angle of RBCs under flow by experimental techniques. In the experiment by Dupire et al. (Reference Dupire, Socol and Viallat2012), they focused more specifically on the cells for which the initial angle of the cell axis of revolution is in the shear plane. Although previous numerical results showed that a trajectory of RBC orientation angles depends on initial orientations (Dupire et al. Reference Dupire, Abkarian and Viallat2010; Lanotte et al. Reference Lanotte, Mauer, Mendez, Fedosov, Fromental, Claveria, Nicoul, Gompper and Abkarian2016), there is no precise description about bistable flow modes of RBCs under finite $Re$. The stable configurations of flowing RBCs especially under low $Re$ ( $<1$) in microchannels smaller than a dozen micrometres have been investigated intensively both experimentally (Skalak & Branemark Reference Skalak and Branemark1969; Gaehtgens, Dührssen & Albrecht Reference Gaehtgens, Dührssen and Albrecht1980; Tomaiuolo et al. Reference Tomaiuolo, Simeone, Martinelli, Rotolib and Guido2009; Guckenberger et al. Reference Guckenberger, Kihm, John, Wagner and Gekle2018) and in numerical simulations (Freund & Orescanin Reference Freund and Orescanin2011; Freund Reference Freund2014; Guckenberger et al. Reference Guckenberger, Kihm, John, Wagner and Gekle2018; Takeishi et al. Reference Takeishi, Ito, Kaneko and Wada2019a, Reference Takeishi, Yamashita, Omori, Yokoyama and Sugihara-Seiki2021). For instance, using a two-dimensional droplet model, the numerical studies in Kaoui, Biros & Misbah (Reference Kaoui, Biros and Misbah2009) clearly showed that the shape transition in an unbounded Poiseuille flow occurred when a dimensionless vesicle deflation number, representing shape stability, fell below a certain value. The effect of degree of confinement $d/W$ ( $=0.1$–0.8, where $d$ is the vesicle diameter, and $W$ is the channel width) on the vesicle mode was investigated in Kaoui et al. (Reference Kaoui, Tahiri, Biben, Ez-Zahraouy, Benyoussef, Biros and Misbah2011). The three-dimensional capsule behaviours following neo-Hookean constitutive law in small channels were investigated numerically by Hu, Salsac & Barthés-Biesel (Reference Hu, Salsac and Barthés-Biesel2012). The study revealed that the spherical capsule is more deformed in a circular cross-section channel than in a square one, even under the same size ratio and flow rate (Hu et al. Reference Hu, Salsac and Barthés-Biesel2012). Those numerical analyses were performed in the Stokes regime. Although these attempts have revealed velocity-dependent transitions in RBC shapes, it is still uncertain whether stable RBC shapes in such small microchannels can be reproduced even in larger microchannels. Furthermore, much is still unknown, in particular about the relationship between the stable flow mode of RBCs, equilibrium radial position, and energy expenditure associated with membrane deformations. To clarify these issues, we performed numerical simulations of the lateral movement of RBCs under a Newtonian fluid in a circular channel with diameter $D = 50\,\mathrm {\mu }$m. Simulations are performed under a wide range of $Re$ ( $0.2 \leq Re \leq 30$) and $Ca$ ( $0.05 \leq Ca \leq 1.2$), as well as with various initial orientation angles $\varPsi _0$ and radial positions $r_0/R$.
Our numerical results demonstrate that instead of the parachute and slipper shapes observed in a microchannel with  $D = 15\,\mathrm {\mu }$m (Takeishi et al. Reference Takeishi, Yamashita, Omori, Yokoyama and Sugihara-Seiki2021), RBCs have bistable flow modes, specifically the so-called rolling and tumbling motion, that depend on the initial orientation angles $\varPsi _0$ (figure 2). Most RBCs exhibit a rolling motion (figures 2c,d), which is consistent with the results of a previous numerical study of rigid oblate ellipsoidal particles (Huang & Lu Reference Huang and Lu2017). Especially for low $Ca$ conditions, rolling RBCs notably appear rather than tumbling RBCs (figures 2c,d). Figure 2(c) explains quantitatively the shape distribution observed in experiments using a microtube of diameter 50 $\mathrm {\mu }$m (Lanotte et al. Reference Lanotte, Mauer, Mendez, Fedosov, Fromental, Claveria, Nicoul, Gompper and Abkarian2016), where the tumbling-to-rolling transition is observed at low shear rates $\dot {\gamma } < 40$ s $^{-1}$, corresponding to $Ca = 0.05$ at $Re = 0.2$ in this study if the surface shear elastic modulus is considered as $G_s = 4\,\mathrm {\mu }$N m $^{-1}$. Our numerical results further show that higher $Re$ conditions impede tumbling motion (figures 2c,d). These modes are associated with different equilibrium radial positions, where tumbling motions result in more off-centre positions than rolling ones (figure 5c). In particular, the equilibrium radial positions of tumbling RBCs can be estimated by spherical capsules (figure 10b). Such equilibrium radial positions are basically independent of initial radial positions $r_0/R$, except for the case with $r_0/R = 0$, where an RBC starts exactly on the channel centre ( $r_0/R = 0$) and remains almost on the channel axis, $O(\langle r \rangle /R) = 10^{-3}$, without exhibiting the aforementioned characteristic modes (figure 5c). The equilibrium radial coordinates become greater both with decreases in $Ca$ (i.e. stiffer cases; figure 4a) and with increases in $Re$ (figure 8a). Stiffer RBCs tend to reach their equilibrium radial positions quickly (figure 3b), which is qualitatively consistent with a previous numerical study of a spherical hyperelastic particle (Alghalibi et al. Reference Alghalibi, Rosti and Brandt2019). On the other hand, softer RBCs tend to exhibit axial migration, i.e. inertial migration is impeded by finite deformability (figure 4a); this is qualitatively consistent with previous numerical analyses of spherical capsules in a rectangular channel under Newtonian fluid (Schaaf & Stark Reference Schaaf and Stark2017) and also in polymeric fluid modelled using an Oldroyd-B constitutive equation (Raffiee et al. Reference Raffiee, Dabiri and Ardekani2017). By simulating multi-spherical-capsule interactions at finite channel $Re$ ( $=3$–417) in a planar Poiseuille flow considering the SK law, Krüger, Kaoui & Harting (Reference Krüger, Kaoui and Harting2014) also concluded that the Segré–Silberberg effect (Segré & Silberberg Reference Segré and Silberberg1962) is suppressed upon an increase of the particle deformability. Considering the effects of initial orientations (figures 2 and 3b) and initial radial positions (figure 5c) on equilibrium radial positions, the initial shear stress acting on the cell membrane induces cell deformation and alteration of orientation angles (figures 2a,b). The change in cell orientation is affected primarily by the initial orientation angle (figure 5c), and subsequently, the cell achieves a stable tumbling or rolling motion during radial migration (figure 3b), with migration towards the equilibrium radial position occurring much later (figure 3b). Comparison with experimental and numerical results of stable RBC flow mode is our future study. At the moment, inertial focusing of RBCs in a square capillary tube of width 50 $\mathrm {\mu }$m has been well investigated experimentally (Tanaka & Sugihara-Seki Reference Tanaka and Sugihara-Seki2022). In the future study, based on this technique, we will confirm the aforementioned stable flow mode and mode-depending equilibrium radial position.
To clarify whether the equilibrium radial position minimises the energy expenditure associated with membrane deformations  $\langle \delta W_{mem}^\ast \rangle$, the powers are calculated in (2.13). Overall, off-centre RBCs demonstrate a large velocity gradient (or shear stress), resulting in large energy dissipation as shown in figures 4(d), 6(d) and 8(d). The order of magnitude of powers in axially migrated RBCs is relatively small, $O(\langle \delta W_{mem} \rangle ) \sim 10^{-4}$, while the powers of off-centre RBCs increase by two orders of magnitude, $O(\langle \delta W_{mem} \rangle ) \sim 10^{-2}$ (figures 6(d), 9(c) and 9(d)). Although the knowledge that large off-centre deformable particles associated with large energy expenditure can be derived by rigid spherical particles, this tendency is counter to that obtained in a small microchannel with $D = 15\,\mathrm {\mu }$m and almost no inertia ( $Re = 0.2$) (Takeishi et al. Reference Takeishi, Yamashita, Omori, Yokoyama and Sugihara-Seiki2021), where powers $\langle \delta W_{mem}^\ast \rangle$ instead decrease as the off-centre radial position increases. The tendency obtained with $\lambda = 5$ remains the same even at low $\lambda$ ( $= 1$; figures 9(c,d)). The results suggest that the aforementioned bistable flow modes in a large microchannel ( $D = 50\,\mathrm {\mu }$m) and their equilibrium radial positions cannot be determined simply by the energy expenditure $\langle \delta W_{mem}^\ast \rangle$. The results show further that low $\lambda$ ( $= 1$) conditions impede inertial migration not only for biconcave capsules (non-spherical capsules) but also for spherical capsules (figure 10b). Despite these insights, we are unsure what factors cause RBCs to adopt a stable shape. Considering the results observed with powers $\langle \delta W_{{mem}}^\ast \rangle$ shown in figures 9(c) and 9(d), the stable orientations and equilibrium radial positions of RBCs cannot be explained by the minimum energy dissipation. The powers $\langle \delta W_{{mem}}^\ast \rangle$, however, rely on stable flow modes, equilibrium radial position of RBC centroids, and viscosity ratios $\lambda$.
Considering that the equilibrium radial positions of rolling RBCs subject to high  $Ca$ ( $= 1.2$) increase with $Re \geq 15$ (figure 8a), a certain level of inertial $Re$ is required in inertial migration of RBCs. Since the major diameter of rolling RBCs increases by almost 80 % under $15 \leq Re \leq 30$ (figure 8b), the cell state after inertial migration should be taken into consideration for applications such as cell-sorting techniques. If the orientation angle of individual RBCs flowing in channels can be manipulated so that the majority of RBCs assume a stable tumbling state, e.g. by mean of an optical cell rotator (Kreysing et al. Reference Kreysing, Ott, Schmidberger, Otto, Schürmann, Martín-Badosa, Whyte and Guck2014), then these tumbling RBCs will accumulate near the wall even under relatively low $Re$ with smaller deformations (figures 6a,b). Given that the transition can be controlled by adjusting the cell orientation as well as background flow strength, the results obtained here can be utilised for label-free cell alignment/sorting/separation techniques to diagnose precisely patients with haematologic disorders, or for the analysis of anticancer drug efficacy in cancer patients. Our numerical results form a fundamental basis for further studies on cellular flow mechanics.
5. Conclusion
We investigate numerically the lateral movement of RBCs with major diameter 8  $\mathrm {\mu }$m under a Newtonian fluid in a circular channel of diameter 50 $\mathrm {\mu }$m. Simulations are performed for a wide range of $Re$ and $Ca$, as well as various initial orientation angles and radial positions. The RBCs are modelled as a biconcave capsule, whose membrane follows the SK law. The problem is solved by the LBM for the inner and outer fluids, and the FEM is used to follow the deformation of the RBC membrane. The numerical results show that RBCs have bistable flow modes, the so-called rolling motion and tumbling motion, which depend on the initial cell orientations and which are established soon after flow onset. The vast majority of RBCs exhibit the rolling motion. Furthermore, higher $Re$ conditions impede tumbling motion. These modes are associated with different equilibrium radial positions, with tumbling RBCs flowing much further away from the channel axis than rolling ones. RBCs subject to high $Ca$ (i.e. large deformability) tend to exhibit axial migration even for finite $Re$, but inertial migrations are enhanced over a certain value of $Re$. The inertial migration of RBCs involves the alternation of orientation angles, which are affected primarily by the initial orientation angles. The RBCs then adopt the aforementioned bistable modes during the migration, followed by further migration to the equilibrium radial position at much later time periods. The stable orientations and equilibrium radial positions of RBC centroids do not minimise the energy expenditure associated with membrane deformations. The energy expenditure, however, relies on stable flow modes, the equilibrium radial positions of RBCs, and viscosity ratios.
Supplementary movies
Supplementary movies are available at https://doi.org/10.1017/jfm.2022.936.
Funding
This research was supported by JSPS KAKENHI grant numbers JP20H04504 and JP20H02072, and by the Keihanshin Consortium for Fostering the Next Generation of Global Leaders in Research (K-CONNEX), established by the Human Resource Development Program for Science and Technology. N.T. is grateful for the financial support of UCL-Osaka Partner Funds.
Declaration of interests
The authors report no conflict of interest.
Appendix A. Numerical set-up
We have tested the channel length  $L$, and investigated its effect on the radial positions of RBC centroids. Although previous numerical studies of deformable particles have set a variety of computational lengths depending on $Re$ (e.g. Alghalibi et al. Reference Alghalibi, Rosti and Brandt2019; Kilimnik et al. Reference Kilimnik, Mao and Alexeev2011; Raffiee et al. Reference Raffiee, Dabiri and Ardekani2017; Schaaf & Stark Reference Schaaf and Stark2017), we tested the trajectory of the radial positions of RBC centroids for different channel lengths $L$ (
$L$ ( $=10a_0$, 15 $a_0$ and 20 $a_0$). The results of the time history of the radial position of RBC centroid $r$ are compared between these different channel lengths in figure 11, where the centroid position $r$ is normalised by the channel radius $R$. The results are consistent among all cases, hence the results presented in this study are all obtained with the channel length $L = 20a$.
Time history of the radial position  $r/R$ of an RBC centroid with $D = 50\,\mathrm {\mu }$m for different channel lengths $L$ (
$L$ ( $=10a_0$, 15 $a_0$ and 20 $a_0$). The results are obtained with $Re = 10$, $Ca = 0.05$, ${\rm \pi} /4 \leq \varPsi _0 \leq {\rm \pi}/2$, and $r_0/R = 0.8$.

We have also confirmed the axial migration for a relatively small channel with  $D = 20\,\mathrm {\mu }$m (i.e. $d/D = 0.2$), where the channel length remains the same as $L = 20a_0$. Figure 12 shows the time history of $r/R$ for different $Ca$ ( $=0.05$ and 1.2). Although a highly deformable RBC (i.e. large $Ca = 1.2$) takes much longer to migrate towards the channel centre than a stiffer RBC (i.e. small $Ca = 0.05$), both RBCs finally complete the axial migration. This result also indicates that the axial migration of RBCs will occur even in high $Ca$ ( $= 1.2$) at least for $d/D \leq 0.2$, instead of off-centre slipper shapes of RBCs at $d/D \approx 0.53$ ( $d = 8\,\mathrm {\mu }$m and $D = 15\,\mathrm {\mu }$m; Takeishi et al. Reference Takeishi, Yamashita, Omori, Yokoyama and Sugihara-Seiki2021).
Time history of the radial position  $r/R$ of an RBC centroid with $D= 20\,\mathrm {\mu }$m for different $Ca$ ( $=0.05$ and 1.2). The results are obtained with $Re = 0.2$, ${\rm \pi} /4 \leq \varPsi _0 \leq {\rm \pi}/2$, and $r_0/R = 0.55$. The RBC images represent snapshots of cross-sectional area of RBCs subject to each $Ca$ at specific times: $\dot {\gamma }_{m}t = 0$ (initial state), 500 and 1500, respectively.

Appendix B. Membrane mechanics
Since the RBC membrane is very thin relative to its major diameter, we can consider the deformation of its median surface in the absence of bending resistance. Furthermore, the stress can be integrated across the thickness and be replaced by tensions, i.e. forces per unit length. Consider a material point on the surface of a two-dimensional membrane. Let  ${\boldsymbol {x}}$ be the position of the material point in a deformed state. In fixed Cartesian coordinates, it is defined as
 \begin{equation} {\boldsymbol{x}} = x^i {\boldsymbol{e}}_i, \end{equation}
where  ${\boldsymbol {e}}_i$ ( $i=1,2,3$) is the Cartesian basis. We also introduce local curvilinear coordinates on the membrane $(\xi ^1, \xi ^2, \xi ^3)$, and the local covariant bases are defined by
 \begin{gather} {\boldsymbol{G}}_1 = \frac{\partial {\boldsymbol{X}}}{\partial \xi^1},\quad {\boldsymbol{G}}_2 = \frac{\partial {\boldsymbol{X}}}{\partial \xi^1},\quad {\boldsymbol{G}}_3 = {\boldsymbol{n}}, \end{gather}
 \begin{gather}{\boldsymbol{g}}_1 = \frac{\partial {\boldsymbol{x}}}{\partial \xi^1},\quad {\boldsymbol{g}}_2 = \frac{\partial {\boldsymbol{x}}}{\partial \xi^1},\quad {\boldsymbol{g}}_3 = {\boldsymbol{n}}, \end{gather}
where  ${\boldsymbol {X}}$ and ${\boldsymbol {x}}$ are material points on the membrane in the reference and deformed states, respectively, and ${\boldsymbol {n}}$ is the unit normal outward vector, which is calculated as
 \begin{equation} {\boldsymbol{g}}_3= \frac{{\boldsymbol{g}}_1 \times {\boldsymbol{g}}_2}{|{\boldsymbol{g}}_1 \times {\boldsymbol{g}}_2|} = {\boldsymbol{g}}^3= \frac{{\boldsymbol{g}}^1 \times {\boldsymbol{g}}^2}{|{\boldsymbol{g}}^1 \times {\boldsymbol{g}}^2|} = {\boldsymbol{n}}. \end{equation}
The associated contravariant bases are defined as  ${\boldsymbol {g}}^i \boldsymbol {\cdot } {\boldsymbol {g}}_j = \delta _j^i$, where $\delta$ is the Kronecker delta. The covariant and contravariant metric tensors can be written as
 \begin{equation} g_{ij} = g_{ji} = {\boldsymbol{g}}_i \boldsymbol{\cdot} {\boldsymbol{g}}_j, \quad g^{ij} = g^{ji} = {\boldsymbol{g}}^i \boldsymbol{\cdot} {\boldsymbol{g}}^j, \end{equation}
where  $g_{i3} = \delta _{i3}$ and $g^{i3} = \delta ^{i3}$. The local, in-plane deformation of the membrane can be measured by the Green–Lagrange strain tensor ${\boldsymbol {E}}$ given by
 \begin{equation} {\boldsymbol{E}} = \tfrac{1}{2} \left( {\boldsymbol{g}}_{\alpha\beta} - {\boldsymbol{G}}_{\alpha\beta} \right)\quad (\alpha, \beta \in \{1, 2\}). \end{equation}
The two invariants of the strain tensor are given by
 \begin{equation} I_1 = g_{\alpha\beta}G^{\alpha\beta} - 2, \quad I_2 = |g_{\alpha\beta}|\,|G^{\alpha\beta}| - 1, \end{equation}
where  $|g_{\alpha \beta }|\ (= g_{11}g_{22} - g_{12}g_{21})$ is the determinant of the metric tensor (similarly for the reference state, $|G_{\alpha \beta }|$). The contravariant expression of the Cauchy tensor ${\boldsymbol{\mathsf{T}}}$ is then given by
 \begin{equation} {\boldsymbol{\mathsf{T}}} = \frac{2}{J_s}\,\frac{\partial w}{\partial I_1}\,G^{\alpha\beta} + 2 J_s\, \frac{\partial w}{\partial I_2}\,g^{\alpha\beta}, \end{equation}
where  $w$ is the surface strain energy function, and $J_s$ is the Jacobian, which expresses the area dilation ratio. In this study, the SK law (2.1) is considered for $w$.
$w$.


 Open access