


1. Introduction
When we want to study sound change, we are always too late: by the time a successful change can be identified, it has—by definition—already spread beyond the incipient stage, which makes it difficult to study the implementation of such a change (see, e.g., Pinget, Reference Pinget2015). However, if a change is regionally stratified, then this synchronic variation can be used as a proxy for the diachronic change, yielding a specific case of the apparent-time method to the study of sound change. The present paper uses this approach to investigate an ongoing vowel shift in Dutch that has been covered synchronically (Adank et al., Reference Adank, van Hout and Smits2004, Reference Adank, van Hout and Van de Velde2007) but has not yet been investigated from the perspective of diachronic change. The aim of the paper is to make two points. First, the present paper will show that recent innovations in statistical methods make it possible to analyze challenging phonetic data. Second, these approaches make it possible not only to characterize the changes in Dutch that are currently ongoing, but also to retrospectively say something about the nature of these sound changes, specifically whether they were originally Neogrammarian, lexically diffuse, or something else.
Dutch is currently undergoing multiple interrelated changes in its vowel system. The vowels /eː,øː,oː/ are changing into upgliding diphthongs [ei,øy,ou] (change 1; van der Harst, Reference van der Harst2011; van der Harst et al., Reference van der Harst, Van de Velde and van Hout2014; Van de Velde, Reference Van de Velde1996; Zwaardemaker & Ejikman, Reference Zwaardemaker and Eijkman1924), the vowels /ɛi,œy,ɔu/ are lowering towards [ai,ɒy,ɑu] (change 2; Blankestein, Reference Blankestein1994; Gerritsen & Jansen, Reference Gerritsen and Jansen1980; Gussenhoven & Broeders, Reference Gussenhoven and Broeders1976; van Heuven et al., Reference van Heuven, Van Bezooijen, Edelman and Filppula2005; Jacobi, Reference Jacobi2009; Mees & Collins, Reference Mees and Collins1983; Stroop, Reference Stroop1992, Reference Stroop1998; Van de Velde, Reference Van de Velde1996; Voortman, Reference Voortman1994), and both of these sets of vowels are realized as monophthongs when preceding coda /l/ (change 3; Berns & Jacobs Reference Berns and Jacobs2012; Botma & Jacobs, Reference Botma, Sebregts and Smakman2012; Voeten, Reference Voeten2015), while coda /l/ itself is undergoing a process of vocalization and is causing retraction of the preceding vowel (change 4; Berns & Jacobs, Reference Berns and Jacobs2012, van Reenen & Jongkind, Reference van Reenen and Jongkind2000). These diachronic changes manifest synchronically as regional variation. Change 1 shows a clear split between the Dutch spoken in The Netherlands versus the Dutch spoken in Flanders (Adank et al., Reference Adank, van Hout and Smits2004; Van de Velde, Reference Van de Velde1996), and change 2 is restricted to the Randstad part of The Netherlands (Jacobi, Reference Jacobi2009; Stroop, Reference Stroop1998). Preliminary research on change 3 shows that it is split between The Netherlands and Flanders in the same way as change 1 (Voeten, Reference Voeten2021). The sociogeographical status of change 4 is well-known, in that the change is restricted to The Netherlands, where coda /l/ is velarized. In Belgian Standard Dutch, coda /l/ is not velarized and change 4 has not taken place. However, there are a few Flemish dialects (mostly in West-Flanders and the west of East-Flanders; De Wulf et al., Reference Wulf, Chris and Taeldeman2005: map 176) that have developed coda-/l/ vocalization independently or have retained an etymological vocoid (in words like “geel”, which in Proto-Germanic had a second syllable following the /l/, as in the English cognate “yellow”; De Wulf et al., Reference Wulf, Chris and Taeldeman2005: map 175).
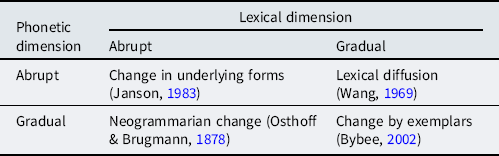
While the fact that these sound changes are ongoing or have perhaps already completed in the language is well-known, how these sound changes are implemented remains to be established. The present paper makes use of the same corpus as Adank et al. (Reference Adank, van Hout and Smits2004) and Adank et al. (Reference Adank, van Hout and Van de Velde2007) to answer this question. The mode of implementation of a historical sound change is generally classified along two axes: phonetic abruptness versus graduality on the one hand, and lexical abruptness versus graduality on the other (Bermúdez-Otero, Reference Bermúdez-Otero and de Lacy2007). Consequently, four possible types of change have been attested in the literature, which vary along phonetic and lexical abruptness vs. graduality. These are changes in underlying forms, change via classic lexical diffusion, Neogrammarian change, and change by exemplars within an Exemplar-Theory framework. Table 1 provides an overview of how these modes of implementation map to the phonetic and lexical dimensions. Per Bermúdez-Otero (Reference Bermúdez-Otero and de Lacy2007), change via lexical diffusion can alternatively be understood as a change in phonological rules, while Neogrammarian change can be seen as a change in phonetic implementation. Change by exemplars cannot be represented in the classic modular feedforward model, but instead relies on the gradual drift of the frequencies of the different realizations, such that subtle changes in the distributional properties (e.g., a gradual skew towards more diphthongal realizations) of the many individual word tokens ultimately make their way into the “exemplar”, or prototypical realization based on the aggregate of these individual tokens held by an individual. It is not yet known how the sound changes that are currently ongoing in Dutch can be classified in terms of phonetic and lexical abruptness and graduality. However, this can be measured from the synchronic data available in the corpus. Phonetic graduality versus abruptness can be inferred by looking at the differences between the regions that have been included in the corpus. If the regional differences in the realizations of the same vowel or vowel-/l/ sequence show a smooth trend, then a change is phonetically gradual. If there are sharp categorical differences between the regions, then the change is phonetically abrupt in the synchronic grammar (although synchronic data cannot rule out the possibility that the change was originally of a gradual nature but has already completed). Similarly, if realizations of the same vowel or vowel-/l/ sequence are very different between the words containing them, there is evidence for lexical graduality. This makes it possible to operationalize the main research question: what types of changes are changes 1–4?
Modes of implementation of historical sound changes, after Bermúdez-Otero (Reference Bermúdez-Otero and de Lacy2007)
The phonetic data on the basis of which this question can be answered present methodological challenges. While changes 1 and 2 can be investigated with relative ease, changes 3 and 4 are more challenging to operationalize. Change 3 and 4 involve vowels followed by coda /l/. This is a challenging sequence to segment for a phonetician, because the transition between these two segments is phonetically highly gradient, and this problem gets worse if the coda /l/ is strongly vocalized (which is one of the sound changes to be investigated; van Reenen & Jongkind, Reference van Reenen and Jongkind2000). The acoustic-phonetic transition from a vowel to a coda /l/ is smooth and continuous rather than discrete, and hence these segments cannot be segmented reliably. One might even argue that in cases of such smooth transitions, the concept of a phonetic segmentation does not even make sense in the first place. It may not be surprising, then, that sociolinguistic studies on Dutch normally exclude vowels followed by liquids and glides, because a reliable way to analyze such vowels has up to now been lacking (see, for example, Van de Velde, Reference Van de Velde1996, among many others). However, for the present paper, ignoring coda /l/ is not an option, as it is an integral part of the research question.
The present paper demonstrates a solution to this long-standing problem of analyzing vowel-approximant sequences by making use of generalized additive mixed models, henceforth “GAMMs”. These models make it possible dispense with manual segmentation all together and to instead analyze the entire time course of the vowel plus coda /l/ as-is. This makes it possible to compare hard-to-segment [Vɫ] sequences to unproblematic sequences of the same vowels followed by a nonapproximant consonant, dispensing with manual segmentation of the former but not the latter. The present paper’s use of GAMMs to analyze (hard-to-segment) acoustic data logically adds to previous work using these models in sociophonetics, most saliently Wieling et al. (Reference Wieling2016). Their study concerned regional variation in the articulation of dialect words in two villages in The Netherlands, namely Ubbergen and Ter Apel, which geographically are about 150 km. apart and belong to different dialect areas within The Netherlands (Central Dutch and Low Saxon, respectively). Because the articulographic (specifically: EMA) data they collected is highly nonlinear, just as the formant trajectories in the present paper, Wieling et al. (Reference Wieling2016) used GAMMs in their statistical analyses. The results in Section 3 will show that a similar GAMM-based approach to formant measurements provides new perspectives on the measurement of the four different types of sound change, for which the four changes currently ongoing in Dutch are an excellent example. The results also highlight the advantages and limitations of a synchronic approach towards the analysis of diachronic sound change.
2. Method
2.1 Data and measurements
The regional variation in the ongoing sound changes in Dutch is investigated using a large dataset called the “teacher corpus” (Adank, Reference Adank2003; van Hout et al., Reference van Hout, Huls and Weltens1999), a corpus of 5,407 tokens of monosyllabic words sampled from four representative regions in The Netherlands and four in Flanders. The teacher corpus is particularly well-suited to investigating the regional variation in the realizations of the tense mid vowels and diphthongs, for at least three reasons. The first reason is that it is phonologically comprehensive, in that it contains all the vowels of interest for the research into the particular sound changes, and it specifically distinguishes between coda-/l/ and non-coda-/l/ contexts within these vowels. The second reason is that it is excellently regionally stratified: the corpus consists of four regions in The Netherlands and four regions in Flanders, logically ranging from more central (prestigious) to more peripheral (nonprestigious). Lastly, the corpus is well-suited for studying ongoing change in particular because it makes an effort to disentangle regional variation in implementation from dialectal variation. The ingenious approach is due to Van de Velde and van Hout (Reference Van de Velde and van Hout2003): the data in the corpus were collected from teachers of Dutch, who serve as role models to their students. This makes them representative for their region’s interpretation of the standard language (see Delarue, Reference Delarue, Kristiansen and Grondelaers2013; Grondelaers & van Hout, Reference Grondelaers and van Hout2012; Van Istendael, Reference Van Istendael2008). For more details on the way the data were collected and an in-depth treatment of the sociolinguistic issues involved, the reader is referred to Van de Velde and van Hout (Reference Van de Velde and van Hout2003) and Patti Adank’s (Reference Adank2003) PhD dissertation. Part of the data presented in this paper were also analyzed in Sander van der Harst’s (Reference van der Harst2011) PhD dissertation, albeit with different aims and using different methods (namely, cubic regression on five equidistant timepoints ranging from 25% to 75% realization on explicitly segmented non-/l/ words only).
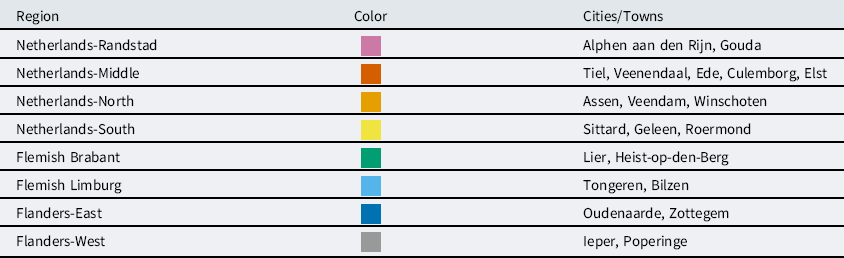
The corpus consists of samples of Dutch taken from four different regions in both The Netherlands and Flanders. For both countries, one “central” region was sampled (NL: Netherlands-Randstad, henceforth “NR”; FL: Flemish-Brabant, “FB”), one intermediate region (NL: the south of Gelderland, henceforth “NM” for “Netherlands-Middle”; FL: East-Flanders, “FE”), and two peripheral regions (NL: Groningen and Dutch Limburg, henceforth “NN” and “NS” for “Netherlands-North” and “Netherlands-South”; FL: Flemish Limburg and West-Flanders, respectively “FL” and “FW”); for details, see Adank (Reference Adank2003). A map of the regions is shown in Map 1, which was created using the DynaSAND website (Barbiers et al., Reference Barbiers2006). The corpus is further subcategorized for gender and age, and then has five speakers per cell, yielding a total of eight (regions) × two (genders) × two (age groups: young versus old) × five (speakers per cell) = 160 speakers in total. For the age groups, an age between twenty-two and forty years was considered “young”, whereas an age between forty and sixty-five was considered “old”.
Overview of the different cities and towns from which data were sampled. Dots indicate major cities and towns according to Barbiers et al. (Reference Barbiers2006). Open circles indicate the cities and towns which were sampled for the teacher-corpus data. The overlaid colored circles indicate the corresponding regions, which are summarized in the following table (based on van der Harst Reference van der Harst2011:55).

The data that are relevant to the investigation in this paper are those containing the vowels /e:,ø:,o:,ɛi,œy,ɔu/, followed either by a nonapproximant consonant or by coda /l/. This yields the words “fee” /feː/ (“fairy”), “beuk” /bøːk/ (“beech”), “boog” /boːɣ/ (“bow”/“arch”), “boten” /boː.tən/ (“boats”), “do” /doː/ (“do”, musical scale), “pook” /poːk/ (“poker”), “dij” /dɛi/ (“thigh”), “meid” /mɛid/ (“girl”), “duin” /dœyn/ (“dune”), “luis” /lœyz/ (“louse”), “tuin” /tœyn/ (“garden”), and “saus” /sɔus/ (“sauce”) in the non-/l/ condition and the words “keel” /keːl/ (“throat”), “veel” /veːl/ (“much”/“many”), “beul” /bøːl/ (“executioner”), “geul” /ɣøːl/ (“trench”), “school” /sxoːl/ (ibid.), “zool” /zoːl/ (“sole”, of a shoe), “geil” /ɣɛil/ (“horny”), “heil” /ɦɛil/ (“salvation”), “ruil” /rœyl/ (“trade”), and “uil” /œyl/ (“owl”) in the /l/ condition.
Using Praat (Boersma and Weenink, Reference Boersma and Weenink2016), each of these words was sampled on F1 and F2 in 10-ms steps, using the same formant settings as in van der Harst (Reference van der Harst2011). Sampling started at the onset of the vowel (which was segmented manually) and continued to the 10-ms point (rounded down) at either the end of the vowel (for the non-/l/ words) or the end of the vowel+/l/ (for the coda-/l/ words). This resulted in varying numbersFootnote 1 of 10-ms point samples, depending on the duration of the vowel, per token.
The different token durations were normalized by converting the sample timestamps to percentages of vowel realization, such that each vowel token’s duration ranged from 0% to 100% with a duration-dependent number of samples in between. Formant-measurement errors were excluded from the data by removing all samples falling outside the 100–1,000-Hz band for F1 (760 of 301,688 samples excluded, or 0.25%), and the 500–3,000-Hz band for F2 (436 samples excluded, or 0.14%).Footnote 2 No a- priori speaker normalization was applied, because this is not necessary: the systematic anatomical differences between speakers are already taken into account by the random effects in the statistical analysis, which is described next.
2.2 Data analysis
The resulting F1 and F2 trajectories were modeled by running separate GAMMs for each 〈formant,vowel〉 pair using function bam from R (R Core Team 2020) package mgcv (Wood, Reference Wood2017). Models were built up on the principle of parsimony (Bates et al., Reference Bates2015), based on visual inspection of the individual tokens and directly incorporating terms hypothesized to contribute to differences between them, until no remaining structure was visible in the by-token residuals.Footnote 3 This led to the inclusion of fixed effects for the predictors “Gender” (coded as male or female, sum-coded such that female = 1 and male = −1), “Region” (the eight regions in the corpus, sum-coded such that Netherlands-Randstad = −1 and the others are 1), “Following segment” (treatment-coded as /l/ or non-/l/, such that /l/ = 1 and non-/l/ = 0), and “Region × Following segment”. In addition, random effects by following segment were added by participants. Smooths, defined as thin-plate regression splines with thirty basis functions,Footnote 4 were added for the predictor “Time” by following segment; these terms model the nonlinear evolution of the dependent variable across the different 10-ms samples, for the non-/l/ and /l/ contexts separately. Finally, by-participants random smooths for “Time” by following segment were added to the model, configured in the same way as the regular smooths just described; penalties on the null space and on the first basis function of the thin-plate regression spline were added appropriately. Equation 1 gives the resulting formula in R code; with the exception of time, which is a continuous variable representing the normalized sample index, all predictors named are factors. Models were fitted to scaled-t errors, including an order-1 autoregressive process with ρ = .5. The smoothness-selection criterion was the REML criterion. The F1 model for the /ɔu/ vowel was fitted without effects for following segment, as this vowel was only present in one word: “saus”. No F2 model was fitted for this vowel, as there are no coda-/l/ words available for this vowel, and the only change involving F2 is change 4, which only concerns coda /l/.
 $$\eqalign{{\rm{value}} & \sim {\rm{gender}} + {\rm{region}}*{\rm{following}} \,+ \cr& {\rm{s}}\left( {{\rm{time}},\, {\rm{by}} = {\rm{region}}\_{\rm{following}},\, {\rm{k}} = {\rm{3}}0, \,{\rm{bs}} = {\hbox'}{\rm{tp}}\hbox'} \right)\,{\rm{ }} + \cr& {\rm{s}}\left( {{\rm{participant}}, \,{\rm{bs}} = {\rm{\hbox're}}\hbox', \,{\rm{by}} = {\rm{following}}} \right) \,+ \cr& {{\rm{s}}\left( {{\rm{time}}, \,{\rm{participant}}, \,{\rm{k}} = {\rm{3}}0, \,{\rm{bs}} = \hbox'{\rm{fs}}\hbox', \,{\rm{xt}} = \hbox'{\rm{tp}}\hbox', \,{\rm{m}} = {\rm{1}},}\right.} \cr&{{\rm{by}} = {\rm{following}}} )}$$
Regional variation due to the four ongoing sound changes was established by comparing the fitted trajectories between the Netherlands-Randstad region with those in the other regions. The Randstad is chosen as the reference region because this is the region where all four changes are considered to be the most advanced (Stroop, Reference Stroop1998; van der Harst, Reference van der Harst2011). For changes 1, 2, and 4, regional diffusion was assessed by predicting the fitted models’ linear-predictor matrices onto a time grid of 101 points, corresponding to 0–100% realization. With eight regions, two following-consonant types, and two genders, this resulted in 101 × 8 × 2 × 2 = 3,232 linear predictions for each model. These were averaged over the two genders, and the linear predictions for the Randstad region were subtracted from them. The resulting linear differences were finally multiplied by the model’s linear coefficients to obtain difference curves. Accompanying 95% Bayesian credible intervals were calculated using the approach in Wood (Reference Wood2017:293–294). Differences along a formant’s time course are considered significant if their credible interval excludes zero.
Investigating the regional diffusion of change 3, the blocking of diphthongization before coda /l/, requires comparing the difference in diphthongization between vowels before non-/l/ and before coda /l/. In order to characterize the difference between these different types of trajectories, change 3 looks at the difference in formant ranges. Starting from the predicted trajectories provided by the GAMMs, for each vowel and region a trough was found by taking the highest F1 (corresponding to the lowest position of the tongue) within the first 50% realization, and a peak was found by taking the lowest F1 (corresponding to the highest position of the tongue) within the final 50% realization. The range of diphthongization is defined as the range between the trough and the peak, such that a negative range indicates upgliding diphthongization, whereas a range of zero or a small positive range indicates absence of this upglide (see Equation 2). Of interest is the difference in trough-to-peak ranges between the non-/l/ condition and the /l/ condition (henceforth “ΔTTP”; see Equation 3). This difference is defined such that negative values indicate that there is more diphthongization in the non-/l/ condition than in the /l/ condition, whereas positive values indicate the reverse. Regional differences were established by subtracting the ΔTTP for the Randstad from that for the other regions (“ΔNR”; see Equation 4). Credible intervals for the ΔTTP and ΔNR measures were computed by performing the same steps as for the ΔTTP and ΔNR themselves on the corresponding linear-predictor matrices, and then again following the procedure outlined in Wood (Reference Wood2017:293–294).
 $${\rm{TTP}} = {\rm{F}}{{\rm{1}}_{{\rm{peak}}}} - {\rm{F}}{{\rm{1}}_{{\rm{trough}}}}$$
 $$\Delta {\rm{TTP}} = {\rm{TT}}{{\rm{P}}_{{\rm{non}} - /}}_{{\rm{l}}/} - {\rm{TT}}{{\rm{P}}_/}_{{\rm{l}}/}$$
 $$\Delta {\rm{NR}} = {\rm{ }}\Delta {\rm{TT}}{{\rm{P}}_{{\rm{region}}}} - \Delta {\rm{TT}}{{\rm{P}}_{{\rm{Netherlands{\hbox{-}}Randstad}}}}$$
The degree of lexical diffusion of the four sound changes is quantified by the between-words variability in each result to be discussed. To calculate a statistic representing this lexical variability, the same GAMMs (without effects for following segment and with the number of basis functions reduced to ten for computational efficiency)Footnote 5 were run for each word separately. For each peak value along the difference trajectory (changes 1, 2, 4) and ΔNR (change 3), the sum of squared differences of this result from the by-words individual estimates was computed and divided by the original result’s variance (Equation 5). The resulting ratio is a chi-square random variable with n − 1 degrees of freedom, where n is the number of words.
 $${\chi ^2_{n - 1} ={{\sum^n_{i = 1}}{{({x_{{\rm{full}}\, {\rm{model}}}} - {x_{{\rm{by {\hbox {-} words}}\ {\rm{model}}}\ i})}^2}} \over {{\rm{Var}}({x_{{\rm{full}}\, {\rm{model}}}})}}$$
Section 3 discusses the results of the analyses. The data and R code with which these have been produced are available at https://figshare.com/s/48e0afc5dc7b10d24726 as the files data.csv and analysis.R, respectively.
3. Results
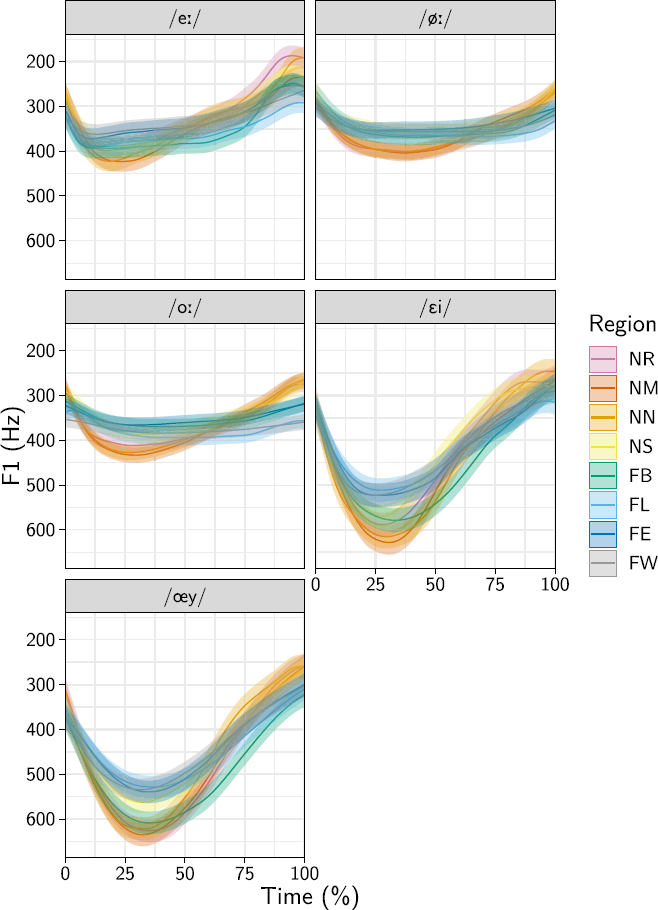
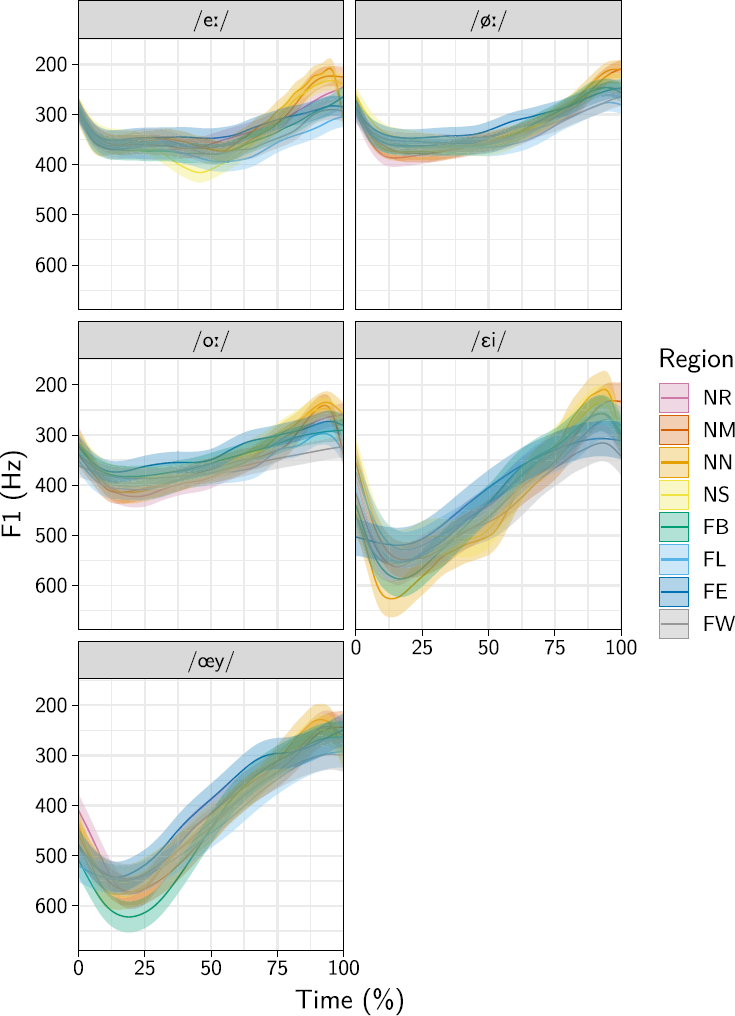
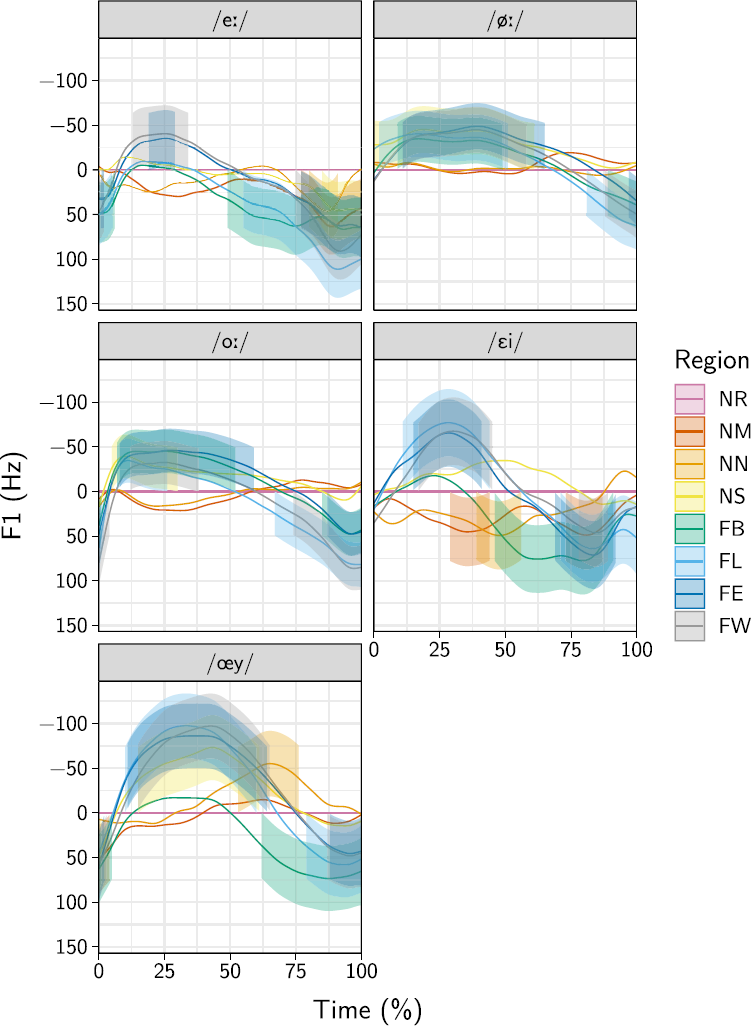
The results for the four sound changes are discussed in order, based on the relevant statistics extracted from the fitted GAMMs. One of the models—the F1 model for the /ɔu/ vowel—did not converge successfully. This vowel was therefore excluded from the results. For reference, Figures 1–3 provide a general overview of the data for the F1 followed by a nonapproximant consonant, the F1 followed by coda /l/, and the F2 followed by coda /l/, respectively. These figures were obtained by predicting from the model in the same way as described in Section 2.2, without subsequently calculating any differences between conditions. As such, they are equivalent to smoothed versions of the raw data, for the average participant and the average word. In Figure 1 the full vowel trajectories are shown for the vowels followed by a nonapproximant consonant. This consonant itself is not included, but the vowels’ trajectories to and from the consonants are clearly visible. This underscores the observations by van der Harst (Reference van der Harst2011) on the same data that the influence of coarticulation is minimal no earlier than 25% realization and no later than 75% realization. Figures 2 and 3 show the vowels followed by coda /l/, which is included in the depicted trajectories, as it could not be reliably segmented. Thus, in these plots, the ends of the depicted trajectories coincide with the ends of the words.
Overview of the vowel trajectories as smoothed curves, for the F1 data (closed/open dimension) when followed by a nonapproximant consonant. The following consonant itself is not included. The ribbons around the curves indicate the 95% CI.
Overview of the vowel trajectories as smoothed curves, for the F1 data (closed/open dimension) when followed by coda /l/. The curves include the coda /l/ in its entirety. The ribbons around the curves indicate the 95% CI.
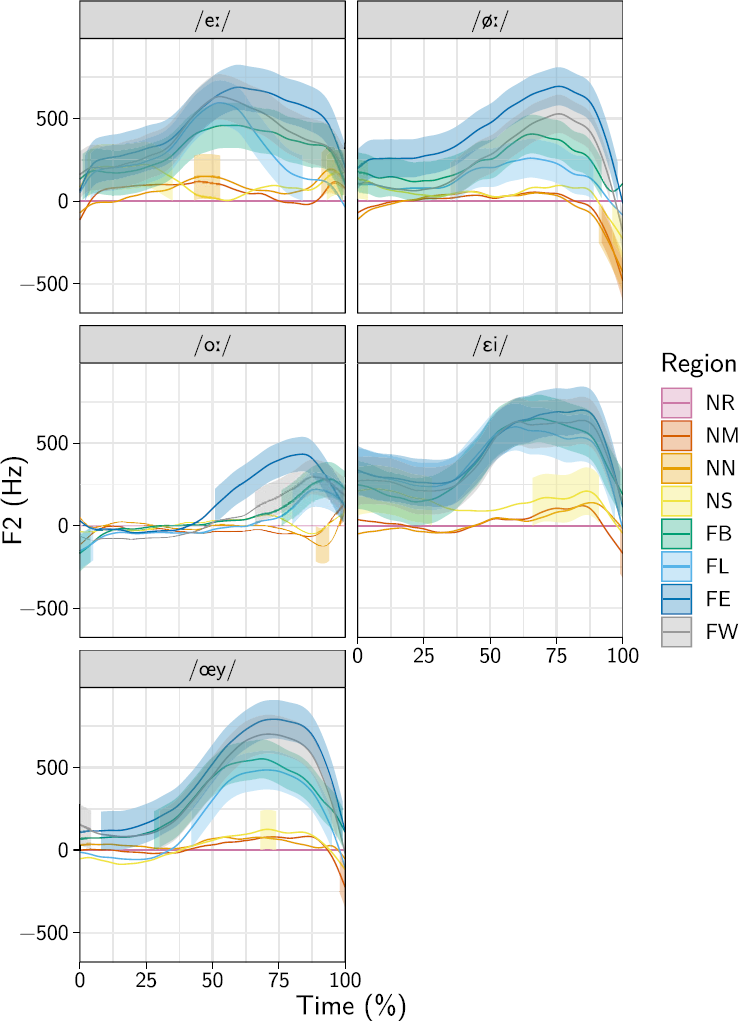
Overview of the vowel trajectories as smoothed curves, for the F2 data (front/back dimension) when followed by coda /l/. The curves include the coda /l/ in its entirety. The ribbons around the curves indicate the 95% CI.

3.1 Change (1): Diphthongization of /eː,øː,oː/
Figure 4 shows the difference smooths of the five vowels when not followed by /l/, compared to the Netherlands-Randstad region. As the focus for change 1 is the diphthongization of /e:,ø:,o:/, the dependent variable in this plot is the F1. In this figure as well as in Figure 5 significance of the differences is indicated by the presence of a ribbon around the smooth; the width of the ribbon spans precisely the 95% CI. The peak points of the significant differences are listed in Table 2. Because change 1 is about upgliding diphthongization, which only affects the latter half of the vowel, only differences beyond the vowel midpoint (>50% realization) are considered relevant for interpretation. Significant differences that are found only in the final 10% of the smooth are excluded, as this part of the signal is strongly influenced by coarticulation (van der Harst, Reference van der Harst2011), making these differences unreliable.
Differences in vowel diphthongization before nonapproximant consonants by the separate regions, relative to the Netherlands-Randstad region.
Differences from the Randstad in the retraction of vowels including a following coda /l/, averaged over gender.
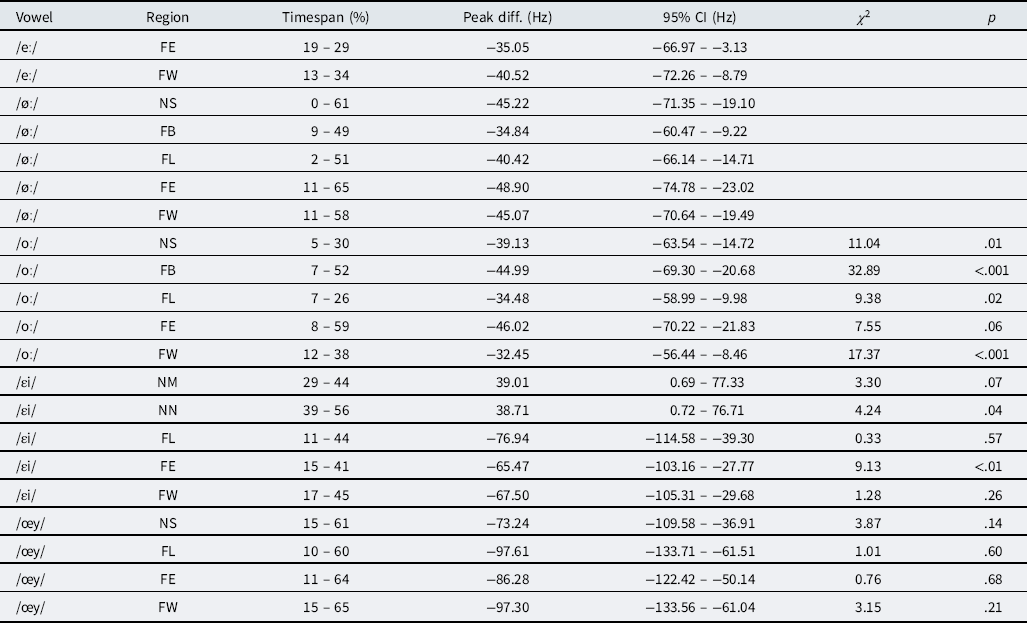
Regional differences in diphthongization before nonapproximant consonants. The “Timespan” column reflects the start and end point of the consecutive stretch of largest significant differences from the Randstad; the column labeled “95% CI” gives the 95% Bayesian credible interval of this largest difference. Only significant results are shown. The two right-hand columns are the lexical-diffusion measure; the χ 2 measures the amount by which individual words deviate from the peak difference in the middle column

There is systematicity in the combinations of vowel and region that show significant differences from the Netherlands-Randstad. With the exception of the /øː/ vowel in Flanders-East, all Flemish regions realize all five vowels with significantly less upgliding diphthongization (higher target F1) than the Randstad region. This observation already covers 79% (19/24) of the significant differences that were found. A second major role is played by the vowel /eː/, which the three non-Randstad regions in the Netherlands also diphthongize less strongly than the Randstad region, although the differences are quantitatively smaller than those between the Randstad and the Flemish regions. Thirdly and finally, in the Netherlands-Middle region the vowel /ɛi/ diphthongizes significantly less than the Randstad, and in the Netherlands-North the vowel /œy/ diphthongizes significantly more than in the Randstad.
The χ2 values in Table 2 measure the variability across words of the peak differences presented in the table, and hence provide an index of the degree of lexical diffusion detectable in these data. There is limited evidence for lexical diffusion of this sound change. This is partly due to a shortcoming of the corpus—for /eː/ and /øː/, only a single word was available in the non-/l/ condition (“fee” and “beuk”, respectively)—but for the words that are available, the variation did not turn out very large. Significant evidence of lexical diffusion is found in the /oː/ vowel (in regions FB, FE, and FW) and for the /œy/ vowel (in regions NN and FE). Only the former result is geographically contiguous, spanning all Flemish regions minus Flemish Limburg.
3.2 Change (2): Lowering of /ɛi,œy,ɔu/
Change 2, the lowering of /ɛi,œy,ɔu/ to [ai,ɒy,ɑu], concerns the same modeled differences as change 1, so the relevant differences can also be observed in Figure 4 Because change 2 is concerned with the nuclear vowels of the diphthongs, only differences before 50% realization are considered for interpretation. Differences that remain confined to the first 10% are excluded. As before, the differences are relative to the Netherlands-Randstad and are based only on the non-/l/ data. The peaks of the significant differences from the Randstad are listed in Table 3.
Regional differences in the lowering of /ɛi,œy,ɔu/. Only significant results are shown.
The significant differences are mostly confined to the Flemish regions, which overall have higher starting points (lower F1s) than in the Randstad. For the vowel /eː/, this is the case for the regions FE and FW, for the vowels /øː/ and /oː/, it is true of all four Flemish regions, and for the diphthongs /ɛi/ and /œy/, it holds for all Flemish regions but Flemish-Brabant. For the vowels /øː,oː,œy/, Netherlands-Limburg goes along with the Flemish regions, in having higher F1s. Finally, for the /ɛi/ vowel, the regions Netherlands-Middle and Netherlands-North have a significantly lower F1 than the Netherlands Randstad.
The lexical-diffusion chi-squares in Table 3 again provide limited evidence for lexical diffusion. These indicate the degree to which the peak differences in Table 3 are variable between the different words in the corpus. Significant χ2s are found for the /oː/ (regions NS, FB, FL, and FW) and /ɛi/ vowels (regions NN and FE) and for /ɛi/ in Netherlands-North and Flanders-East. The /oː/ vowel additionally shows marginal signs of lexical diffusion in Flanders-East (p = .06), in which case this vowel forms a coherent group: all of Flanders plus Netherlandic Limburg. Of the lexical-diffusion pattern found in the /ɛi/ vowel, the same cannot be said.
3.3 Change (3): Blocking of Diphthongization before /l/
Table 4 lists the ΔTTPs between the non-/l/ and the /l/ contexts, and their differences from the Netherlands-Randstad. The lexical-diffusion χ2s concern the between-word variation in these ΔNR scores.
Differences in the ranges of diphthongization before nonapproximant consonants versus before coda /l/, split out by vowel and region in order to answer RQ 3. Only regions significantly different from the Netherlands-Randstad are shown.

Similarly to the previous results, it is mostly the Flemish regions where ranges that are significantly different from the Randstad are found. For the /eː/ and /œy/ vowels, three of the four Flemish regions have significantly different ΔTTPs from the Netherlands-Randstad, and for /eː/ so does the Netherlands-South region. For the vowel /øː/ all four of the Flemish regions differ significantly. For the /oː/ vowel, only one region differs significantly from the Randstad: Flemish Limburg; the same also holds for the vowel /ɛi/. The directions of the differences call for some discussion. The hypothesized change 3 was one whereby vowels followed by non-/l/ would be diphthongized more strongly than vowels followed by /l/, but the ΔTTPs in Table 4 largely go into the opposite direction (the only exception is the /eː/ vowel). The ΔNRs, by contrast, are exactly as expected: all regions that are significantly different from the Randstad have more positive trough-to-peak differences than the Randstad, indicating a less severe distinction between the non-/l/ and /l/ conditions. Section 4 will discuss possible explanations.
The lexical-diffusion χ2s for the peak differences are large. This is because there is variation from the TTPs for the vowels preceding coda /l/ and also for the vowels preceding non-/l/. Because the object of interest is the combinations of these two sources of variation, the χ2 values will be larger, but so will their degrees of freedom and hence their p-values. The fact that all of the relevant χ2 values are significant thus suggests that these differences from the Netherlands-Randstad are quite variable between words, indicating that change 3 is lexically diffuse.
3.4 Change (4): Vocalization and Retracting Effect of Coda /l/
The fourth change concerns the second formant, rather than the first; Figure 5 shows the significant differences from the Netherlands-Randstad. As the coda /l/ was not separated from the vowel, it is included in this figure. Table 5 provides a summary of the significant differences relative to the Netherlands-Randstad that are visible. It can already be seen from Figure 5 that quite a few significant differences start at the very first few timepoints, which is consistent with coda /l/ having a retracting effect on the quality of the entire vowel.
Regional differences in the retracting effect of coda /l/.

Table 5 shows very clear results, which can be summarized as follows. All vowels in all Flemish regions exhibit significantly less retraction (i.e., higher F2) than the same vowels do in the Netherlands-Randstad. the Netherlands-North (for the vowels /eː/ and /oː/) and the Netherlands-South (for the vowels /ɛi/ and /œy/) also demonstrate some sporadic differences, but these are not very meaningful for interpretation, as they occupy relatively small stretches of signal, and the 95% CIs only just exclude zero, neither of which is true for the massive differences from the Randstad region in the Flemish regions. These regions show large effects (median difference = 574 Hz) over, in many cases, nearly the complete vowel-/l/ trajectory. There is some evidence for lexical diffusion. This is particularly the case for the /oː/ vowel, which is lexically diffuse in all four of the Flemish regions. Lexical-diffusion results for the other vowels are a bit more haphazard. The /øː/ vowel shows significant lexical diffusion in Flemish Brabant and Flanders-West, and the /œy/ vowel does so in Flanders-East.
4. Discussion
4.1 Primary Findings
We have discussed four sound changes that are currently ongoing in Dutch: (1) the diphthongization of /eː,øː,oː/; (2) the lowering of /ɛi,œy,ɔu/; (3) the monophthongization of diphthongs before coda /l/; and (4) the vocalization and retracting influence of coda /l/. The main tenet of the present paper was that the present-day regional distribution of these sociolinguistic variables could inform us about the current status and the nature of these four sound changes. The results presented in Section 3 support this viewpoint.
Change 1, the diphthongization of /eː,øː,oː/, was shown to be subject to significant regional variation. Nearly all Flemish regions were found to diphthongize the five vowels /eː,øː,oː,ɛi,œy/ significantly less than the Netherlands-Randstad. The same is true of the more peripheral vowel-region combinations in the Netherlands.
This paints the picture of an ongoing sound change that originated in the Randstad and has partially spread towards the other regions in the Netherlands, while affecting very little of Flanders. The between-region effects are phonetically gradual: there are no regions which categorically do not diphthongize their vowels, but there are quantitative differences in the degrees to which they diphthongize. Little evidence was found for lexical diffusion. Thus, according to the data in this corpus, change 1 is phonetically gradual but lexically (mostly) abrupt. Referring back to the typology of sound change reviewed in Table 1, this means that this change can be qualified as Neogrammarian. Note that the data show that change 1 is not, in fact, restricted to /eː,øː,oː/ but that /ɛi/ and /œy/ are also involved in the change, in exactly the same way as the tense mid vowels.
Change 2, the lowering of /ɛi,œy/, yielded similar results, mostly concerning the boundary between the Netherlands and Flanders: The Netherlands have undergone the change, but Flanders has not. To a lesser extent (namely, excluding the front vowels), Netherlands-Limburg turned out to be more conservative than the rest of The Netherlands, patterning more with Flanders on this change. This is consistent with change 2 being more recent than change 1, while both originated in the same area (Netherlands-Randstad; Jacobi, Reference Jacobi2009; Stroop, Reference Stroop1998). As with change 1, only weak evidence was found for lexical diffusion while there is substantial intracountry phonetic variation, allowing change 2 to be qualified also as Neogrammarian, as far as the data permit. In addition, the data again reveal that change 2 is not only lowering the nuclei of /ɛi/ and /œy/ but also those of /eː,øː,oː/.
Change 3, the blocking of diphthongs before coda /l/, is a rule change rather than a change in the locations of the vowels in the articulatory space. This qualitative change has quantitative effects on the difference between a vowel followed by /l/ versus by another consonant. The results suggest, to some degree, a split between The Netherlands and Flanders, although this split is not perfect and does not hold for all vowels (the vowels /oː/ and /ɛi/ are largely excluded). Most of the Flemish regions were shown to have a significantly less negative difference between vowels in /l/ versus non-/l/ words than the Randstad region. These regions thus make a smaller distinction between these two contexts than the Randstad does. This is in line with the hypothesis that the blocking of diphthongization started out as a sound change in the Randstad area.
Finally, change 4, the vocalization and retracting effect of coda /l/, is the largest of the four changes under investigation. The significant differences are large in magnitude, and in most cases span large sections of the signal, which is consistent with an across-the-board change in vowel quality. The results chiefly suggest a split between The Netherlands and Flanders, with all vowels in all Flemish regions being significantly different from the Randstad for very large stretches of signal. This agrees with observations by van Reenen and Jongkind (Reference van Reenen and Jongkind2000) that the Flemish varieties of Dutch use a clear coda [l] and the Netherlandic varieties realize a dark [ɫ]. The present results also extend them by showing that this difference is not confined to the realization of coda /l/ itself, but also affects the entire vowel preceding it. There is some evidence for lexical diffusion, although it is really only the /oː/ vowel that stands out in terms of significance, with all four of the Flemish regions obtaining a significant χ2). In terms of the mode of implementation of change 4, the evidence is thus inconclusive, both in the phonetic dimension and in the lexical dimension. Phonetically, the categorical differences between The Netherlands and Flanders suggest that change 4 is abrupt, but this could also simply reflect a change that has already completed. Lexically, the evidence of lexical diffusion achieves significance only for the /oː/ vowel, but the relatively large χ2 values do suggest a trend. Future research is necessary.
4.2 Secondary Issues
Concerning change 3, a final issue remains to be solved. While the differences from the Netherlands-Randstad region were all in the expected direction (ΔNR being positive, indicating less diphthongization in the non-Randstad regions), the range differences between /l/ and non-/l/ themselves were not. The mostly positive ΔTTPs in Table 4 suggest that there is more upgliding diphthongization before coda /l/, not less. The approach used to extract these scores compared the ranges of diphthongization between F1 peaks and troughs before /l/ versus non-/l/. In the non-/l/ case, this is not problematic, but in the /l/ case, the F1 will naturally fall at the onset of the /l/, because this consonant requires alveolar occlusion and hence raising of the tongue blade. This will also lower the F1 and will cause it to fall more strongly than an upgliding diphthong, as the latter does not require the tongue tip to make full contact with the alveolar ridge. This contextualizes the findings regarding change 3, in that the positive ΔNRs measured are more likely to have arisen due to differences in the nuclei of the diphthongs (i.e., the first 50% of the trajectory) rather than due to differences in the target positions: the latter are the same for all the /l/ words, hence making these words’ contributions to the ΔTTP measure relatively constant. The interpretation of the significant differences in the ΔNRs thus has to be that the Randstad observes a larger distinction in vowel quality between vowels followed by /l/ and vowels followed by non-/l/.
This is in line with change 2, the lowering of /ɛi,œy/. It was shown in Voeten (Reference Voeten2015) that, even in the Randstad region of The Netherlands, the realizations of /eː,øː,oː,ɛi,œy/ before coda /l/ were as monophthongs [eː,øː,oː,ɛ:,œː], omitting the lowering observed in change 2. It must then be the Netherlands-Randstad, in which area /ɛi,œy/ are lowered the most strongly, where change 3 results in a maximal difference between the /l/ vowel allophone and the non-/l/ vowel allophone. In regions where the lowering of /ɛi,œy/ is less advanced, this difference should be less salient. This is precisely what the results for change 3 show. The results for change 3 thus indicate that the lowering of diphthongs in change 2 is restricted to the non-/l/ condition, where vowels are realized as full upgliding diphthongs. It should also be observed that the degree of lexical diffusion is significant: all but one of the differences from the Randstad that were significant also achieved significant lexical-diffusion χ2s. Change 3 is thus lexically gradual. Given that it is also phonetically gradual—as demonstrated by the significant interregion variability—this change can therefore be qualified as a change by exemplars.
On the subject of lexical diffusion, the /oː/ vowel presents a noteworthy case. For changes 1, 2, and 4, the evidence for lexical diffusion was haphazard with the exception of this vowel. For some reason, in all of these three otherwise Neogrammarian changes, the /oː/ vowel shows significant between-words variation. This cannot be coincidental, and could be taken to imply that, technically speaking, none of these changes are truly Neogrammarian, as there is evidence of systematic lexical diffusion. This point is well-taken and demonstrates how the categories in Table 1 represent only theoretical endpoints of a practical continuum. But why is it the vowel /oː/ that consistently shows this high degree of lexical variability between the words in the corpus? The relationship between /oː/ and /ɔu/ may provide an explanation. The lowering of /ɔu/ to /ɑu/ is phonologically complete (as can be seen by the fact that /pɑul/ “Paul” is monophthongized to [pɑːɫ] rather than *[pɔːɫ], at least in Netherlandic Dutch; Voeten, Reference Voeten2015) and phonetically more advanced than the lowering of /ɛi,œy/ (Adank et al., Reference Adank, van Hout and Smits2004). If the vowels /oː/ and /ɔu/ have come to be further apart in phonetic space, then this may provide more room for /oː/ to vary due to, for instance, coarticulation, compared to the other vowels under study, which would naturally lead to increased between-word variation. A way to investigate this possibility would be to compute differences between /oː/ and /ɔu/ realizations and to compare their stability across different words using, for instance, the χ2 statistic. This approach would be analogous to that taken in the investigation of change 3 in the present paper. Unfortunately, as there was only a single word available for the /ɔu/ vowel in the present corpus and the associated model failed to converge, this must be left to future research using a different dataset or methodology.
4.3 Future Work
The results from this study provide new insights into the sociophonetic variation in the Dutch language area. Changes 1 and 2 turned out to be suspectly similar to one another in terms of their behaviors. In particular, change 1 turns out to actually not be restricted to the tense mid vowels /eː,øː,oː/ and change 2 turns out not to be restricted to the diphthongs /ɛi,œy,ɔu/. Instead, both changes demonstrate a more general split between The Netherlands and Flanders, where the latter has generally less open vowels and generally less diphthongization than the former. These observations are consistent with the idea that changes 1 and 2 are actually facets of a single, larger scale, Neogrammarian change that originated in The Netherlands and has subsequently not spread uniformly across the two countries. This is briefly touched upon by Jacobi (Reference Jacobi2009:87), although she does not explicitly posit this theory; the present results suggest that such an integrated account of change 1 and 2 as a single sound change is warranted by the data. The results additionally suggest that change 3 interacts with these two changes, which has been implied before (Voeten, Reference Voeten2015) but has only now been shown explicitly. Finally, the results from change 4 highlight the limitations of a synchronic approach to diachronic variation: the observed differences themselves are crystal clear, but these data do not tell us if this is because the change itself is very abrupt, or because it has already completed. A true diachronic investigation would be needed to answer this question.
A remark on the data used in the present paper is that the number of words included in the corpus was relatively low. While the data collector (Adank, Reference Adank2003) had made a very deliberate effort to incorporate sociolinguistically and phonologically relevant factors into her design, and the dataset is unique in its thorough representation of the regional variation in Dutch sociophonetics, the number of words per cell in the design ranged from one to five. This made it easy to construct the statistically principled χ2 measures of lexical diffusion (which would not have been feasible with thousands of words), but generalization of the lexical-diffusion results must be approached with appropriate caution. Despite the clear results found in the present study, which show that the quantitative approach to sound change taken here is promising, the χ2 measures would have achieved more power if the corpus had contained more words. As such, the lexical-diffusion statistics reported in the present paper represent only a lower bound, constrained by the limited amount of available data.
The present paper’s use of GAMMs to analyze (hard-to-segment) acoustic data logically adds to previous work using these models in sociophonetics, of which the aforementioned paper by Wieling et al. (Reference Wieling2016) is a prime example. This paper is particularly noteworthy since it provides an explicit measure of the degree to which formant data match the actual articulation. The results from the present paper and the acoustic analyses in Wieling et al. (Reference Wieling2016) are not directly comparable due to technical differences (e.g., Wieling et al. [Reference Wieling2016] do not include by-participant random intercepts, assume a different error distribution than the present paper, and optimize based on GCV rather than REML), but a qualitative comparison of the results between the two papers is highly worthwhile. The most important result by Wieling et al. (Reference Wieling2016) for this purpose is that their articulatory results had a higher sensitivity than their acoustic analysis of the same data: the articulatory data captured additional differences that were not borne out in the corresponding formant results.
For the present paper, this implies that there could be more regional variation in the pronunciation of Standard Dutch, and hence in the four ongoing sound changes, than the acoustic results were able to capture. Concretely, this would mean that there may be additional differences beyond those reported here and that the lexical-diffusion χ2s may underrepresent the variation that is in truth present; in other words, the present results demonstrate a lower bound on the regional variation in the four Dutch sound changes and certainly not an upper bound. However, it should also be noted that Wieling et al. (Reference Wieling2016) used GAMMs for their articulatory data, but only used linear mixed-effects regression for their acoustic data. It is quite possible that these linear models were simply not flexible enough to capture all the variation in the acoustic data. Certainly, the results from the present paper demonstrate that, even in the reliably segmented non-/l/ condition that is well-comparable to Wieling et al.’s (Reference Wieling2016) articulatory data, the formant trajectories clearly are more variable than a straight line, and hence the discord between the articulatory and acoustic measures may in practice turn out less severe. Data-analytical differences aside, however, it remains the case that the correlations between F1 and height and F2 and backness are only approximate: as said in Wieling et al. (Reference Wieling2016), this is a fact grounded in phonetic theory and very much confirmed by their results, which show that the measures indeed correlate significantly but not very strongly. The similarities and differences between acoustic and articulatory approaches to sociophonetic variation and the study of sound change still warrant additional research.
5. Conclusion
The goal of this study was to describe and explain the synchronic regional differences resulting from four diachronic changes in Dutch: the diphthongization of /eː,øː,oː/, the lowering of /ɛi,œy,ɔu/, the blocking of diphthongs before coda /l/, and the increasing vocalization and retraction of coda /l/. These issues were investigated by means of an analysis of the teacher corpus (Adank, Reference Adank2003). The results show that changes 1 and 2 are Neogrammarian, while change 3 was classified as change by exemplars. The evidence suggests that these three changes together constitute different facets of a single ongoing vowel shift. Change 4, on the other hand, was of indeterminate status; this change demonstrated the limitations of the synchronic approach to diachronic variation and is in need of future research. These results show that the approach adopted in the present paper, when combined with the appropriate statistical tools, can lead to new insights that would not have been obtained with the same efficiency from a real-time diachronic study.
Acknowledgments
I am grateful to my dissertation supervisors, Claartje Levelt and Yiya Chen, for their helpful and insightful advice on various issues, from methodology to writing style, concerning this paper. I also thank Harald Baayen for warmly receiving me for a one-day stay at Eberhard Karls University in Tübingen and offering his advice on the analyses presented here. I am also indebted to Hans Van de Velde, who provided me with the dataset. Finally, I thank Laura Smorenburg, Meike de Boer, and Willemijn Heeren for helpful discussions on various parts of the data and their analysis.
This work is part of the research program Watching Dutch Change with project number PGW-15-15, which is (partly) financed by the Dutch Research Council (NWO).


 Open access