


Many professors across the United States endeavor to create course structures that maximize material retention while simultaneously developing concrete “real-world” skills. Increased utilization of experiential pedagogical methods can bring these abstract concepts to life (Mann Reference Mann2018). This article uses experiential-learning literature as a descriptive framework to investigate the yearlong public opinion polling course at the University of Montana (UM): the Big Sky Poll (BSP). Established in 2017, the BSP collects and reports information about Montanans’ perceptions of local, state, and federal issues. This article discusses the lessons that we can learn from a student-led yearlong polling course in a rural, Western state. We describe the elements of this co-taught interdisciplinary polling course, which goes beyond other experiential-learning courses that incorporate polling (Mann Reference Mann2018).
This article uses experiential-learning literature as a descriptive framework to investigate the yearlong public opinion polling course at the University of Montana (UM): the Big Sky Poll (BSP).
Although other universities (e.g., Marist and Quinnipiac) use student involvement at various points in their polling operations, we argue that the experiential-learning opportunity provided by the BSP is uniquely comprehensive and immersive. We documented the voices of our students in this cowritten article to suggest that public opinion polling classes serve as an important vehicle to advance experiential learning, encourage data-driven skills, and promote original perspectives from a rural Western state.
Although other universities (e.g., Marist and Quinnipiac) use student involvement at various points in their polling operations, we argue that the experiential-learning opportunity provided by the BSP is uniquely comprehensive and immersive.
POLLING AS EXPERIENTIAL LEARNING
Experiential learning offers our students an immersive experience, as Lewis and Williams (Reference Lewis, Williams, Jackson and Caffarella1994) suggested. More specifically, experiential learning is interdisciplinary; is like the real world; and promotes meaningful connections among students, professors, the material, and the world. Much of the value of experiential learning comes from the way it “mimics everyday learning” (Moon Reference Moon2004, 165). Courses that incorporate experiential learning encourage the importance of reflection for our students. At the end of an experiential-learning course, students should be able to analyze their own values and reflect on their own learning (Chapman, McPhee, and Proudman Reference Chapman, McPhee, Proudman and Warren1995). Students confront complicated scenarios and ethical problems, but the classroom can provide a safe environment for exploring alternative solutions to difficult problems (Cunningham Reference Cunningham1997).
Polling as an experiential-learning exercise in college classrooms is not uncommon (Cantor Reference Cantor1995). Mann (Reference Mann2018) described an experiential-learning course in which undergraduate students observed polling places during the 2016 election. Participation in this exercise increased students’ interest in future research and allowed them to directly experience political processes rather than simply reading, watching, or hearing about them (Mann Reference Mann2018).
Rigorous polling and analysis in the classroom, however, can be limited by scarce resources. Williamson (Reference Williamson2011) noted that the monetary investment required for telephone polling represents a barrier for classroom experiences that does not bring in outside resources. In Williamson’s experience at Lycoming College, telephone polling can be difficult due its high cost. In comparison, academic polling operations with resources (e.g., the Quinnipiac University Poll and the Marist Poll) generally limit student participation to telephone interviews. The majority of poll preparation and analysis does not take place in the classroom.
Absent from these approaches is a framework for students to be involved in a polling operation from creation to implementation. We use the UM BSP as a model for college courses to replicate. Our approach provides an opportunity for students to engage in experiential learning in which they are involved in every stage of the process, including survey script design, data cleaning and analysis, drafting of press releases, and report writing. We describe this process and offer insights from our students about how this approach has assisted them in advancing their skills necessary for the workforce after graduation.
A NEW MODEL AND LOGISTICS
We begin with an overview of the details of the UM BSP before turning to findings and implications. In 2017, two professors (i.e., political science and marketing) at UM determined that to advance the skills of their students, experiential-learning opportunities were necessary and that an interdisciplinary, yearlong public opinion polling course should be created. Collectively, the professors solicited student involvement from their respective graduate programs: the Master of Public Administration and the Master of Business Analytics Programs (MSBA).
Each year, a small group of students from each program is invited by the professors to participate in the poll. On average, five to eight students enroll. The syllabus clearly states: “This course is unlike any other class you have taken at the University of Montana. It will push you to apply the knowledge you have acquired to date to transform research into useable data that informs statewide, local, and university decision making. We invite you to come to each class session with an open mindset and ability to adapt. In many ways, this course is more of a (great!) job than a class.”
Most university-based polling operations that involve students restrict their participation to the periphery. Most commonly, student roles within these operations are limited to staffing the telephone bank, observation, and occasionally cleaning the raw data and conducting basic template analyses (Mann Reference Mann2018; Williamson Reference Williamson2011). Although professors direct the BSP, students are integral to each step of the process. The BSP provides an environment in which students are involved from design to implementation. Students enrolled in the course sign up for a yearlong experience. They receive 3 credits per semester (i.e., 6 total credits) for their participation.
Since spring 2018, a poll (telephone or online) has been conducted every semester. The results are released to the public and posted on our BSP website.Footnote 1
It’s a Job
From the internal class structure to the final published results, the BSP operates in a form similar to a standard professional public opinion polling operation. The intent is to conduct the course so that the experience is comparable to “real-world” employment. The course meets once a week for two hours.
At the beginning of the year, the professors email a survey to students asking them to rank their preferences for a specific job assignment for the year. Using a combination of their own knowledge of the students’ abilities and their preferences, the professors assign each student one of the available jobs. These jobs include project manager, assistant project manager, media relations expert, quantitative data analysis expert, and qualitative analysis expert. When considering the assignments, the professors attempt to identify which student will best fulfill the responsibilities of each role. For example, the project manager excels in mixed research methods and is highly organized and well versed in data management. The assistant project manager serves as a key lead in assisting the project manager in overseeing class projects. The quantitative and qualitative experts are essential to drafting survey language and coding data. The media relations expert leads the production and publication of press releases for newsworthy poll findings and written reports. Regardless of job title, however, students are tasked with working in a team-driven, fast-paced environment.
The cohort size, class structure, and polling logistics ensure that all students are exposed to and involved in various aspects of polling. This allows them to build skills outside of their areas of expertise, thereby maintaining a holistic learning experience and producing a quality product.
Class Structure and Deliverables
As noted previously, the course meets once a week for two hours. The course syllabus structures the class as a work environment in which students meet with their instructors once a week to review assigned job duties, discuss preparatory content to achieve a deliverable, and work collectively as a group. For example, at the beginning of each fall semester, we discuss the field of public opinion polling (using Dillman’s textbook), how to design a survey and obtain Institutional Review Board (IRB) approval, and commence work on the deliverables. This way, students have a solid foundation and professors can adapt the course schedule to address any deficiencies in student research abilities.
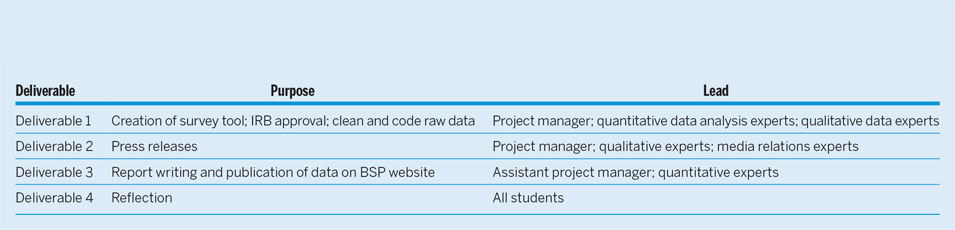
Throughout the semester, students complete “deliverables.” These assignments engage them in all aspects of the polling process. As demonstrated in table 1, deliverable 1 requires students to craft the survey tool, apply for IRB approval, clean the raw survey data, establish appropriate weighting measures, and prepare an aggregate breakdown of demographics and responses. Crafting the survey tool is a collaborative process during which we supplement our repeatable canon of questions with more topical questions, including a key issue at the time (e.g., gun policy) as well as an apolitical Montana trivia question. Deliverable 2 allows a student team to examine the data and prepare a series of press releases for the media. For deliverable 3, students write a comprehensive report including aggregate-level data and overall trends. This information is posted and released for the public and media to view on the BSP website. Deliverable 4 allows students to reflect on the process and provides insight for the next poll and/or new cohort of students. Students in the MSBA program or those with more experience in quantitative research take the lead on the data-cleaning and trends assignments while more policy-driven students focus on writing press releases and analysis reports.
Table 1 BSP Deliverables
Grades
Inevitably, students are concerned about their grades. In this course, rather than traditional letter grades, performance on deliverables is evaluated using a 3-point scale. As clearly noted in the syllabus: “Our goal is to ensure high-quality research and reporting for each deliverable. If you are a good citizen, receive a plurality of 1s and 2s on work, and contribute your fair share, you will receive an A in the class. However, if your peers view you as a zero, your grade can and will suffer.” The scale is clearly defined in the course syllabus as follows:
2=high quality
1=moderate quality, needs improvement, revision needed
0=low-level quality, needs substantial revision to pass
This nontraditional approach to grading was discussed with the students. As Oros (Reference Oros2007) suggested, reflection and discussion are important for experiential-learning experiences. Professors discussed with students that the grading scale reflects their job performance in the course. In addition, students were asked to reflect at the midpoint and at the end of the semester about their own job performance and that of their peers.Footnote 2 After completion, professors set up one-to-one conferences to discuss their progress and address any concerns.
BROADER IMPLICATIONS AND CONCLUSION
To date, four statewide public opinion surveys have been conducted by the BSP. Three of the polls have been telephone surveys (i.e., spring 2018 and fall 2018) and one was an online survey (i.e., spring 2019).Footnote 3 Throughout these iterations, students have been involved in every step of the survey process, with each cohort building on the previous group’s work. To build longitudinal data, each poll includes the BSP canon of questions (e.g., approval ratings of elected officials and demographics). Each iteration also includes topical questions relating to a current national issue (e.g., immigration and marijuana use) and a statewide trivia question. For example, one trivia question asked respondents to identify the motto on the Montana state seal, which connected and engaged students who otherwise may not be politics oriented—as well as to generate interest from members of the public who are not politically inclined. Furthermore, the trivia question teaches students the potential value of polling and statistical-analysis skills outside of the political realm. Students in the course, with faculty supervision, are asked to individually research current national and state issues as well as a Montana trivia question. They present this information to the class as part of deliverable 1, which engenders a collective conversation about what information should and should not be included in the survey and how the class would examine the variables.
Student Lessons Learned
From a student’s perspective, several lessons can be learned. First, our students relate that the BSP provides a more immersive experience than standard student involvement in political polling. According to one, “I learned the most in this course because it was yearlong, immersive, and I was a lead on assignments.”
With support from professors, students are responsible for preparing reliable survey data using rigorous statistical methods. This process requires numerous high-level skills such as establishing sound survey methodologies, writing effective survey questions, and analyzing and publishing the responses. The BSP results are intended to provide a reliable measure of public opinion in the state of Montana, not merely to submit an assignment at the end of the semester. This process is in contrast to current polling experiential-learning practices, which primarily focus on class assignments at the undergraduate level (Bennion Reference Bennion2006; Mann Reference Mann2018; Williamson Reference Williamson2011).
Second, students who participate in experiential-learning opportunities may become more invested in the final products while gaining valuable real-world, marketable experience (Cantor 1997). The BSP goal is for students to leave the yearlong class with the ability to perform high-quality quantitative and qualitative research and analysis on a par with industry standards. Moreover, BSP students diligently work to effectively communicate the survey results to industry experts as well as the general public—an important skill for entering the workforce.
Third, the BSP is a nonpartisan, university-based polling operation that contrasts with for-profit polling firms or those working in coordination with political campaigns. A classroom-based polling operation allows for theoretical and ethical discussions to occur in earnest—necessary conversations in the post-2016 public opinion polling industry. For example, as one student explained, “When our results didn’t align with other established polls, we released our results because it is our ethical and research obligation to do so.” Another benefit of a student-led polling model is the opportunity to engage in fundamental discussions about weighting and how to convey results to the public so that they are clear and understandable.
Fourth, although there may have been frustration, students appreciated the opportunity to learn from their mistakes and the challenges they faced. For example, the pace of our public opinion polling in fall 2018 was uncommon for our students. This polling took place during the midterm elections with a hotly contested US Senate race in Montana. As a student recalled, “The pace was incredibly fast because we had to maintain accuracy in reporting, but the turnaround time for results placed a lot of pressure on our team due to the mid-term elections.” Another student noted, “The fast pace pushed me and my classmates to learn by doing. I haven’t received this is any other class.”
Fifth, due to the nature of an education-based polling operation, when mistakes occur, students feel more comfortable bringing those to the attention of the group, asking for feedback, and working together to problem solve. For example, when compiling a report for public release, students noticed inconsistencies in the raw data compared to the final report, which led to a complete reevaluation and reworking of the report.
Sixth, as the job market changes for our students, data-analysis skills are critical. To date, the 13 students involved in the yearlong polling class have used this experience to excel after graduation. For example, one student is now conducting data analysis in a legislative-audit position. Another student was able to use these skills to obtain acceptance into a political science doctoral program.
Limitations
As Williamson (Reference Williamson2011) suggested, polling in our classrooms is not without limitations. From the student perspective, one limitation is the rapid pace and steep learning curve. The 2018 midterm election provided ample learning opportunities. For instance, some students felt uncomfortable that our work, released to the public, was sometimes scrutinized or taken out of context by the media. One student lamented, “We even wrote the press releases to ensure our data was accurately reported, but some news entities just took excerpts to fit a narrative.” However, according to another student, “It was difficult and stressful, but it was exciting to be producing results that were discussed in the media.”
Another limitation is student data-analytical skills. Each student is expected to have some background in research methods. However, this can vary among students in any given semester. We used SPSS to examine our data and some students did not have experience with this software; they were more familiar with STATA or R. As one student stated, “The first couple of months were a crash course, and there was a steep learning curve, but it was motivating knowing that the final product would be meaningful.” We recommend a more thorough review of interested students’ statistical-analysis skills to determine whether they meet a minimum threshold. This should involve discussions with faculty in statistics and other methods classes to ensure that the instructors are familiar with the structure and demands of the BSP course.
Unlike most academic polling operations, students in the BSP course do not complete calls to respondents; this task is contracted to an industry firm to conduct. On the opening evening of each poll, however, students have the opportunity to listen to live calls and provide feedback for the callers. According to one student, “This allowed for the class to hear their work come to life and ensure that pronunciations of names were accurate.”
From a faculty perspective, public opinion polling is costly. On average, a rigorous poll can cost more than $30,000 per year. Our poll costs approximately $9,000 per semester for a 5- to 7-minute telephone survey. Costs increase for longer surveys with larger samples. We seek to offset the high costs with grants and university support. In the future, the BSP will develop a fellowship model to maintain student interest, ensure longitudinal data, and provide a cost-effective approach. Although our students receive academic credit, we believe that a fellowship model, with a stipend, rewards them for the real-life work setting that the BSP provides.
CONCLUDING THOUGHTS
This experiential-learning course challenges us to reconsider how we teach our students about public opinion polling in our classrooms. In the BSP experiential-learning experience, we provide our students the opportunity to learn about the fundamentals of public opinion polling by advancing their data-analysis skills as they prepare for the job market. This expertise, in turn, could be transferrable for national polling entities after graduation. From our students’ perspective, the BSP has increased their knowledge because they are “involved in each step of the public opinion polling process.”
In addition, this experience is invaluable from a faculty perspective. It affords faculty members the opportunity to publish additional independent research. More specifically, longitudinal data obtained from an experiential-learning polling course can assist faculty to examine the data and their effect on state trends.
The experiential-learning classroom is “learning by doing.” The BSP provides an example of how polling is advantageous for our students. It keeps them engaged in the world and provides direct experience to develop the hands-on skills necessary for employment after graduation. Within the changing landscape of how we conduct public opinion polls, we can use the course as an opportunity for students to learn cutting-edge techniques while also advancing the profession and our understanding of what drives public opinion in the United States.
The BSP provides an example of how polling is advantageous for our students. It keeps them engaged in the world and provides direct experience to develop the hands-on skills necessary for employment after graduation.

