


The post-prandial glycaemic response to a fixed carbohydrate load can be used to assess the proficiency of glucose control(Reference Fletcher, Perfield and Thyfault1). Repetitive and/or prolonged hyperglycaemic episodes are linked to a heightened risk of multiple health conditions including: type 2 diabetes mellitus, CVD and ultimately premature mortality(Reference Borch-Johnsen, Neil and Balkau2). Ineffective post-prandial glucose tolerance also impairs satiety perception and is thus linked to obesity, a key risk factor for type 2 diabetes(3,Reference Zafar, Waslien and AlRaefaei4) . Even amongst normoglycaemic individuals(5), those with poorer post-prandial glycaemic control are at increased risk of developing type 2 diabetes and CVD(Reference Ning, Zhang and Dekker6). The prevalence of these morbidities is increasing and presents a large personal and socio-economic burden(3,7) . Several clinical markers are available to diagnose defective glucose control; incremental area under the blood glucose concentration curve (iAUC) reflects the response to a glucose challenge and provides a more valid indication of glucose tolerance than basal/fasted measures alone(Reference Borch-Johnsen, Neil and Balkau2,Reference Gonzalez and Stevenson8) . This is entirely understandable given that the time spent hyperglycaemic is a primary factor in the aetiology of diabetic complications(Reference Fonseca9,Reference van Dijk, Manders and Hartgens10) .
Beyond the internal validity of post-prandial glycaemia as a measure of glucose control, the external validity of fasted (i.e. post-absorptive) measures is also more limited given that typical eating patterns in most societies mean that humans spend most or all waking hours in a fed state (i.e. post-prandial)(Reference Fonseca9,Reference De Castro11) . Of even greater practical relevance is the response to sequential meals, as most meals are therefore consumed in an already post-prandial state. The ‘second-meal effect’ describes how initial glucose ingestion improves glucose tolerance at a second eating occasion(Reference Hamman and Hirschmann12). Whilst this phenomenon was first discovered with sequential oral glucose tolerance tests, a more ecologically valid method considers the effect of the mixed-macronutrient meals. This has been most commonly examined in the literature as the magnitude of metabolic responses to lunch when breakfast is consumed, comparative to no breakfast(Reference Gonzalez and Stevenson8). Notably, this effect also promotes a more even glycaemic stability across the day, thus eliciting a potentially beneficial effect on satiety perception(Reference Astbury, Taylor and Macdonald13). The second-meal effect is hypothesised to involve several interacting mechanisms, such as enhanced hepatic and peripheral insulin sensitivity, potentiated insulin secretion, and slowed gastric emptying following ingestion of a second meal(Reference Gonzalez14).
Whereas the influence of carbohydrate (CHO) and fat on second-meal effects are relatively well understood (i.e. high-CHO, low-glycaemic index and low-fat breakfasts are effective in optimising the insulin secretion and glycaemic response to lunch(Reference Ando, Nakae and Usui15–Reference Wolever, Bentum-Williams and Jenkins18)), the efficacy of protein has received less research attention. Several studies have demonstrated that protein, specifically whey, consumed as a pre-load can elicit the second-meal effect(Reference Abou-Samra, Keersmaekers and Brienza19–Reference Ma, Stevens and Cukier21). This has been attributed to augmented insulin secretion and insulin priming of the muscle and liver, alongside delayed gastric emptying of the second load(Reference Akhavan, Luhovyy and Brown20,Reference Ma, Stevens and Cukier21) . Protein ingestion has also been linked to appetite suppression and a reduction in subsequent energy intake(Reference Zafar, Waslien and AlRaefaei4,Reference Akhavan, Luhovyy and Brown20,Reference Pal and Ellis22) , although other studies report no such effects(Reference Abou-Samra, Keersmaekers and Brienza19,Reference Bowen, Noakes and Clifton23) . In addition, recent evidence suggests that a high-protein breakfast may be a more potent stimulator of the second-meal effect than a high-CHO breakfast(Reference Meng, Matthan and Ausman24,Reference Park, Heden and Liu25) , although this possibility requires confirmation in young, normoglycaemic populations. Moreover, previous studies have only examined the carry-over effects between the established daily sequence of eating occasions (i.e. breakfast–lunch–dinner), yet a novel strategy would be to attenuate the profound first glycaemic response after waking using a model wherein breakfast serves as the second meal of the day.
The purpose of the present study, therefore, was to examine the effect of nocturnal whey protein ingestion on the glucose response to breakfast, alongside any secondary effects on subsequent satiety and energy intake later in the day. Based on extant literature examining the effects of prior feeding during the morning on metabolic responses to lunch, we hypothesised that protein ingestion would attenuate the glycaemic response to breakfast and reduce subsequent appetite and energy intake.
Experimental methods
Approach to the research question
The innovative nature of this investigation stems from the unique combination of protein ingestion with nocturnal feeding. Whey protein was chosen in preference to alternative protein sources (such as casein) due to a shorter gastric emptying time, resulting in a more rapid development and greater magnitude of hyperaminoacidaemia and therefore a more rapid insulin release. This is consistent with the rationale for our stated hypothesis above that an increased morning insulin requirement is due to a lack of residual insulin from a preceding meal(Reference Hall, Millward and Long26). As such, this novel strategy may reduce the insulin requirement to breakfast, consequently improving glucose control.
Whey also reduces subsequent food intake and appetite to a greater extent than casein, egg or soya(Reference Akhavan, Luhovyy and Brown20,Reference Hall, Millward and Long26,Reference Anderson and Moore27) . A whey protein dose between 20–40 g can be effective in reducing appetite, while as little as 10 g is reported to stimulate the second-meal effect(Reference Akhavan, Luhovyy and Brown20). A large, but palatable dose of 63 g was used in this novel protocol to conclusively elucidate any effects on sequential glycaemic response and satiety (i.e. if effects are observed then that provides proof-of-principle and could warrant further examination of lower doses). This protein solution was made up with 300 ml of water instead of milk to avoid confounding effects of fat ingestion and to allow any effects of protein to be isolated.
The time of protein feeding was 04.00 (sd 1) hours to ensure a post-absorptive state following dinner and to allow sufficient time before breakfast for the acute initial metabolic response to the ingested protein to subside. The time of feeding resulted in, on average, a 5 h 39 min period between protein ingestion and breakfast, which aligns with the majority of studies investigating the second-meal effect using 3–6 h between sequential meals(Reference Astbury, Taylor and Macdonald13,Reference Wolever, Bentum-Williams and Jenkins18,Reference Allerton, Campbell and Gonzalez28,Reference Jovanovic, Leverton and Solanky29) . Additionally, participants were instructed to be in bed, lights out, at 23.00 hours, which would therefore result in a minimum of 5 h separating dinner and the nocturnal protein feed. A mixed-macronutrient tolerance test was deemed more appropriate than an oral glucose tolerance test as the present study focuses on the response to sequential meals to provide practical results applicable to daily living. A porridge breakfast aligns with this aim as a common breakfast meal, providing information on the ability to process a realistic glucose and fat challenge.
Participants
Fifteen individuals who self-identified as healthy volunteered to participate (seven males, eight females; age, 22 (sd 3) years; BMI, 24·0 (sd 2·8) kg/m2; resting heart rate, 69 (sd 15) beats/min; resting mean arterial pressure, 72 (sd 6) mmHg; fasting blood glucose, 4·9 (sd 0·5) mmol/l; sleep chronotype, 54 (sd 7) (intermediate)). Participants were informed of the study objectives, requirements and any potential risks before written consent was obtained. Ethical approval was received from the University of Bath Research Ethics Committee (SESHES-18R1-004). Exclusion criteria included allergy or intolerance to any of the breakfast constituents or any metabolic conditions which may have posed undue personal risk to the participant or introduced bias into the experiment.
Study design
The present study employed a randomised crossover design, comprising two conditions; nocturnal ingestion of either a protein solution (PRO) or water (control; CON). The following morning participants visited the laboratory to complete a mixed-macronutrient meal tolerance test. Participants were not blinded to the condition as it would have been immediately apparent upon ingestion and to analyse subsequent food choices participants needed to be aware of their consumption as they would in free-living conditions. Trials were completed within a month for males, or within 4–7 d for females to ensure the phase of the menstrual cycle was consistent between trials in order to avoid large systematic differences in glucose control due to menstrual cycle phase(Reference Pulido and Salazar30). All procedures were performed in accordance with the Declaration of Helsinki.
Experimental procedures
Participants refrained from vigorous physical activity and replicated their diet the day prior to both laboratory visits. Compliance was confirmed verbally upon laboratory arrival. A schematic for the study protocol is shown in Fig. 1. Prior to data collection, participants completed the Horne & Östberg Morningness-Eveningness Questionnaire(Reference Horne and Östberg31), to assess sleep chronotype and establish habitual morning or evening preference. Participants were instructed to be in bed, lights out at 23.00 hours, awaking at 07.00 hours and arriving in the laboratory the following morning at 09.00 hours. Participants awoke at 04.00 hours to consume the relevant solution. Compliance was confirmed with a text message to a researcher at this time. Based on the questionnaire results, these time components were adjusted by 1 h for morning or evening preference. This aimed to minimise disturbance to habitual sleep patterns due to the confounding effect on glucose tolerance(Reference Knutson32).

Fig. 1. Protocol schematic. A mixed-macronutrient tolerance test was conducted following nocturnal ingestion of either protein (PRO) or water (control; CON). VAS, visual analogue scale.
Upon laboratory arrival the following morning, anthropometric (height and mass) and pre-breakfast resting measures were collected. Fingertip blood glucose concentration was recorded using an automatic glucose analyser (CV 5·03 %) (FreeStyle Optium, Abbott Laboratories Ltd). Three 5-min expired gas samples were collected using Douglas bags (Hans Rudolph), which were analysed using a Servomex 1440 Gas Analyser (Servomex Group Ltd) and the volume of expired air determined by evacuating the Douglas bag with a dry gas meter (Harvard Apparatus). Heart rate and blood pressure (Omron M2 Compact blood pressure monitor, Omron Healthcare Co.) were collected, alongside 100 mm visual analogue scales (VAS).
A standardised porridge breakfast was then consumed, followed by a 2-h resting period in the seated position with water consumption permitted (ad libitum). Blood glucose measurements were collected every 15 min for the first 60 min and then every 30 min until 120 min. Five-min expired air samples were collected at 20, 40, 75 and 100 min. At 60 and 120 min appetite VAS were completed. Upon completion of the tolerance test, participants were free to leave the laboratory and completed a food diary for the remainder of the day under free-living conditions.
Nutritional composition
Experimental solutions were prepared by researchers and provided to participants the night before the trial. The protein solution contained 75 g whey protein powder (Myprotein), resulting in an intake of 63 g protein (21 g protein per 25 g serving), 300 ml of water and 0 kJ vanilla flavouring drops to taste (Myprotein). An amino acid profile for the whey protein used is depicted in Fig. 2. The control solution was 300 ml water. Breakfast consisted of 29 % porridge oats (Sainsbury’s), 67 % whole milk (3·7/100 g fat; Sainsbury’s) and 4 % granulated sugar (Sainsbury’s). Porridge was provided in quantities to deliver 1 g CHO/kg body mass, obtained from 80 % oats and 20 % sugar. This resulted in an energy intake of 2356 (sd 435) kJ, containing 18·0 (sd 3·3) g protein and 72·4 (sd 13·9) g CHO. The quantity was replicated for the second trial, regardless of any minor change in body mass. Participants were instructed to consume the porridge within 15 min to standardise effects of eating rate upon appetite hormones(Reference Kokkinos, le Roux and Alexiadou33).
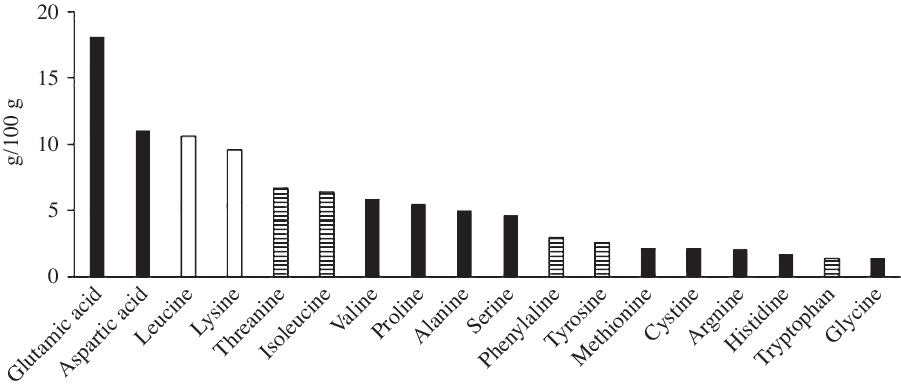
Fig. 2. Amino acid profile of the whey protein used. ![]() , Glucogenic;
, Glucogenic; ![]() , mixed;
, mixed; ![]() , ketogenic.
, ketogenic.
Statistical analysis
All data are presented as mean values and standard deviations. Statistical analyses were performed using the Statistical Package for the Social Sciences (IBM SPSS Statistics 25), with statistical significance accepted at an α level of P ≤ 0·05. A minimum sample size of eleven was calculated in order to detect an effect size of 0·95 with 80 % power (G*Power 3.1.9.4), based on the effect size in similar studies in normoglycaemic individuals(Reference Meng, Matthan and Ausman24,Reference Nilsson, Östman and Granfeldt34) . Data from one female participant who volunteered for the study were not included in the analysis because she experienced very poor sleep quantity in the control condition (>2 sd below the mean), given the established negative effect of sleep deprivation on glucose tolerance(Reference Knutson32). This is illustrated by her almost doubled blood glucose iAUC in the CON condition (396 v. 195 mmol × 120 min/l).
Blood glucose iAUC was calculated using the trapezoid method(Reference Wolever35). Rates of oxygen utilisation and carbon dioxide production were used to calculate RER and energy expenditure from expired gas samples(Reference Péronnet and Massicotte36). Substrate oxidation rates were calculated in accordance with the stoichiometric equations outlined by Frayn(Reference Frayn37) assuming negligible protein oxidation. Of the three resting gas samples, the average of those within a 418 kJ/d agreement in energy expenditure was taken to calculate pre-breakfast values of substrate utilisation, RER and energy expenditure. If none of the three bags met this criterion, the lowest of the three samples was considered the most reflective measure of RMR (this was the case for five out of twenty-seven bags). Scores from the appetite VAS were combined to give an average appetite score at each time point according to the equation outlined by Gonzalez & Stevenson(Reference Gonzalez and Stevenson8). Regarding sleep VAS, a difference >10 mm is deemed of clinical relevance and more meaningful than statistical significance(Reference Zisapel and Nir38), and thus this criterion was used when examining intraindividual differences in VAS scores between conditions.
A Shapiro–Wilk test was used to assess the normality of intraindividual differences between conditions. Consequently, a paired t test was applied to analyse normally distributed parametric data and a Wilcoxon test used for non-parametric data. Order effects were examined with a paired t test for iAUC between trial 1 and 2 alongside a two-way mixed-models ANOVA (treatment × sequence); there was a 2·2 % decrease in iAUC from trial 1 to 2 with no significant order effect (P = 0·875) and no treatment × sequence interaction (P = 0·509, F = 0·463). Pearson correlation coefficients were calculated for the difference in iAUC between conditions and both body mass and sleep quality (calmness and wakefulness). A two-way repeated-measures ANOVA (treatment × time) was used to examine differences in blood glucose response and appetite over time. The Greenhouse–Geisser correction was applied for epsilon values <0·75 and the Huynd–Feldt correction applied for less severe asphericity. Effect size was calculated using pooled standard deviation, with Cohen’s thresholds applied(Reference Cohen39).
Results
Blood glucose concentration
Blood glucose concentrations increased more rapidly in PRO than in CON, reaching a 7·5 % higher peak (7·9 (sd 1·4) v. 7·3 (sd 0·9) mmol/l, P = 0·049, d = 0·50, moderate effect; Fig. 3(a)) and then remaining higher than the CON trial until the final blood sample, such that there was a main effect of treatment (P = 0·037, F = 5·392) but no treatment × time interaction (P = 0·308, F = 1·241; Fig. 4). Accordingly, there was a 28·1 % mean increase in post-prandial blood glucose iAUC in the PRO condition (161·8 (sd 55·7) v. 116·3 (sd 39·2) mmol × 120 min/l (P = 0·009, d = 0·94; Fig. 3(b)). Time spent above the clinical threshold of 7·5 mmol/l blood glucose concentration was longer in the PRO trial for nine out of fourteen participants by an average of 8·2 (sd 13·4) min (15·9 (sd 17) v. 7·7 (sd 11·6) min, P = 0·039, d = 0·56, moderate effect). Although not significant (P = 0·206, d = 0·48, small effect), on average there was a 6·4 (sd 18·3) min delay in time to peak glucose with PRO (37·5 (sd 16·4) min) compared with CON (31·1 (sd 9·2) min).
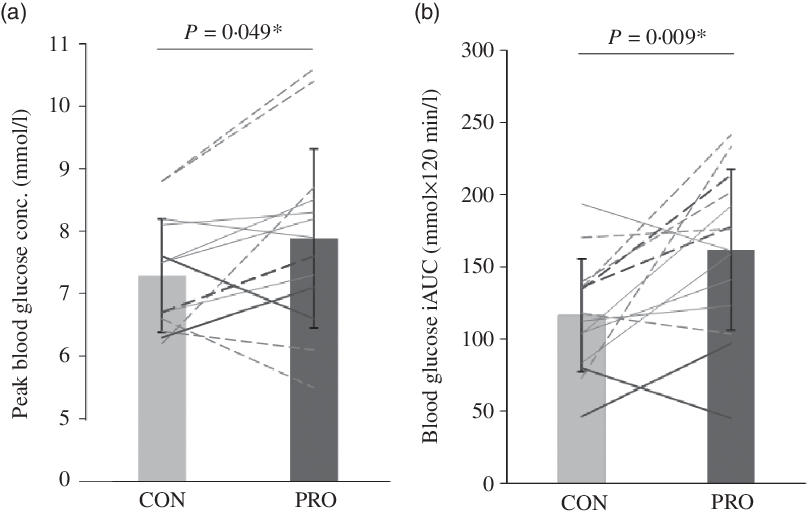
Fig. 3. (a) Peak blood glucose concentration (conc.) and (b) incremental area under the blood glucose concentration curve (iAUC). Dashed lines denote female (n 7) and solid lines denote male (n 7) participants. Darker lines represent individuals with a BMI > 25 kg/m2 (n 4) and lighter lines denote those with a BMI < 25 kg/m2 (n 10). * Significant difference between control (CON) and protein (PRO) trials.
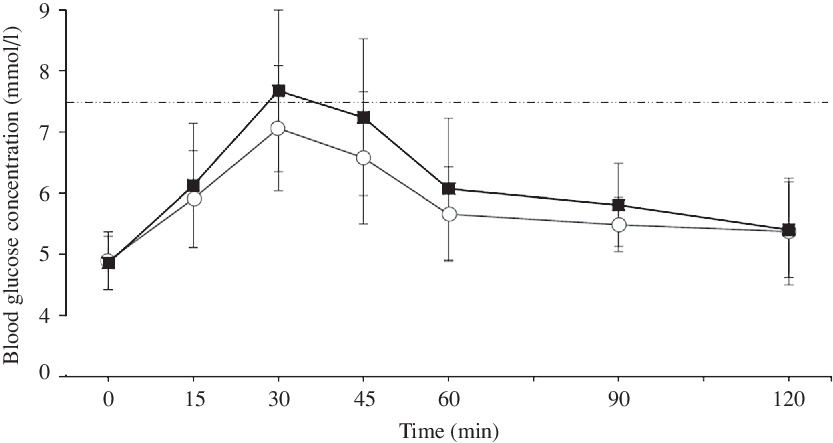
Fig. 4. Blood glucose concentration following breakfast ingestion at 0 min. The dashed line represents a blood glucose concentration of 7·5 mmol/l as a reference threshold. ![]() , Control;
, Control; ![]() , protein.
, protein.
Substrate utilisation, RER and energy expenditure
Lipid oxidation was 30·8 % greater at pre-breakfast (following intervention but prior to the test meal) in the PRO trial compared with CON (P = 0·045) (Table 1). There were no significant differences between conditions at pre-breakfast for RER, CHO oxidation or energy expenditure. Mean responses over the 120-min post-prandial period did not differ between conditions for RER, CHO oxidation or lipid oxidation. Post-prandial energy expenditure was greater in the PRO trial (P = 0·018).
Table 1. Pre-breakfast and post-prandial (120 min) values for substrate utilisation, RER and energy expenditure at pre-breakfast (n 13) due to difficulties associated with expired air collection
(Mean values and standard deviations)

CHO, carbohydrate.
* Significant difference between control and protein.
Subjective appetite and energy intake
There were no significant differences in any appetite ratings or combined appetite score at pre-breakfast (all P > 0·05, Table 2). There was a main effect of time (P < 0·001, F = 11·411), but neither treatment (P = 0·674, F = 0·185) nor treatment × time interaction (P = 0·681, F = 0·222) for post-prandial combined appetite score. Further, there was a main effect of time (P < 0·03), but neither treatment nor treatment × time interaction (all P > 0·05), for hunger, fullness, satisfaction and prospective consumption during the post-prandial period. There was no difference in volitional energy intake (P = 0·736) in CON (7230 (sd 2849) kJ) compared with PRO (6971 (sd 3205) kJ).
Table 2. Pre-breakfast (0 min) and post-prandial (60, 120 min) subjective appetite responses*
(Mean values and standard deviations)
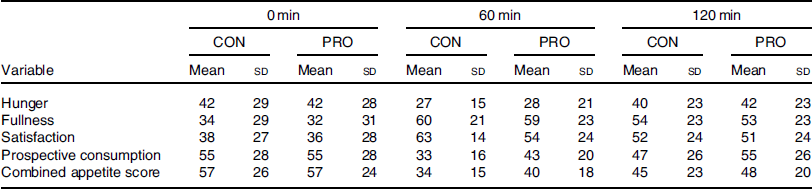
CON, control; PRO, protein.
* All variables demonstrated a main effect of time (P < 0·03).
Sleep quantity and quality
There was no difference in self-reported sleep quantity between conditions (450 (sd 52) v. 444 (sd 52) min, P = 0·788). Reductions >10 mm were observed in the sleep quality measures of wakefulness (15 mm) and calmness (12 mm) in the PRO v. CON condition. However, there was no correlation between the difference in iAUC between conditions and the change in sleep wakefulness (r 0·017, P = 0·953) or calmness (r 0·176, P = 0·546) between trials.
Discussion
This is the first study to investigate nocturnal protein ingestion in relation to the second-meal effect at breakfast. Contrary to our hypothesis, the primary findings demonstrate impaired post-prandial glucose tolerance at breakfast after nocturnal protein ingestion, evidenced by the increased glycaemic response (iAUC) and peak blood glucose concentrations. Pre-breakfast (fasted) lipid oxidation was also elevated following protein ingestion, whilst post-prandial after breakfast energy expenditure was higher. There was no difference in appetite or volitional energy intake between conditions. These findings illustrate that protein elicited a response opposite to the second-meal effect, impairing sequential glucose tolerance, with no effect on appetite or energy intake. This is the opposite response to that reported in the available literature regarding daytime meals during waking hours(Reference Ando, Nakae and Usui15,Reference Liljeberg, Åkerberg and Björck16,Reference Wolever, Bentum-Williams and Jenkins18,Reference Akhavan, Luhovyy and Brown20) .
The differences in glucose tolerance observed in the present study may be due to the 63 g dose of protein, as the majority of studies demonstrating a beneficial effect of a protein pre-load have used doses in the range of 10–55 g(Reference Abou-Samra, Keersmaekers and Brienza19–Reference Ma, Stevens and Cukier21). Further, previous studies have most commonly utilised a protein pre-load 30 min prior to the second meal(Reference Abou-Samra, Keersmaekers and Brienza19–Reference Ma, Stevens and Cukier21), which differs from 5 h 39 min separating meals in the present study. Although both Meng et al. (Reference Meng, Matthan and Ausman24) and Park et al. (Reference Park, Heden and Liu25) demonstrated that protein stimulates the second-meal effect with 4 h separating meals, both studies used high-protein breakfast foods, rather than the addition of whey protein used in the aforementioned pre-load studies(Reference Abou-Samra, Keersmaekers and Brienza19–Reference Ma, Stevens and Cukier21). Moreover, these studies were conducted in adults with type 2 diabetes(Reference Park, Heden and Liu25) and post-menopausal women(Reference Meng, Matthan and Ausman24). Regarding appetite, our results support the findings of Allerton et al. (Reference Allerton, Campbell and Gonzalez28), which also reported no attenuation in appetite when whey protein was added to breakfast(Reference Allerton, Campbell and Gonzalez28) ingested with a longer duration (i.e. 3 h) between meals than used in other pre-load studies(Reference Abou-Samra, Keersmaekers and Brienza19–Reference Ma, Stevens and Cukier21).
Protein ingestion in excess of physiological needs can stimulate ureagenesis and the use of glucogenic amino acids in gluconeogenesis(Reference Schutz40). Boden & Tappy(Reference Boden and Tappy41) demonstrated the hyperaminoacidaemia following protein ingestion stimulated endogenous glucose production despite hyperinsulinaemia. Studies employing stable isotope methodologies have demonstrated approximately 17–19 % of protein ingested is converted to glucose(Reference Fromentin, Tomé and Nau42,Reference Khan, Gannon and Nuttall43) . Therefore, assuming similar rates in the present study, it could be hypothesised that 17–19 % of the 63 g protein ingested in the present study resulted in glucose production, producing 10·7–12·0 g glucose. This is supported by the findings of Ang et al. (Reference Ang, Bruce and Kowalski44), who demonstrated that a 75 g of whey protein dose resulted in 11 g endogenous glucose production. Fromentin et al. (Reference Fromentin, Tomé and Nau42) state that the percentage of dietary amino acids converted to glucose was mainly related to the provision of glucogenic amino acids. The whey protein utilised in the present study comprised 79·8/100 g glucogenic or mixed amino acids (Fig. 2), providing a high availability of gluconeogenic precursors. In addition, the relative lack of other sources of gluconeogenic precursors (glycerol, pyruvate and lactate) in our whey protein solution, comparative to egg(Reference Fromentin, Tomé and Nau42) or cottage cheese(Reference Khan, Gannon and Nuttall43), may have further increased the contribution of amino acids to gluconeogenesis. Hence, glucose production may have been at the higher end of this estimate.
There are multiple underlying mechanisms through which the above-reasoned endogenous glucose production could alter glucose control following breakfast. Firstly, it may be that there was still some residual endogenous glucose production from the nocturnal protein by the time breakfast was ingested. Indeed, Ang et al. (Reference Ang, Bruce and Kowalski44) reported that endogenous glucose production was still elevated at 4 h following whey protein ingestion, which could therefore supplement the carbohydrate directly ingested at breakfast and thus explain the elevated post-prandial glycaemia in the PRO condition. It should be noted, however, that the breakfast in the present study was provided almost 6 h following the protein dose, so the contribution of the ingested protein towards endogenous glucose production may have subsided by the time of the second delivery of ingested nutrients.
Secondly, any glucose generated from the ingested amino acids even prior to breakfast could still contribute to a more positive carbohydrate balance (i.e. increased glycogen availability) and thus potentially limit the capacity for further non-oxidative carbohydrate disposal at breakfast. Certainly, the 10–12 g of glucose that would theoretically arise via gluconeogenesis from the ingested protein could make a meaningful contribution towards the total capacity for hepatic glycogen stores. The present study employed a somewhat unusual protocol in that a large provision of energy was delivered at an atypical time of day when neither required nor expected by the body. Overnight fasting depletes hepatic glycogen stores and stimulates gluconeogenesis(Reference Ahlborg, Felig and Hagenfeldt45,Reference Gonzalez, Fuchs and Betts46) , hence the liver may have been more sensitive to the large protein dose ingested during the night. It is unlikely that any large proportion of glucose produced would be oxidised in this rested and fasted state and therefore is more likely to be stored, increasing hepatic glycogen stores. An increase in glycogen stores may reduce the liver’s capacity for first pass extraction following breakfast, reducing hepatic glucose uptake and resulting in more glucose remaining in circulation(Reference Jensen, Rustad and Kolnes47). In the present study, the mean time between protein ingestion and breakfast was 5 h 39 min. Peak liver glycogen concentration is achieved approximately 5 h post-prandially(Reference Gonzalez, Fuchs and Betts46); therefore, it is possible this peak may have coincided with breakfast, reducing the capacity for first pass extraction. However, rather than liver glycogen storage, the primary driver of post-prandial glucose tolerance is thought to be insulin-stimulated glucose uptake into peripheral tissues and the synthesis of skeletal muscle glycogen(Reference Meyer, Dostou and Welle48,Reference Jackson, Roshania and Hawa49) , yet 10–12 g of newly synthesised glucose would represent a much smaller contribution to whole-body muscle glycogen reserves and thus less likely to impair skeletal muscle glucose uptake at breakfast. The present results regarding glycaemic control therefore warrant future studies to examine such mechanisms by measuring glucose synthesis/disposal, along with muscle and liver glycogen concentrations.
The time of feeding in the present study may also have impacted gluconeogenesis and insulin sensitivity. Protein was fed at a time when the relative concentrations of both glucagon and cortisol were increasing. Elevated glucagon concentration stimulates hepatic gluconeogenesis and amino acid uptake(Reference Bodo and Altszuler50,Reference Frayn51) , while cortisol also stimulates hepatic gluconeogenesis, alongside reducing insulin sensitivity(Reference Bodo and Altszuler50). Betts et al. (Reference Betts, Beelen and Stokes52) demonstrated that the overnight cortisol response is elevated following the co-ingestion of protein with CHO before bed. Thus, the protein ingestion in the present study may have augmented the natural circadian elevation in cortisol thus reducing insulin sensitivity. There is also evidence for circadian rhythmicity in circulating amino acids, with lowest concentrations between 04.00 and 08.00 hours(Reference Feigin, Klainer and Beisel53,Reference Feigin, Klainer and Beisel54) . Feigin et al. (Reference Feigin, Klainer and Beisel54) demonstrated that the ingestion of a large protein bolus at 08.00 hours resulted in an additional increase in blood amino acid concentrations, exceeding that anticipated from typical circadian periodicity, an interference not replicated with an identical protein load consumed at 20.00 hours. This further supports the idea that the body may not be entrained to deal with a large bolus protein dose at the time of feeding in the present study. Finally, whey protein ingestion and an increase in plasma branched-chain amino acids, particularly leucine, have also been demonstrated to impair insulin sensitivity directly, especially in high doses(Reference Smith, Yoshino and Stromsdorfer55–Reference Flakoll, Wentzel and Rice57). The high branched-chain amino acid (22·6/100 g) and specifically leucine content (10·6/100 g) of the whey protein (Fig. 2) may therefore have impaired glucose uptake via that mechanism. As such, any priming effect of insulin secretion following protein ingestion may have been insufficient to overcome this reduced insulin sensitivity at breakfast. Therefore, the arrival of a large dose of amino acids at an atypical time of day might, via the hypothesised influence on hepatic gluconeogenesis and insulin sensitivity, result in impaired glucose control upon waking in a manner specific to this time frame. This further highlights the novel nature of the present study employing an atypical feeding time. Additional study is warranted to investigate if the glucose tolerance to a second meal is impaired following protein ingestion prior to other daily meals in a more ‘conventional’ feeding pattern.
Pre-breakfast lipid oxidation was elevated in the PRO trial, and post-prandial energy expenditure was also then higher. It should be noted, however, that these calculations were not adjusted based on 24-h nitrogen excretion and so assume negligible protein oxidation, which may not be a valid assumption in this experiment(Reference Frayn37). Witard et al. (Reference Witard, Jackman and Breen58) reported that ingesting 40 g whey protein isolate stimulates phenylalanine oxidation for 4 h, so the 63 g ingested in the present study is likely to have stimulated a similar response, although this may have reduced by the time measurements were made 6 h later at breakfast. Nonetheless, if protein undergoes gluconeogenesis and is oxidised, then the RQ for that process is approximately 0·8 (the same as for direct protein oxidation), whereas the RQ if the newly synthesised glucose is stored is 0·4(Reference Jéquier, Acheson and Schutz59). Any persistent protein oxidation or gluconeogenesis 6 h after the nocturnal bolus would therefore be expected to slightly reduce the whole-body RER based on measured oxygen uptake and carbon dioxide production. However, the fact that the RER under both conditions were very similar and in the range of 0·85–0·89 means any such difference is likely to be small and thus it remains a reasonable alternative explanation that the ingested protein did in fact increase lipid oxidation.
In conclusion, consumption of a whey protein solution during the night impaired post-prandial glucose control at breakfast, whilst increasing post-prandial energy expenditure, with no effect on satiety or energy intake. As such, this approach would not be recommended to improve post-prandial glucose control following breakfast. This paradoxical second-meal phenomenon may relate to an influence of protein oxidation on the availability of hepatic and/or skeletal muscle glycogen and/or insulin sensitivity.
Acknowledgements
The authors thank those who participated in the study for their time and commitment, alongside the University of Bath for supporting this research.
This research received no specific grant from any funding agency, commercial or not-for-profit sectors.
J. A. B. and J. T. G. formulated the research question, E. S. S., E. A., K. C., J. H., G. P., J. T. G. and J. A. B. designed the study, E. S. S., E. A., K. C., J. H. and G. P. collected the data, E. S. S. analysed the data, E. S. S., H. A. S., J. T. G. and J. A. B. contributed to writing the manuscript and all authors approved the final version of the manuscript.
E. S. S., E. A., K. C., J. H., G. P. and H. A. S. declare no conflict of interest. J. T. G. has received research funding and/or has acted as a consultant for Arla Foods Ingredients, Lucozade Ribena Suntory, Kenniscentrum Suiker and Voeding, and PepsiCo. J. A. B. has received research funding and/or has acted as a consultant for GlaxoSmithKline, Lucozade Ribena Suntory, Kellogg’s, Nestlé and PepsiCo.


