


Non-alcoholic fatty liver disease (NAFLD) is the most common form of chronic liver disease in developing countries. The clinical/pathological spectrum of NAFLD includes manifestations such as simple steatosis, steatohepatitis, cirrhosis and hepatocellular carcinoma(Reference Chalasani, Younossi and Lavine1). A recent meta-analysis including data from twenty-two countries reported a NAFLD prevalence among adults of 25 %. Notably, almost half of adults with NAFLD had obesity, thus highlighting the association between NAFLD and excess body weight(Reference Younossi, Koenig and Abdelatif2,Reference Vernon, Baranova and Younossi3) . In Chile, the prevalence of NAFLD is unknown. But the last National Health Survey revealed that 74 % of the population has excess body weight(4). These data suggest that NAFLD prevalence in Chile may be similar – or even higher – than the prevalence reported in other countries. Three studies have shed light on the prevalence of NAFLD in Chile. Boza et al. (Reference Boza, Riquelme and Ibañez5) found that 63 % of patients with obesity undergoing gastric bypass had NAFLD diagnosed by liver biopsy. Riquelme et al. (Reference Riquelme, Arrese and Soza6) found that 23 % out of 832 adults (23 % of them with obesity) had NAFLD diagnosed by ultrasound in an urban area of Santiago. And recently, Ferreccio et al. (Reference Ferreccio, Huidobro and Cortés7) found a 47 % prevalence (by ultrasound) among adults participating in a cohort study of a rural population. Although these studies provide some idea about NAFLD prevalence, the samples are not representative of the population in Chile.
The liver biopsy is the gold standard to diagnose NAFLD. The biopsy allows distinguishing the different manifestations of NAFLD. Nevertheless, liver biopsy cannot be used in population-based studies because it is invasive and expensive(Reference Vernon, Baranova and Younossi3,Reference Machado and Cortez-Pinto8–Reference Berger, Desai and Janardhan10) . And although ultrasound and other image-based methods (e.g. MRI) appear as an alternative, they are neither applicable for population-based studies. To overcome these limitations, non-invasive indirect methods have been developed based on simple markers(Reference Machado and Cortez-Pinto8). The fatty liver index (FLI)(Reference Bedogni, Bellentani and Miglioli11) and the lipid accumulation product (LAP)(Reference Bedogni, Kahn and Bellentani12) are two of these methods. Both methods were developed using ultrasonography in the general population of Northern Italy. FLI was derived from analyses of 496 individuals (61 % males) aged 18–75 years(Reference Bedogni, Bellentani and Miglioli11), whereas LAP from 588 individuals (59 % males) aged 21–79 years(Reference Bedogni, Kahn and Bellentani12). FLI considers as markers the BMI, waist circumference and the circulating concentrations of γ-glutamyl-transferase and TAG. FLI showed an accuracy (area under ROC curve (95 % confidence interval)) of 0·84 (0·81, 0·87) for detecting simple steatosis(Reference Bedogni, Bellentani and Miglioli11). LAP considers as markers the sex, waist circumference and the circulating concentration of TAG. LAP showed an OR of 4·28 (95% CI 3·28, 5·58) for distinguishing severe from non-severe steatosis(Reference Bedogni, Kahn and Bellentani12). The usefulness of FLI and LAP has been subsequently confirmed in other samples by using liver biopsies(Reference Fedchuk, Nascimbeni and Pais13,Reference Garteiser, Castera and Coupaye14) , proton magnetic resonance spectroscopy(Reference Cuthbertson, Weickert and Lythgoe15,Reference Bozkurt, Göbl and Tura16) or ultrasound(Reference Foschi, Conti and Domenicali17).
Lifestyle habits – including diet, sedentary behaviour and physical activity – play a key role in the development and progression of NAFLD(18–Reference Rinella, Tacke and Sanyal20). The Mediterranean diet is characterised by a high intake of olive oil, nuts, fruits, vegetables, whole grains, legumes and fish; moderate consumption of wine and dairy and low intake of red meat, processed foods and sugary foods(Reference Romero-Gómez, Zelber-Sagi and Trenell21). This dietary pattern has been shown to reduce liver steatosis even in the absence of weight loss(Reference Bozzetto, Prinster and Annuzzi22,Reference Trovato, Catalano and Martines23) . Time on sedentary behaviour has been directly associated – whereas overall activity has been inversely associated – with liver fat percentage independently of BMI(Reference Bowden Davies, Sprung and Norman24). Together, this evidence highlights the influence of these lifestyle habits on NAFLD. And notably, engaging in these lifestyle habits usually decreases body weight, thus providing additional benefits against NAFLD(Reference Vilar-Gomez, Martinez-Perez and Calzadilla-Bertot25,Reference Fernández, Viñuela and Vidal26) . Yet the association between these – and other – lifestyle habits with the presence of NAFLD at a population level has not been tested.
Therefore, using a nationally representative sample of adults in Chile, we aimed to (a) estimate the prevalence of NAFLD using FLI, LAP or their combination and (b) determine the association between the presence of NAFLD and lifestyle habits.
Methods
Database
This research used data from the Surveys of Health for epidemiologic surveillance by the Public Health Subsecretary of Chile, but our findings do not compromise such an Institution. The protocols and written informed consent for the National Health Survey of Chile 2016–2017 were approved by the Scientific Ethics Committee of the Faculty of Medicine of Pontificia Universidad Católica de Chile (CEC-MedUC, project number 16–019) and were in accordance with the Declaration of Helsinki. All individuals signed a written informed consent before participating.
The current report followed the STROBE-nut guidelines, whose checklist is presented in online Supplementary Table 1. We analysed the data of the National Health Survey of Chile 2016–2017 conducted between August 2016 and March 2017. The methodological details of the survey have been published elsewhere(4). It was a cross-sectional household survey that included 6233 participants who were ≥ 15 years old. The sampling method was stratified (thirty strata representing urban and rural areas of fifteen geographical regions) and multistage (counties as primary sampling units, then households and finally one participant per household). Sampling weights accounted for differences in selection probability and non-response rates, and post-stratification adjustments allowed expanding the sample to the population in Chile. For our current analyses, the following eligibility criteria were considered: (a) 21 to 75 years old; (b) absence of hepatitis B, hepatitis C, human immunodeficiency virus, acquired immunodeficiency syndrome, syphilis, chancre and gonorrhoea; (c) alcohol consumption < 20 g/d for women or < 30 g/d for men, calculated using the frequency of consumption (d/week) and the number of drinks consumed (beverages/d) obtained from the Alcohol Use Disorders Identification Test(Reference Monteiro27), and assuming 14 g of alcohol per beverage(28); and (d) complete data for the variables used to compute FLI and LAP. Online Supplementary Fig. 1(a) shows the flow diagram for the selection of participants.
Identification of non-alcoholic fatty liver disease
We used three indirect methods to identify participants with NAFLD: FLI(Reference Bedogni, Bellentani and Miglioli11), LAP(Reference Bedogni, Kahn and Bellentani12) and their combination. The indexes were calculated as follows:
 $${\rm{FLI}} = {{{\rm{EX}}{{\rm{P}}^{0 \cdot 953\; \times \;{\rm{ln}}\left( {{\rm{TAG}}} \right)\; + \;0 \cdot 139\; \times \;{\rm{BMI}}\; + \;0 \cdot 718\; \times \;{\rm{ln}}\left( {{\rm{GGT}}} \right)\; + \;0 \cdot 053\; \times \;{\rm{WC}}\; - \;15 \cdot 745}}} \over {1 + \;{\rm{EX}}{{\rm{P}}^{0 \cdot 953\; \times \;{\rm{ln}}\left( {{\rm{TAG}}} \right)\; + \;0 \cdot 139\; \times \;{\rm{BMI}}\; + \;0 \cdot 718\; \times \;{\rm{ln}}\left( {{\rm{GGT}}} \right)\; + \;0 \cdot 053\; \times \;{\rm{WC}}\; - \;15 \cdot 745}}}} \times 100$$
 $${\rm{LAP\;in\;women\;}} = \ln (\left( {{\rm{WC\;}} - {\rm{\;}}58} \right){\rm{\;}} \times {\rm{\;TAG}})$$
 $${\rm{LAP\;in\;men\;}} = \ln (\left( {{\rm{WC}} - {\rm{\;}}65} \right){\rm{\;}} \times {\rm{\;TAG}})$$
where TAG is the circulating concentration of TAG in mM; BMI is the body mass index in kg/m2; GGT is the circulating concentration of γ-glutamyl-transferase in μg/l; and WC is the waist circumference in centimetres. Using FLI, participants were grouped as: ‘no’ NAFLD (FLI < 30), ‘inconclusive’ (FLI from 30 to < 60) or ‘yes’ NAFLD (FLI ≥ 60)(Reference Bedogni, Bellentani and Miglioli11). Using LAP, participants were grouped as: ‘no/moderate’ NAFLD (LAP < 4·4 for women; LAP < 4·0 for men) or ‘severe’ NAFLD (LAP ≥ 4·4 for women; LAP ≥ 4·0 for men)(Reference Bedogni, Kahn and Bellentani12). Finally, participants were grouped considering simultaneously their groups of FLI and LAP as: ‘no and no/moderate’ for participants classified as ‘no’ NAFLD by FLI and ‘no/moderate’ NAFLD by LAP; ‘yes and severe’ for participants classified as ‘yes’ NAFLD by FLI and ‘severe’ NAFLD by LAP; or ‘other’ for participants with any other combination of categories by FLI and LAP. Online Supplementary Fig. 1(b) shows the unweighted number of participants within each group.
Blood samples, anthropometry, education and lifestyle habits
Trained nurses obtained the blood samples and anthropometric measurements, as described elsewhere(4). Education was categorised as: < 8 years, 8–12 years or > 12 years of education. Nutritional status was categorised according to BMI as: underweight (< 18·5 kg/m2), normal weight (18·5 to < 25 kg/m2), overweight (25 to < 30 kg/m2), obesity (30 to < 40 kg/m2) or morbid obesity (≥ 40 kg/m2).
Lifestyle habits were obtained by questionnaires. Smoking habits were estimated using a single question with the following alternatives: ≥1 cigarette/d, < 1 cigarette/d, former or never. The Global Physical Activity Questionnaire was used to estimate the level of moderate-vigorous physical activity (in MET×min/week) and sedentary behaviour (in h/d)(Reference Armstrong and Bull29,Reference Fernández-Verdejo and Suárez-Reyes30) ; these variables were categorised into quartiles. The consumption of fruits and vegetables was estimated based on four questions about (a) the weekly frequency of consumption of fruits; (b) the number of 80-g portions of fruits consumed per consumption day; (c) the weekly frequency of consumption of vegetables and (d) the number of 80-g portions of vegetables consumed per consumption day. Then, we calculated the consumption of fruits and vegetables as portions (80 g) consumed in a standard week, and the results were categorised into quartiles. Consumption of fish and seafood was estimated using a single question about the frequency of consumption that included the following alternatives: < 1 time/month, 1–< 3 times/month, 4 times/month or > 4 times/month. Consumption of dairy products was estimated using a single question about the frequency of consumption of either milk, cheese or yogurt, which included seven alternatives. For simplicity, we combined the alternatives to categorise the results as: ≤ 1 times/week, >2 to ≤ 7 times/week or > 7 times/week. Consumption of whole grains was estimated using a single question about the frequency of consumption of either wholemeal bread, whole-grain cereals or whole-wheat flour, which included six alternatives. For simplicity, we combined the alternatives to categorise the results as: never, < 2 times/week or ≥3 times/week. Finally, consumption of legumes was estimated using a single question about the frequency of consumption of either beans, lentils, peas or chickpeas, which included the following alternatives: never, <1 time/month, 1 to 3 times/month, 4 times/month or > 4 times/month. Participants with missing data for a certain lifestyle habit were excluded from the analyses encompassing that lifestyle habit.
Statistical analyses
We detected and excluded extreme outliers from continuous variables by setting upper (Q3 + 3 × (Q3 – Q1)) and lower (Q1 – 3 × (Q3 – Q1)) limits, as previously done(4,Reference Fernández-Verdejo and Suárez-Reyes30,Reference Fernández-Verdejo, Moya-Osorio and Fuentes-López31) . Data for continuous variables were expressed as mean (95 % CI). Linear regression models were used to compare continuous (dependent) variables between the groups (independent variables) by FLI (‘no’ v. ‘inconclusive’ v. ‘yes’), LAP (‘no/moderate’ v. ‘severe’) or their combination (‘no and no/moderate’ v. ‘other’ v. ‘yes and severe’). Bonferroni was used to adjust for multiple comparisons. Data for categorical variables were expressed as percentage (95 % CI). Pearson χ 2 was used to test the unadjusted association between categorical variables and the groups by FLI, LAP or their combination.
Logistic regression models were used to compute the OR (95 % CI) for the adjusted association between lifestyle habits and the groups by FLI, LAP or their combination. The outcome variable was the group, considering as the reference ‘no’ NAFLD for FLI, ‘no/moderate’ NAFLD for LAP and ‘no and no/moderate’ NAFLD for the combination of FLI and LAP. Lifestyle habits were the exposure variables, considering as reference the unhealthiest category. Age, sex, BMI (in kg/m2) and education were different between groups by FLI, LAP and their combination (see Results section and Table 1) and were thus included as confounders in the regression models.
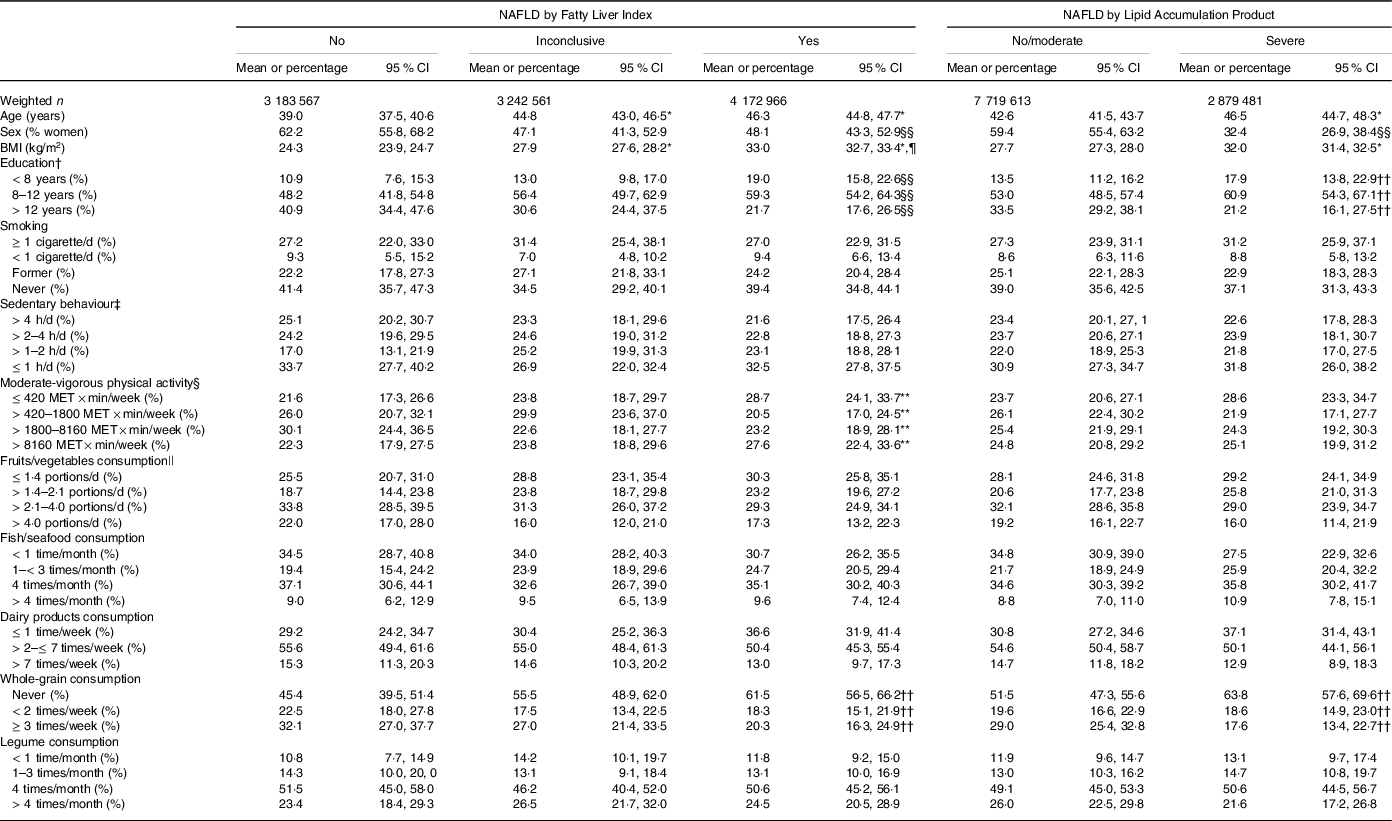
Table 1. Characteristics of the participants according to the index of non-alcoholic fatty liver disease (NAFLD)
* P < 0·001 v. No, or No/moderate.
† 20 participants excluded in the unweighted sample.
‡ 131 participants excluded in the unweighted sample.
§ 158 participants excluded in the unweighted sample.
|| 22 participants excluded in the unweighted sample; portions of 80 g.
¶ P < 0·001 v. Inconclusive.
** P < 0·05 for different proportions between groups.
†† P < 0·01 for different proportions between groups.
§§ P < 0·001 for different proportions between groups.
The complex samples module of IBM SPSS Statistics version 26 was used for analyses. Analyses were unconditional, thus including all the survey’s participants (n 6233), but considering our final sample as a subpopulation. Sampling weights were applied to account for the survey’s sampling method. P < 0·05 was considered statistically significant.
Results
A final sample of 2744 participants was included in the analyses (online Supplementary Fig. 1(a)). After applying sample weights, they represented an estimated (95 % CI) of 10 599 094 (9 831 644, 11 366 544) adults in Chile.
Prevalence of non-alcoholic fatty liver disease
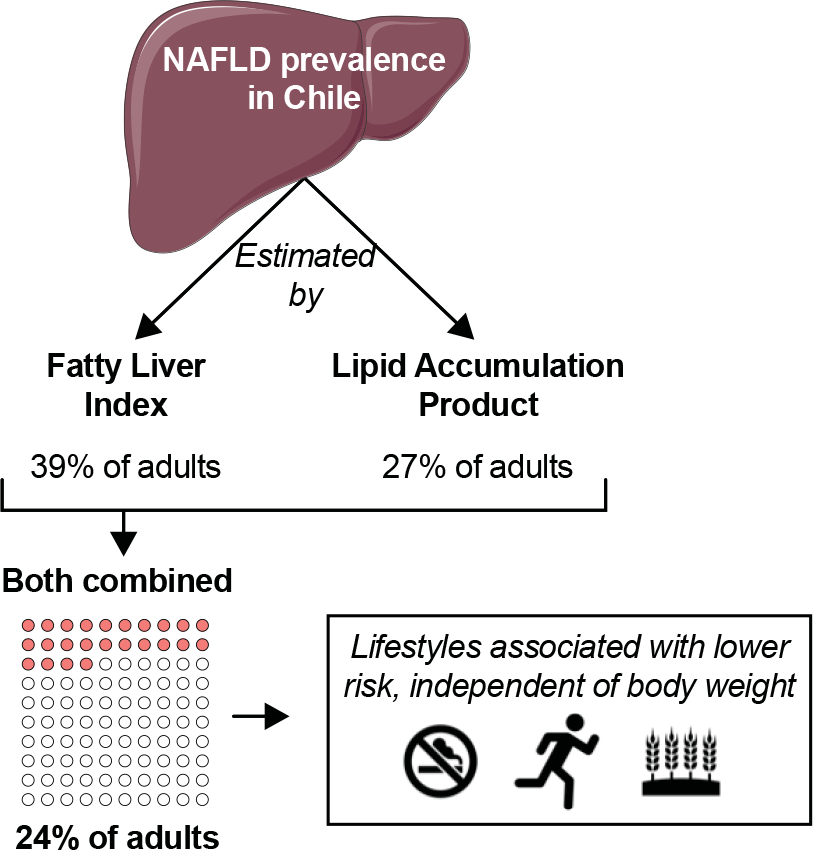
By FLI, the prevalence of ‘yes’ NAFLD was 39·4 % (36·2, 42·8), representing an estimated of 4 172 966 (3 715 044, 4 630 886) adults. The prevalence increased progressively from underweight (0 %) to morbid obesity (100 %; Fig. 1(a)). By LAP, the prevalence of ‘severe’ NAFLD was 27·2 % (24·2, 30·4), representing an estimated of 2 879 481 (2 511 701, 3 247 259) adults. The prevalence also increased progressively from underweight (0 %) to morbid obesity (69 %; Fig. 1(b)). When FLI and LAP were considered simultaneously, the prevalence of ‘yes and severe’ NAFLD was 23·5 % (20·7, 26·5), representing an estimated of 2 486 480 (2 155 818, 2 817 140) adults. Also, the prevalence increased from underweight (0 %) to morbid obesity (69 %; Fig. 1(c)).
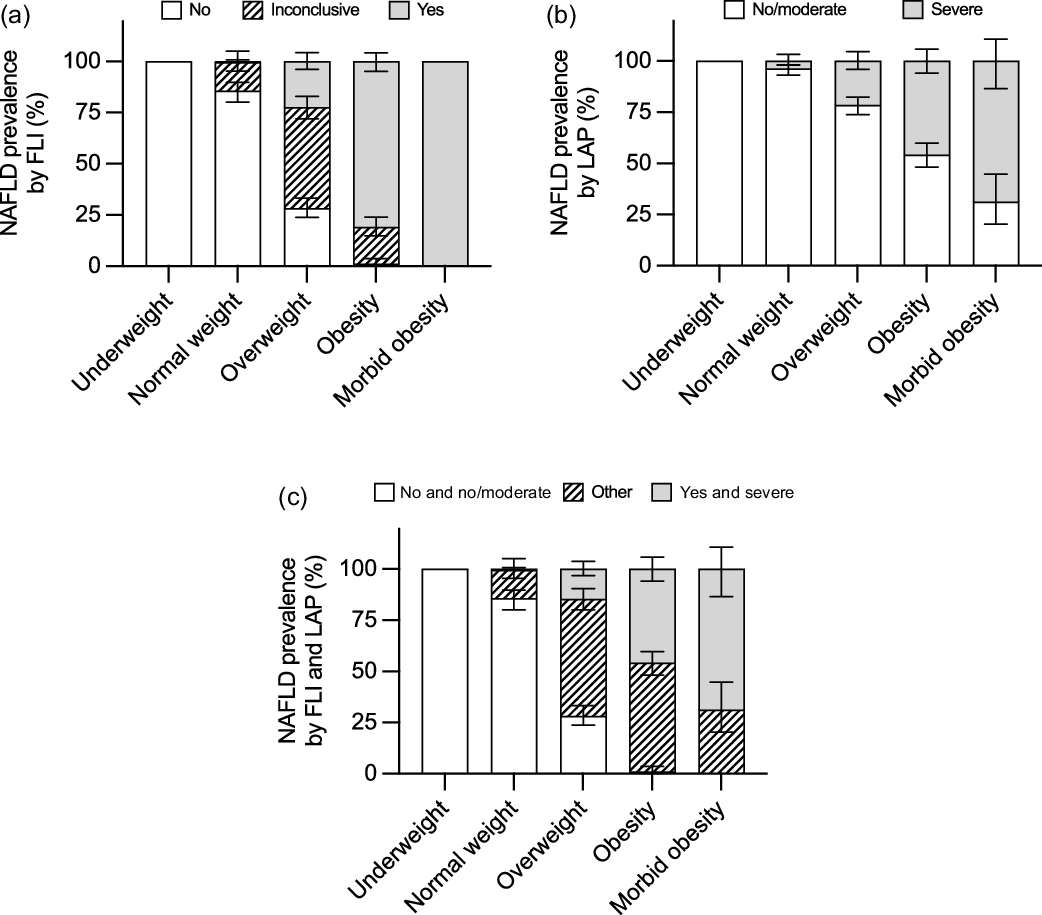
Fig. 1. Prevalence of non-alcoholic fatty liver disease (NAFLD) by nutritional status. NAFLD categories were estimated by the (a) fatty liver index (FLI), (b) lipid accumulation product (LAP) or (c) their combination.
Association of the presence of non-alcoholic fatty liver disease by fatty liver index or lipid accumulation product v. lifestyle habits
Table 1 shows the main characteristics of the participants grouped according to FLI or LAP. Considering the groups by FLI, participants with ‘yes’ NAFLD (v. ‘no’) were older, had higher BMI and had a lower proportion of women and of people with > 12 years of education. Similarly, considering the groups by LAP, participants with ‘severe’ NAFLD (v. ‘no/moderate’) were older, had higher BMI and had a lower proportion of women and of people with >12 years of education. There was an association between the groups by FLI and moderate-vigorous physical activity; a larger proportion of participants with ‘yes’ NAFLD (v. ‘no’) reported low (first quartile) moderate-vigorous physical activity. The groups by FLI and the groups by LAP were associated with whole-grain consumption; a larger proportion of participants with ‘yes’ NAFLD (v. ‘no’) or with ‘severe’ NAFLD (v. ‘no/moderate’) reported never consuming whole grains.
Fig. 2(a) shows the OR (95 % CI) of having ‘yes’ NAFLD by FLI for the different categories of lifestyle habits (models adjusted for age, sex, BMI (in kg/m2) and education). Compared with participants who smoked ≥1 cigarette/d, lower odds of ‘yes’ NAFLD were observed in those who smoked < 1 cigarette/d (0·20 (0·05, 0·72)), former smokers (0·15 (0·07, 0·35)) and never smokers (0·30 (0·15, 0·63)). Lower odds of ‘yes’ NAFLD were also observed in participants in the third quartile of moderate-vigorous physical activity (0·34 (0·16, 0·73)), those who consumed whole-grains (< 2 times/week: 0·40 (0·18, 0·84); ≥ 3 times/week: 0·48 (0·24, 0·97)) and those who consumed legumes 4 times/month (0·39 (0·17, 0·91)). Similar patterns were observed for moderate-vigorous physical activity and whole-grain consumption in unadjusted models (online Supplementary Table 2). Finally, smoking less and whole grain consumption were also associated with lower odds of having ‘inconclusive’ NAFLD (online Supplementary Table 3).
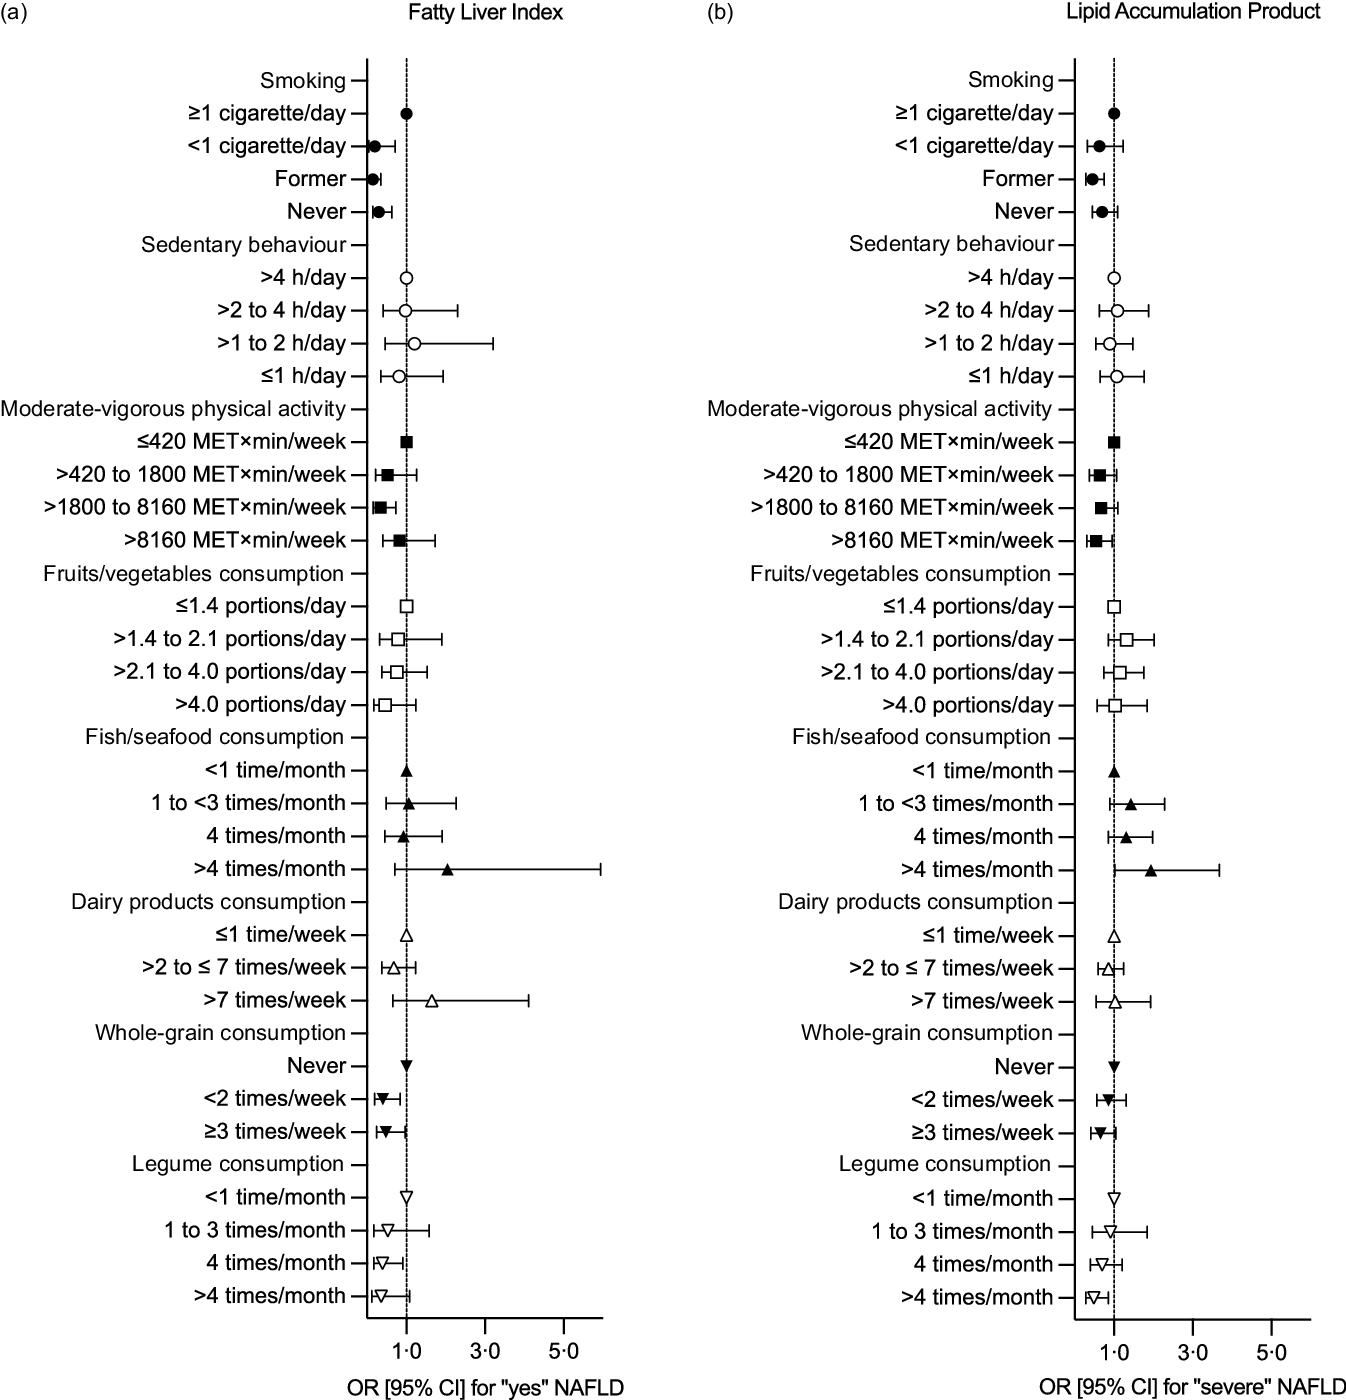
Fig. 2. Association between the presence of non-alcoholic fatty liver disease (NAFLD) and lifestyle habits. Data represent the OR (95 % CI) of having (a) ‘yes’ NAFLD according to fatty liver index or (b) ‘severe’ NAFLD according to lipid accumulation product. Models are adjusted for age, sex, BMI (in kg/m2) and education.
Figure 2(b) shows the OR (95 % CI) of having ‘severe’ NAFLD by LAP for the different categories of lifestyle habits (models adjusted for age, sex, BMI (in kg/m2) and education). Compared with participants who smoked ≥ 1 cigarette/d, former smokers had lower odds of ‘severe’ NAFLD (0·45 (0·28, 0·75)). Lower odds of ‘severe’ NAFLD were also observed in participants in the fourth quartile of moderate-vigorous physical activity (0·55 (0·31, 0·95)) and those who consumed legumes > 4 times/month (0·49 (0·28, 0·86)). In unadjusted models, whole-grain consumption was associated with lower odds of having ‘severe’ NAFLD, whereas consuming fish/seafood 1 to < 3 times/month associated with higher odds of having ‘severe’ NAFLD (online Supplementary Table 2).
Association of the presence of non-alcoholic fatty liver disease by a combination of fatty liver index and lipid accumulation product v. lifestyle habits
Table 2 shows the main characteristics of the participants grouped by considering simultaneously FLI and LAP. Participants with ‘yes and severe’ NAFLD (v. ‘no and no/moderate’) were older, had higher BMI and had a lower proportion of women and people with > 12 years of education. There was an association between the groups and whole-grain consumption; a larger proportion of participants with ‘yes and severe’ NAFLD (v. ‘no and no/moderate’) reported never consuming whole grains.
Table 2. Characteristics of the participants according to a combination of Fatty Liver Index (FLI) and Lipid Accumulation Product (LAP)
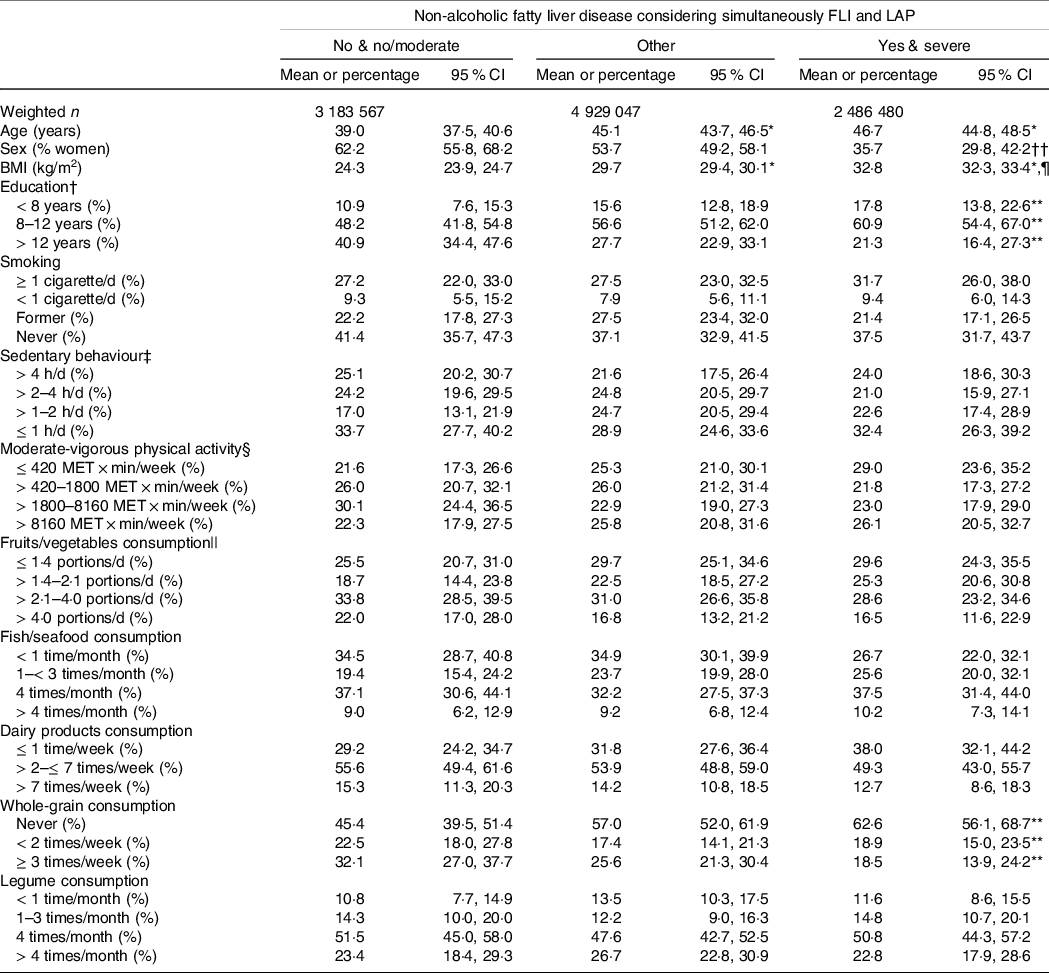
* P < 0·001 v. No and no/moderate.
† 20 participants excluded in the unweighted sample.
‡ 131 participants excluded in the unweighted sample.
§ 158 participants excluded in the unweighted sample.
|| 22 participants excluded in the unweighted sample; portions of 80 g.
¶ P < 0·001 v. Other.
** P < 0·01 for different proportions between groups.
†† P < 0.001 for different proportions between groups.
Figure 3 shows the OR (95 % CI) of having ‘yes and severe’ NAFLD by FLI and LAP for the different categories of lifestyle habits (models adjusted for age, sex, BMI (in kg/m2) and education). Compared with participants who smoked ≥ 1 cigarette/d, lower odds of ‘yes and severe’ NAFLD were observed in those who smoked < 1 cigarette/d (0·17 (0·05, 0·57)), former smokers (0·14 (0·07, 0·30)) and never smokers (0·29 (0·15, 0·59)). Lower odds of ‘yes and severe’ NAFLD were also observed in participants in the third quartile of moderate-vigorous physical activity (0·35 (0·17, 0·69)) and those who consumed whole grains < 2 times/week (0·46 (0·23, 0·94)). Similar patterns were observed for moderate-vigorous physical activity and whole-grain consumption in unadjusted models (online Supplementary Table 2). Unadjusted models also showed lower odds of ‘yes and severe’ NAFLD in participants consuming dairy products > 2 to ≤ 7 times/week and higher odds in participants consuming fish/seafood 1 to < 3 times/month (online Supplementary Table 2). Finally, smoking less, moderate-vigorous physical activity (third quartile) and whole-grain consumption were associated with lower odds of having ‘other’ combination of FLI and LAP (online Supplementary Table 3).
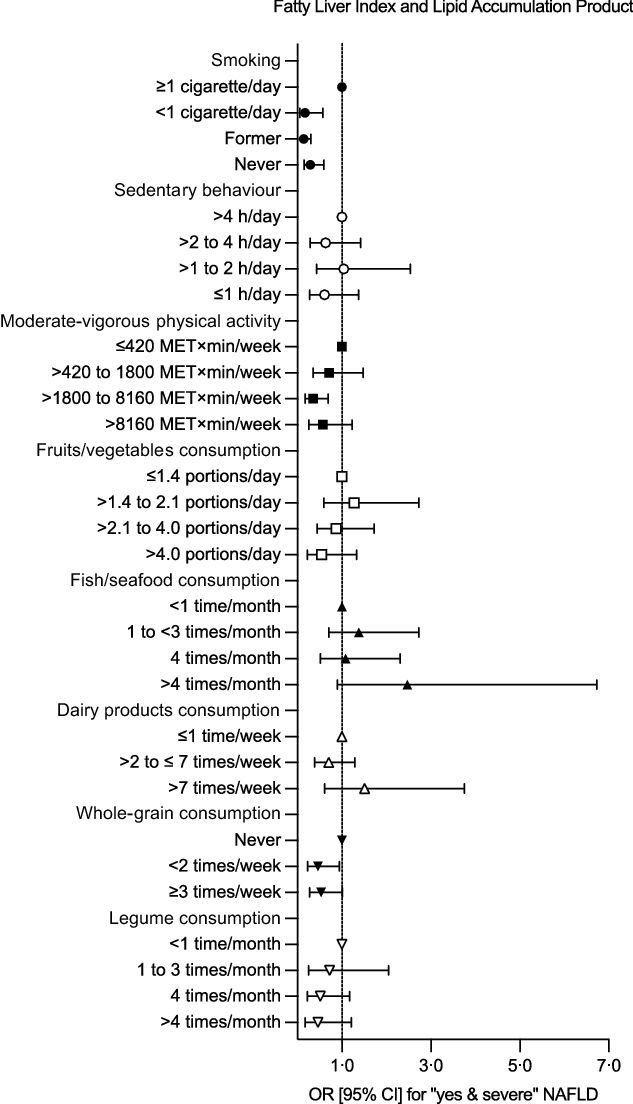
Fig. 3. Association between the presence of non-alcoholic fatty liver disease (NAFLD) and lifestyle habits. Data represent the OR (95 % CI) of having ‘yes and severe’ NAFLD according to a combination of fatty liver index and lipid accumulation product. Models are adjusted for age, sex, BMI (in kg/m2) and education.
Discussion
Herein, we estimated the prevalence of NAFLD in a nationally representative sample of adults in Chile by using non-invasive methods. NAFLD prevalence reached 39·4 % by FLIP and 27·2 % by LAP. Using both indexes simultaneously, which is a more conservative approach that reduces the risk of false positives, NAFLD prevalence reached 23·5 %. These results suggest that at least one out of four adults in Chile is afflicted with NAFLD. As previously reported, individuals with NAFLD were older, had a larger proportion of men(Reference Younossi, Koenig and Abdelatif2,Reference Talens, Tumas and Lazarus32,Reference Rietman, Sluik and Feskens33) and had less education(Reference Stroffolini, Sagnelli and Sagnelli34) than individuals without NAFLD. Moreover, NAFLD prevalence progressively increased with higher BMI, as shown before(Reference Sheka, Adeyi and Thompson35). We also determined the association between the presence of NAFLD and lifestyle habits at a population level. Less smoking, and more moderate-vigorous physical activity and whole-grain consumption were associated with lower odds of having NAFLD.
NAFLD is an important cause of liver-related mortality worldwide, even though < 10 % of patients develop cirrhotic complications and hepatocellular carcinoma(Reference Chrysavgis, Giannakodimos and Diamantopoulou36). In Chile, public health policies that potentially decrease NAFLD-related burden have been implemented, specifically focused on obesity, type 2 diabetes, hypertension, CVD, dyslipidaemia, cirrhosis and hepatocellular carcinoma. Nevertheless, similar to other countries in America, a national policy addressing NAFLD has not been adopted(Reference Díaz, Fuentes-López and Ayares37). The healthcare and economic burden of NAFLD in Chile have not been estimated. Since Chile has the highest prevalence of excess body weight among the OECD countries, a substantial economic burden is expected in the following years(Reference Younossi, Koenig and Abdelatif2,Reference Díaz, Fuentes-López and Ayares37–Reference Powell, Wong and Rinella40) . Indeed, obesity-related conditions are major risk factors for death and disability(Reference Vega-Salas, Caro and Johnson41), reducing the country’s Gross Domestic Product by 3·8 % per year(42).
Based on data from Colombia and Brazil, the prevalence of NAFLD in South America seems higher than elsewhere(Reference Younossi, Koenig and Abdelatif2,Reference Le, Yeo and Li43) . In Chile, NAFLD appears as the main cause of liver transplant and liver cancer(Reference Wolff, Díaz and Norero44). Until now, however, the prevalence of NAFLD in adults in Chile was unknown. Our current analyses are the first attempt to estimate such a prevalence at a population level. To that end, we took advantage of non-invasive methods, which help estimate disease risk in primary care in large groups of individuals. This estimation is essential to gauge the magnitude of the problem and to design effective strategies to prevent and treat NAFLD(Reference Singh, Le, Peerzada and Lopez9,18,Reference Powell, Wong and Rinella40) . In our more conservative estimations, 23·5 % of adults in Chile are afflicted by NAFLD. This estimation includes individuals classified as having – simultaneously – ‘yes’ simple steatosis by FLI and ‘severe’ steatosis by LAP. The actual prevalence of NAFLD is thus probably underestimated.
FLI and LAP have shown good performance in detecting liver steatosis. A recent meta-analysis (27 221 individuals, ≥ 18 years old) showed good agreement between NAFLD prevalence estimated by FLI v. transient elastography (47·6 % v. 48·1 %, respectively)(Reference Jones, Alvarez and Graubard45). Also, similar rates of NAFLD (26 %) have been detected by ultrasound, FLI or LAP among 2159 individuals(Reference Foschi, Conti and Domenicali17). Moreover, using liver biopsy as the reference, FLI showed a good diagnostic performance and adequate diagnostic accuracy for the presence of steatosis (AUROC 0·83 (IQR 0·72, 0·91))(Reference Fedchuk, Nascimbeni and Pais13,Reference Garteiser, Castera and Coupaye14) Using proton magnetic resonance spectroscopy as reference, FLI predicted the presence of steatosis with an AUROC of 0·79 (IQR = 0·74, 0·84), while LAP with 0·78 (IQR = 0·72, 0·83)(Reference Cuthbertson, Weickert and Lythgoe15,Reference Bozkurt, Göbl and Tura16) . Yet neither FLI nor LAP predicted liver fat quantitatively(Reference Fedchuk, Nascimbeni and Pais13–Reference Cuthbertson, Weickert and Lythgoe15). Another study using ultrasound showed that FLI and LAP appeared acceptable for NAFLD diagnosis, with AUROC of 0·77 (IQR = 0·75, 0·79) and 0·74 (IQR = 0·71, 0·76), respectively(Reference Foschi, Conti and Domenicali17). Of note, when tested in the same population, FLI has shown higher AUROC than LAP (0·84 v. 0·79, respectively), thus making FLI one of the best steatosis scores for the general population(18,Reference Rinella, Tacke and Sanyal20,Reference Papagianni, Sofogianni and Tziomalos46) . Together, these data show the potential of FLI and LAP as non-invasive methods to detect NAFLD in large populations. We were thus able to estimate the prevalence of NAFLD in the adult population of Chile by using the National Health Survey. This information represents the first glimpse in a country with high prevalence of excess body weight and may guide public health decisions regarding health promotion.
Lifestyle habits represent a first-line strategy for the prevention and treatment of NAFLD. We thus analysed the association between some lifestyle habits and the presence of NAFLD at a population level. Compared with individuals who smoked ≥ 1 cigarette/d, every smoking category was associated with lower odds of having NAFLD estimated by the combination of FLI and LAP. Similar trends were observed using FLI and LAP separately. These findings agree with evidence showing cigarette smoking as a risk factor for hepatocellular carcinoma in chronic disease(Reference Lange, Radu and Dufour47). Indeed, a cohort study using self-report and cotinine-verified smoking status demonstrated a positive association between current smoking and risk of incident NAFLD(Reference Jung, Chang and Kwon48). Our population-based data confirm the association between cigarette smoking and NAFLD.
Dietary patterns and composition may influence the relationship between diet and NAFLD(Reference Romero-Gómez, Zelber-Sagi and Trenell21,Reference Riazi, Raman and Taylor49) . Specifically, whole grains are considered part of a healthy diet due to their content of fibre, vitamins, minerals and phenolic compounds. In patients with NAFLD, twelve weeks of whole-grain consumption was previously shown to ameliorate liver steatosis and the circulating concentration of liver enzymes(Reference Dorosti, Jafary Heidarloo and Bakhshimoghaddam50). Similarly, a cross-sectional study in the Dutch population showed that a low intake of whole-wheat bread was associated with high FLI values (suggestive of NAFLD)(Reference Rietman, Sluik and Feskens33). Our current data agree with those findings. Consumption of whole grains < 2 times/week (v. never) was associated with reduced odds of having NAFLD identified by the combination of FLI and LAP. Similar trends were observed for the consumption of ≥3 times/week (OR of 0·53 (95 % CI 0·27, 1·01)), or when estimating NAFLD by FLI or LAP separately. Legumes contain fibre, proteins, carbohydrates, vitamin B complex, Fe, polyphenols and phytochemicals, while being low in fat and almost free of saturated fat(Reference Polak, Phillips and Campbell51). Previous data showed that high intakes of legumes were associated with a low risk of NAFLD(Reference Bahrami, Teymoori and Eslamparast52). We also found some evidence that legume consumption was associated with reduced odds of having NAFLD estimated by FLI or LAP. Yet, such association was not detectable when using FLI and LAP simultaneously.
Increasing physical activity (e.g. through moderate-vigorous exercise) has positive effects on the treatment of NAFLD,(Reference Fernández, Viñuela and Vidal26) whereas time spent on sedentary behaviour associates directly with liver fat(Reference Bowden Davies, Sprung and Norman24). Notably, a person can achieve the recommended levels of moderate-vigorous physical activity and simultaneously accumulate large amounts of time on sedentary behaviour(Reference Fernández-Verdejo and Suárez-Reyes30). This highlights the relevance of considering both physical behaviours separately. We found no association between the presence of NAFLD and sedentary behaviour. Yet higher levels (3rd or 4th quartiles) of moderate-vigorous physical activity were associated with lower odds of having NAFLD. This was observed when identifying NAFLD by FLI, LAP and their combination. Our population-based data thus support the relevance of promoting moderate-vigorous physical activity for health purposes.
The major strength of our study is the large sample size, representative of the adult population in Chile. Yet, there are some limitations. First, the cross-sectional design does not allow us to determine cause–effect relationships between the presence of NAFLD and lifestyle factors. Nevertheless, our population-based data support that diet and physical activity may influence the pathogenesis of NAFLD(18,Reference Rinella, Tacke and Sanyal20) . The effect seems partially independent of excess body weight as our analyses were adjusted for BMI. Second, lifestyle habits were estimated by questionnaires, which are prone to desirability bias and depend on the memory of participants(Reference Fernández-Verdejo, Aguirre and Galgani53). Yet this is the only method that has been used in the three National Health Surveys of Chile conducted so far to collect population-based information. The implementation of objective methods to measure lifestyle habits (e.g. accelerometers to measure physical activity and sedentary behaviour(Reference Fernández-Verdejo and Suárez-Reyes30)) remains a challenge for future surveys. Finally, an international expert panel recently proposed renaming NAFLD as metabolic dysfunction-associated fatty liver disease to highlight the contribution of cardiometabolic risk factors independently of alcohol consumption or other liver diseases(Reference Eslam, Newsome and Sarin54). The European Association for the Study of the Liver and the American Association for the Study of Liver Diseases have not yet adopted this terminology. We thus used NAFLD.
In conclusion, we have estimated – for the first time – the prevalence of NAFLD in the adult population of Chile using non-invasive methods. Our data suggest that at least one out of four adults in Chile has NAFLD. These results should encourage the development of strategies for the prevention and treatment of NAFLD in Chile. Promotion of lifestyle habits such as whole-grain consumption and moderate-vigorous physical activity appears as a promising first-line strategy.
Acknowledgements
This work was supported by ANID/CONICYT FONDECYT Iniciación (P. P., grant number 11150685 and R.F-V., grant number 11180361) and ANID/CONICYT FONDECYT Regular (F.B., grant number 1191183).
The funders had no role in the data collection, analysis or interpretation. P. P. conceived the study, analysed the data, interpreted the data and drafted the manuscript; T. F. conceived the study, analysed the data and interpreted the data; C. A. interpreted the data; F. B. interpreted the data; A. R. interpreted the data; R. F-V. conceived the study, analysed the data, interpreted the data and drafted the manuscript. All authors revised critically the manuscript and approved the final version.
The authors declare that there are no conflicts of interest.
Supplementary material
For supplementary material/s referred to in this article, please visit https://doi.org/10.1017/S0007114523000028


