


Food choice and intake have been linked to psychological distress, with a noted trend to an increased intake of unhealthy, palatable foods that are high in fat and/or sugar and low in fibre when individuals are anxious or depressed( Reference Wallis and Hetherington 1 ). This trend is of particular concern for individuals with type 2 diabetes who balance the challenges of establishing new health behaviours when feeling distressed( Reference Eisenberg and Burgess 2 ). Dietary management has become a cornerstone of type 2 diabetes control and of reducing the risk of associated CVD( Reference Brand-Miller, Petocz and Hayne 3 – Reference Jenkins, Srichaikul and Kendall 5 ). Type 2 diabetes management interventions often focus on nutrition education; yet understanding the relationship between psychological well-being and distress and health outcomes may be critical for developing innovative strategies to support those with type 2 diabetes to shape new food patterns and to avoid unhealthy habits.
The objective of the current research was to examine the association between food choice and distress in a large national sample of American Indians/Alaska Natives (AI/AN) with type 2 diabetes. Drawing on data from 2015, American Indian and Alaska Native (AI/AN) adults (≥20 years old) who receive care from Indian Health Service (IHS) have a substantially higher prevalence of type 2 diabetes than the general US population and many other minority groups in the USA( 6 ). After adjusting for population age differences, 15·1 % of all AI/AN adults served by IHS had diagnosed type 2 diabetes, with rates varying by region from 6·0 to 24·1 %( 6 ). Over the last two decades, type 2 diabetes-related lifestyle modification education and case management delivered to AI/AN clients have emphasized nutrient content of foods, grounded in the idea that this knowledge would lead to improved food behaviours( Reference Mendenhall, Berge and Harper 7 , Reference Kattelmann, Conti and Ren 8 ). In this population, the association between food choice and psychological distress has received little attention despite a growing literature that links emotions and eating( Reference Richardson, Elliott and Waller 9 – Reference Zellner, Loaiza and Gonzalez 11 ). Informed by studies with non-AI/AN populations, the current research was guided by the hypothesis that AI/AN adults with type 2 diabetes would exhibit a positive association between psychological distress and unhealthy food choice.
In 2003, the US Congress funded the Special Diabetes Program for Indians – Healthy Heart demonstration project (SDPI-HH), designed to reduce CVD risk among AI/AN with type 2 diabetes through translation of a proven intervention into clinical practice across geographically and organizationally diverse settings. Complete details of the SDPI-HH project are described elsewhere( Reference Moore, Jiang and Manson 12 ). Briefly, thirty health-care programmes serving predominantly AI/AN clients received funds in 2004 to implement SDPI-HH. These programmes, located in each of the twelve IHS administrative service areas, included seven IHS hospitals/clinics, twenty-one tribal health-care programmes and two urban IHS-contracted programmes, serving 138 tribes in thirteen states. The University of Colorado Anschutz Medical Campus was the Coordinating Center and worked under the guidance of the IHS Division of Diabetes Treatment and Prevention to provide technical assistance to the programmes and to collect, manage and analyse related process and outcome data. This large, national sample of AI/AN participants diagnosed with type 2 diabetes provides a unique opportunity to gain insight into the association between psychological distress and food choices prior to participation in an intervention, thus informing case management strategies.
Methods
Participants
Eligibility criteria included being AI/AN, at least 18 years of age and having type 2 diabetes. Patients were excluded if pregnant, receiving dialysis for end-stage renal disease, undergoing cancer treatment, suffering active alcohol or substance abuse problems, or any other condition that might prohibit successful participation. Previous CVD was not a criterion for exclusion. Potential participants were identified by programme staff through electronic medical records or type 2 diabetes registries, and recruited through community and clinical activities, such as health fairs and provider referrals.
Project staff began enrolling participants into the SDPI-HH programme in January 2006. At baseline, participants completed a questionnaire that covered sociodemographic characteristics, co-morbid health conditions, self-reported physical activity, food intake frequency, alcohol consumption and smoking status. Participants also completed the Kessler-6 Distress Scale (K6)( Reference Kessler, Andrews and Colpe 13 , Reference Kessler, Barker and Colpe 14 ). The K6 has excellent reliability and validity, and performs well in AI/AN populations( Reference Huyser, Manson and Nelson 15 ). By 31 July 2009, 3039 SDPI-HH participants from thirty health-care programmes completed baseline questionnaires. Twenty-six of the participating thirty programmes were based in rural reservations. Our previous research found significant differences in food choices among AI/AN with prediabetes by geographic setting, with participants living in urban areas reporting more frequent consumption of healthy foods than did rural participants. This observation may be related to a greater array of food availability settings and reduced distances to supermarkets( Reference Teufel-Shone, Jiang and Beals 16 ). To improve the homogeneity of the present study, we excluded the four urban sites (n 555) and focused on the 2484 participants residing in rural settings.
Measures
Sociodemographic characteristics
Participants reported their age, gender, education attainment, employment status, marital status and annual household income in the baseline questionnaire.
Co-morbidity
Participants’ co-morbidity burden was measured by an index for twelve conditions other than type 2 diabetes( Reference Sangha, Stucki and Liang 17 ).
Food choices
Details about the food choice variables are described elsewhere( Reference Teufel-Shone, Jiang and Beals 16 ). Briefly, participants were asked to recall the intake of twenty-seven different types of foods over the 30 d prior to baseline using a self-administered FFQ. The FFQ was adapted from the Multifactor Screener, evaluated at the National Cancer Institute and validated by other studies (http://appliedresearch.cancer.gov/surveys/nhis/multifactor/). Some questions were culturally adapted to the AI/AN population. The frequency of each type of food was reported as: ‘less than once a month’ (1); ‘1–3 times a month’ (2); ‘about once a week’ (3); ‘2–3 times per week’ (4); ‘about once a day’ (5); and ‘more than once a day’ (6). The twenty-seven food types were categorized as ‘healthy’, ‘unhealthy’ or ‘undetermined’ based on survey results from programme staff members who led the nutrition education at the programme sites. The healthy food score was constructed by averaging the intake frequency of six healthy foods (e.g. wholegrain bread, fruit) with a Cronbach’s α of 0·70; the unhealthy food score was calculated as the mean intake frequency of twelve unhealthy foods (e.g. processed meats, regular soft drinks) with a Cronbach’s α of 0·74. The undetermined food score was operationalized as the mean intake frequency of the remaining nine nutritionally variable foods (e.g. cereals, pasta). The Cronbach’s α of the nine undetermined foods was 0·58, indicating relatively weak internal consistency, likely reflecting the variability in these items. Given the variability of foods in this category, associations with the undetermined food types were not examined. The healthy and unhealthy food scores have been shown to be reliable and valid indicators of dietary outcomes in related analyses of SDPI programmes( Reference Teufel-Shone, Jiang and Beals 16 , Reference Teufel-Shone, Jiang and Beals 18 ).
Distress
Non-specific psychological distress is characterized by an array of psychological and somatic symptoms associated with a wide range of mental disorders but not specific to any single disorder( Reference Dohrenwend, Shrout and Egri 19 ). The K6( Reference Kessler, Andrews and Colpe 13 , Reference Kessler, Barker and Colpe 14 ) (Cronbach’s α=0·88) was used to evaluate each SDPI-HH participant’s distress level at baseline. The K6 has been validated in national and international settings, including in the National Health Interview Survey (NHIS)( Reference Kessler, Barker and Colpe 14 , Reference Furukawa, Kessler and Slade 20 ). The instrument has six questions about depressive and anxiety symptoms (sadness, nervousness, restless or fidgety, hopeless, level of effort, worthless) experienced in the past 30 d. Responses are a multi-choice scale of five values: 1=‘none of the time’, 2=‘a little of the time’, 3=‘some of the time’, 4=‘most of the time’ and 5=‘all of the time’. The six items are summed to yield a number between 0 and 24 with higher scores indicating more severe distress( Reference Kessler, Andrews and Colpe 13 ). Low scores are aligned with worry, fear and life-changing circumstances; a cut-off score of 13 is defined as serious psychological distress and as meeting criteria for at least one Diagnostic and Statistical Mental Disorder diagnosis, e.g. depression and/or anxiety and substantial impairment( Reference Kessler, Andrews and Colpe 13 ). The mean K6 score was used as a continuous variable in all analyses in the present study.
Data analysis
Differences in sociodemographic characteristics by gender were examined using χ 2 tests. The mean distress scores in different sociodemographic categories were calculated and compared using two-sample t tests or ANOVA tests. Pearson’s correlation coefficients were calculated and tested for significance between distress and two continuous baseline characteristics, years of type 2 diabetes duration and the co-morbidity score. The mean intake for each food type as well as means for each food category (healthy, unhealthy and undetermined) were calculated and compared between genders using two-sample t tests. Pearson’s correlation coefficients between the distress score and intake of each food type were calculated and tested for statistical significance for all participants and separately within each gender. To assess the association between healthy and unhealthy food scores and participants’ distress level, multiple linear regression models were fitted with distress included in the models, controlling for sociodemographic characteristics and years of type 2 diabetes duration. Co-morbidity was removed from the models due to insignificant associations with the food score variables in all models. Interaction terms between distress and each of the sociodemographic characteristics were tested; only gender showed significant interaction with distress. Therefore, we also fitted multiple linear regression models stratifying by gender. To account for within-site clustering, linear mixed models with a random effect at the site level were used for the multivariable models.
Except for age and gender, rates of missing data for participants’ socio-economic variables ranged from 5 to 18 %. To avoid resulting potential bias, a multiple imputation method was used to impute missing participants’ socio-economic data using IVEware( Reference Raghunathan, Solenberger and Van Hoewyck 21 ). Twenty imputed data sets were generated, and final linear mixed models were fit in each of the twenty data sets. The results were then combined using the SAS MIANALYZE procedure to obtain the standard error for the estimate. Sensitivity analyses were performed to assess the influence of missing data on the results from the multivariable model. The results were only slightly different and all major conclusions remained the same; hence, the results using imputed data are reported here. Results were considered to be statistically significant if P<0·05. All analyses were performed using the statistical software package SAS version 9.4.
Results
Table 1 shows the baseline sociodemographic characteristics of these rural SDPI-HH participants overall and by gender, and the mean distress scores presented by level of the sociodemographic characteristic. The majority of the 2484 participants included in the present study were aged 50 years or older (66·0 %), were female (65·1 %), had completed some college or graduated from college (55·9 %), were employed (53·4 %), were married or living with a partner (58·9 %) and had an annual household income of less than $US 30000 (58·2 %). The average number of years since type 2 diabetes diagnosis was 4·71 and the average number of co-morbid conditions was 4·24. Compared with male participants, females were older, more likely to have a college education and be employed, less likely to be married or living together with a partner and have less household income. Female participants had a longer history of type 2 diabetes than males (4·92 v. 4·29 years). The number of co-morbid conditions was not significantly different by gender. The mean distress score of all SDPH-HH participants was 1·81 (sd 0·83) out of a maximum of 5 (data not shown). The following characteristics were associated with a high level of distress: being female, young, low education level, unemployed or a student, not married, low household income and high number of co-morbid conditions. Distress was not significantly associated with type 2 diabetes duration in years.
Table 1 Baseline characteristics, by gender, and distribution of distress score among reservation-based American Indians and Alaska Natives with type 2 diabetes participating in the Special Diabetes Program for Indians – Healthy Heart demonstration project (SDPI-HH), 2009
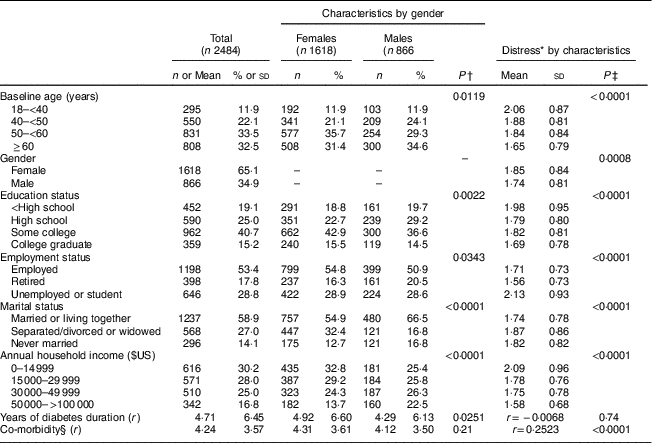
r, Pearson’s correlation coefficient.
* Kessler-6 Distress Scale score, ranging from 1 (lowest) to 5.
† P value from χ 2 tests or two-sample t tests (for continuous variables) comparing male and female participants in their proportion of each category for each characteristic variable.
‡ P value from ANOVA tests or for Pearson’s correlation coefficients (for continuous variables) comparing distribution of distress in each category for each characteristic variable.
§ From self-administered co-morbidity questionnaires without including diabetes.
Intake frequencies of eighteen food types grouped by the two food categories are displayed by gender in Table 2. At baseline, SDPI-HH participants had higher mean healthy food scores than unhealthy food scores. Both male and female participants reported eating healthy foods at least once weekly on average except for cooked dried beans, which were consumed slightly less than once weekly. They more frequently ate chicken, fish or game meats than processed meat, red meats or fast foods. Similarly, they ate fruits and vegetables more often than fried potatoes. Participants reported eating three of the twelve unhealthy foods, specifically processed flour, sugar/creamer in tea and coffee and red meat, more than once weekly on average; other unhealthy foods were consumed less than once weekly on average.
Table 2 Self-reported baseline food frequency, by gender, among reservation-based American Indians and Alaska Natives with type 2 diabetes participating in the Special Diabetes Program for Indians – Healthy Heart demonstration project (SDPI-HH), 2009
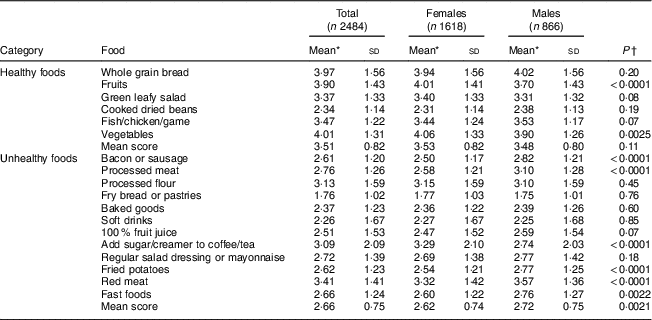
* Mean of the frequency for each type of food reported as: ‘less than once a month’ (1); ‘1–3 times a month’ (2); ‘about once a week’ (3); ‘2–3 times a week’ (4); ‘about once a day’ (5); ‘more than once a day’ (6).
† P value from two-sample t tests comparing the food frequencies between females and males.
However, gender differences were evident in food choices. Females reported significantly more frequent consumption of fruits and vegetables and marginally more frequent consumption of green leafy salad than males. However, the mean scores of all healthy foods were not significantly different by gender. For unhealthy foods, females reported consuming bacon or sausage, processed meat, fried potatoes, red meat and fast foods significantly less frequently than males. Although females reported adding sugar/creamer to coffee and tea more frequently than males, the mean score of unhealthy food for females was significantly lower than that for males (2·62 v. 2·72, P=0·0021).
Table 3 depicts the correlations between food choices and distress level by gender. The negative correlation between distress level and mean healthy food score was significant among female participants, but the association was not significant among males. Significant positive correlations between distress and mean unhealthy food scores were found in both genders. In a review of each individual kind of foods, distress level was negatively associated with the consumption of all healthy foods, except for cooked dried beans, while positively associated with the consumption of unhealthy foods. When considered by gender, stronger correlations were found for females than males between higher distress levels and less frequent eating of healthy foods. For both men and women, consumption of unhealthy foods was commonly related to higher levels of distress.
Table 3 Correlation between baseline self-reposted food frequency and distress score, by gender, among reservation-based American Indians and Alaska Natives with type 2 diabetes participating in the Special Diabetes Program for Indians – Healthy Heart demonstration project (SDPI-HH), 2009
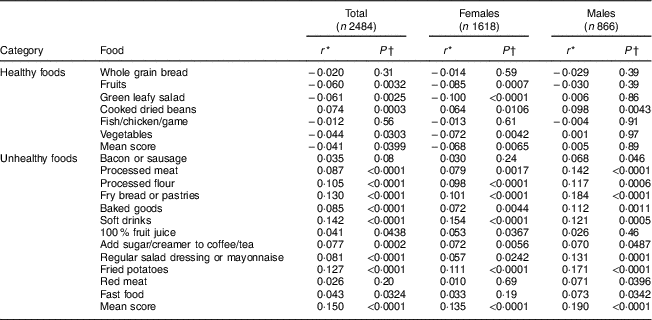
* Pearson’s correlation coefficient for each food frequency and distress score.
† P value for the Pearson’s correlation coefficient for food frequency and distress score.
Table 4 reveals the relationship of distress level to mean healthy and unhealthy food scores after adjusting for baseline sociodemographic characteristics and type 2 diabetes duration. Due to an interaction between gender and distress, we present the results of multivariable regression models stratified by gender. After holding other sociodemographic variables constant, distress was not significantly associated with the healthy food score in either females or males. However, distress levels were significantly related to unhealthy food choices in both women and men (in females: β=0·078, P=0·0007; in males: β=0·139, P<0·0001). Specifically, every 1-unit increase in distress scale was associated with an increase of 0·078 in unhealthy food score among female participants and 0·139 among male participants.
Table 4 Association of baseline food choice and characteristics: multivariable regression stratified by gender using imputed data, among reservation-based American Indians and Alaska Natives with type 2 diabetes participating in the Special Diabetes Program for Indians – Healthy Heart demonstration project (SDPI-HH), 2009
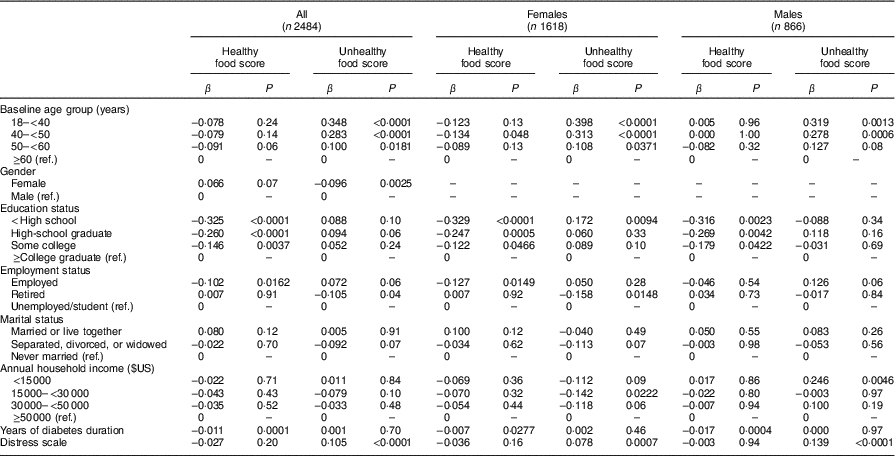
Ref., reference category.
Discussion
The SDPI-HH programme provides a national picture of food choice behaviours among AI/AN adults with type 2 diabetes prior to engaging in a heart disease risk-reduction programme. Specifically, the present analysis examined the association between food choice and distress, revealing significant positive correlations between distress and unhealthy food scores in both genders. The relationship was stronger among males than females.
The trends noted in the present study can inform nutrition education efforts tailored to meet the needs of and resources available to AI/AN. Currently, the American Heart Association and other heart disease prevention programmes promote healthy foods, advocating an increased intake of fruits, vegetables and low-fat meats( Reference Lloyd-Jones, Hong and Labarthe 22 ). These recommendations may be difficult for AI/AN with type 2 diabetes to follow, given limited availability of healthy foods particularly in rural and low-income communities( Reference Morton and Blanchard 23 ).
Prior to receiving nutrition education offered by the SDPI-HH programme, females made more healthy food choices than males. This trend is echoed in a national sample of 3135 AI/AN at risk for developing type 2 diabetes, where females again reported more healthy food choices than males at baseline( Reference Teufel-Shone, Jiang and Beals 16 ). Comparing results for US adults aged 40–74 years across the 1988–1994 and 2001–2004 waves of the National Health and Nutrition Examination Survey (NHANES), King et al.( Reference King, Mainous and Carnemolla 24 ) demonstrated a similar trend nationally in which females consistently selected more fruits and vegetables than males.
The reason for such gender differences in food choice among AI/AN as well as non-AI/AN is unclear. AI/AN males are often not targeted in health promotion and education campaigns, perhaps explaining their low participation in intervention programmes and community-based health events( Reference Teufel-Shone, Jiang and Beals 16 , Reference Teufel-Shone, Fitzgerald and Teufel-Shone 25 ). Even in the SPDI-HH, AI/AN males represented only a third (34·8 %) of participants. Similarly in non-AI/AN populations, Wethington et al.( Reference Wethington, Maynard and Haltiwanger 26 ) reported that females are more likely to seek and use nutrition education than males. Females’ traditional role in food purchasing and preparation may contribute to their interest in nutrition education; subsequently, health educators may tend to design their approach to fit the needs of women, perceived as the more receptive audience. This gap in population-based nutrition education accentuates the need for additional research to understand men’s food-related health concerns. This is particularly true as AI/AN males experience type 2 diabetes and heart disease-related morbidity and mortality comparable to AI/AN females and thus need tailored health education( Reference Best, Garcia-Esquinas and Yeh 27 , Reference Veazie, Ayala and Schieb 28 ).
Another gap identified by the present study is the absence of research that addresses the association between food choice and distress in AI/AN populations, and more specifically, gender differences in food choice and distress among AI/AN. Distress and behaviour among AI/AN receives considerable attention by behavioural health researchers, but focuses largely on smoking( Reference Hickman, Delucchi and Prochaska 29 ) and substance abuse( Reference Bryant and Kim 30 , Reference Saylors and Daliparthy 31 ) rather than food choice. Research examining ways AI males and females cope with stress related to poverty and underemployment, characteristic of many reservation communities, is scare. One study among the Lakota Tribe in South Dakota suggests that males more readily avoid discussion of stressful life events than do females( 32 ). Preferential selection of foods having high concentrations of sugar, fat, salt or caffeine has been identified as an attempt to facilitate numbing and avoidance, symptoms specific to distress( Reference Brewerton 33 ). This research on differences in AI males’ and females’ food choices in relation to a distress measure further supports the need to explore the effectiveness of gender-specific health promotion strategies for this population.
The positive relationship between psychological distress and unhealthy food choices found in the current research is well documented and consistent with research in non-AI/AN populations( Reference Li, Lv and Wei 34 ). Naturalistic studies demonstrate that distress and acute stress lead to higher energy intakes and less healthy diets in adolescents and adults( Reference Michaud, Kahn and Musse 35 , Reference Weidner, Kohlmann and Dotzauer 36 ). Emotion-driven unhealthy choices offer both psychological and physiological comfort upon consumption( Reference Wansink, Cheney and Chan 37 ). Brewerton( Reference Brewerton 33 ) notes that people’s use of food to self-medicate during periods of acute or chronic stress is consistent with animal models indicating that stress may provoke increased consumption of highly palatable (high-fat/high-sugar) food, leading to weight gain. Neurological studies indicate that ingestion of high-fat, high-sugar foods may blunt feelings of distress by triggering dopaminergic reward( Reference Li, Lv and Wei 34 , Reference Cota, Proulx and Smith 38 , Reference Ulrich-Lai, Christiansen and Ostrander 39 ). Drawing on more than 20 years of scientific literature examining the link between sensory, physiological and psychological pathways that influence food choice, Gibson( Reference Gibson 40 ) concludes that ‘mood can alter food choice, and food choice can alter mood … the effect of one on the other likely involves some reinforcing outcome.’
Comfort food preference varies by gender. Males often prefer warm, hearty, meal-related comfort foods (such as steak, casseroles and soup); females prefer more snack-related foods (such as chocolate and ice cream)( Reference Wansink, Cheney and Chan 37 ). In the present research, these comfort foods were identified as unhealthy foods. Similarly, Dohle et al.( Reference Dohle, Hartmann and Keller 41 ) recently reported that females consistently have higher scores for ‘emotional eating’ than males. In the same vein, Verhoeven et al.( Reference Verhoeven, Adriaanse and de Vet 42 ) observed that women are more likely than men to use snacking to cope with negative emotions.
A positive relationship between distress and unhealthy food choices is evident in both SDPI-HH males and females, but stronger among AI/AN males than females. This pattern is contrary to studies of non-AI/AN populations. This sample of AI/AN with type 2 diabetes exhibits a distinct gendered association between distress and food choice that has not been previously reported in the literature. This observation, coupled with previous findings that AI/AN males more often select unhealthy foods and are less likely to enrol in a heart disease risk-reduction programme than AI/AN females, further highlights the need for innovative approaches to enhance AI/AN males’ knowledge of healthy food choices and the link between diet and health.
The limitations of the present study are related to sample inclusion, data collection instruments, response bias and potential impacts of missing data. Project participation was voluntary; thus the sample represents individuals with type 2 diabetes interested in health behaviour change as a means to prevent heart disease. The food choice questionnaire was adapted from the National Cancer Institute’s Multifactor Screener, a tool intended to provide estimates of usual intake. The instrument was reviewed by health professionals at each of the thirty sites for comprehension and relevance, but not validated using another method of dietary data collection. The results were used to assess food choice and not nutrient intake. Participants self-reported food choices. Drawing on the reported social desirability of healthy foods in non-Native populations( Reference Novotny, Rumpler and Riddick 43 ), women in the present study may have been overstated their consumption of these foods.
Furthermore, 35 % of the observations were missing the diet score or one of the eight independent variables included in the final multivariable model, mostly due to missing data on income and/or marital status. A multiple imputation approach was used to maximize the validity and power of analysis. A basic assumption of multiple imputation is that data are missing at random( Reference Rubin and Peyrot 44 ), an assumption difficult to evaluate with observed data only. However, comparing the baseline characteristics of participants with and without reported income or marital status revealed that the indicators of missingness were not associated with either diet score, suggesting such data are likely missing at random.
Conclusions
Research examining the association between food choice and distress in the AI/AN population is absent from the literature. Baseline data collected from this large sample of AI/AN adults with type 2 diabetes reveals that compared with females, males made more unhealthy food choices and exhibited a stronger association between psychological distress and unhealthy food choice. These findings support the recommendation that health education for AI/AN adults should consider the distinct food-related behaviours of males and females. Case managers, health educators and programme planners working with AI/AN should direct efforts to design and implement programmes that offer food choice strategies during difficult times and recognize that males may be more likely than females to select unhealthy foods when distressed.
Acknowledgements
Acknowledgements: The authors would like to express their gratitude to the Indian Health Service (IHS) as well as the Indian health programmes and participants involved in the Special Diabetes Program for Indians Diabetes Prevention Program. Financial support: This research was supported by the IHS (S.M.M., grant number HHSI242200400049C). Manuscript preparation was supported in part by American Diabetes Association (ADA) (L.J., grant number ADA #7-12-CT-36). The IHS contributed to the study design, interpretation of findings and the preparation of the manuscript. The ADA had no role in the design, analysis or writing of this manuscript. Conflict of interest disclosure: None. Authorship: N.I.T.-S. completed the literature review and drafted the manuscript. L.J and J.C. performed statistical analyses and assisted in drafting the manuscript. N.I.T.-S., L.J., J.R., J.C. and J.B. interpreted the data, contributed to the discussion and reviewed/edited the manuscript. S.M.M. designed and with A.B. oversaw the research activities. N.I.T.-S. is the guarantor of this work and, as such, had full access to all data in the study and takes responsibility for the integrity of the data and the accuracy of the data analysis. Ethics of human subject participation: This study was conducted according to the guidelines laid down in the Declaration of Helsinki and all procedures involving human subjects were approved by the participating tribes and/or their respective research review board and the IHS. These same entities provided consent for publication of this manuscript. Written informed consent was obtained from all subjects.


