
1. Introduction
As Corrigan (Reference Corrigan and Hickey2011: 183) notes, Widdowson (Reference Widdowson1999: 81) first raised the possibility of exploiting archival corpus resources as ‘primary evidence for the study of linguistic variation and change’. He concluded that: ‘the data remains hidden and inaccessible’ (Reference Widdowson1999: 84) and advocated initiatives for the identification and enhancement of these archives for future exploitation. Subsequent publications documenting and analysing digital resources like this demonstrate the extent to which Widdowson’s vision has had an impact (see Sections 3.1 and 3.3.1).
However, as Kretzschmar et al. (Reference Kretzschmar, Anderson, Beal, Corrigan, Opas-Hänninen and Plichta2006) note, the enhancement of legacy corpora for re-use in analysing regional and social differences is not without its challenges, nor indeed is the direct comparison of even synchronic corpora when they have been collected using distinctive protocols and for the purpose of fulfilling divergent research objectives (D’Arcy Reference D’Arcy, Maguire and McMahon2011).Footnote 1
This chapter highlights the advantages and disadvantages that arise with respect to fulfilling Widdowson’s (Reference Widdowson1999) aim by examining two corpora I have created and digitised: the National Folklore Collection’s South Armagh Corpus (NFCSAC) and the Diachronic Electronic Corpus of Tyneside English (DECTE). Although I will demonstrate that both are invaluable resources, there are aspects of the content and digitisation of each which are reminiscent of Labov’s (Reference Labov2001: 11) description of working with historical data more widely, namely, that it is: ‘The art of making the best use of bad data’. This chapter explores the considerable ‘artistry’ involved in order to make the ‘best use’ of the data to answer sociolinguistic questions. It also reflects on decisions made during the process. Not only do these choices have important consequences for the re-use and long-term preservation of the resources themselves, but they also give insights into best practices in corpus construction.
2. The National Folklore Collection’s South Armagh Corpus
The original data for the NFCSAC were collected by Michael J. Murphy, a folklorist working in the South Armagh (SA) area of Northern Ireland (1942–74).Footnote 2 In addition to personal narratives of experience on folkloric themes, the materials also contain images as well as correspondence between Murphy and his employers. Given the fact that the narratives, in particular, were collected for more than thirty years of Murphy’s career, the archive has the potential to further our understanding of South Armagh English as it developed. The region is especially interesting from a linguistic contact perspective, since its isolation helped maintain South Armagh Irish into the 1940s, but improved transport links and other socio-economic changes in the area after World War II opened up this dialect to contact with different varieties of English, which had important linguistic consequences (Corrigan Reference Corrigan1997; Reference Corrigan and Hickey2011).
The NFCSAC dataset used to construct the corpus exploited in Corrigan (Reference Corrigan1997) inter alia covers topics considered to be relevant to understanding the folkloric customs local to the region, for example agriculture and trade. NFCSAC comprises 59,583 words and contains more than 200 narratives, as defined by Labov and Waletzky (Reference Labov, Waletzky and Helm1967) and Labov (Reference Labov1997). Murphy recorded participants in his own backyard of SA, all of whom can be considered homogeneous not only from the perspective of place (they were all born and reared there), but also because they share socio-economic traits and social networks.
Although Murphy originally made his recordings using a wax-cylinder Ediphone device and, from the 1950s onwards, a magnetic tape recorder,Footnote 3 it was his transcripts of this audio material that became the source of the NFCSAC. The fact that the corpus consists of only the written transcripts, naturally, raises questions of their accuracy regarding the original speech events. As Tagliamonte (Reference Tagliamonte, Beal, Corrigan and Moisl2007: 209–10) notes, the linear nature of writing is poorly designed for capturing conversation. Transcribers require protocols that accurately retain enough of the original speech signal to allow for linguistic and other forms of analysis, but should not be so complex as to render the resulting transcriptions unreadable and excessively time-consuming to complete. Despite the fact that this data was not originally collected for linguistic purposes, Murphy did generally strike the right balance since his transcripts do contain many features associated with natural speech, such as the reformulations highlighted in (1):
(1) So then she went to … took patients to a priest in England, who was supposed to have great power, and he told her that she had the same power
The punctuation here also indicates that Murphy has followed contemporary typographical conventions by indicating the fact that the relative clause is non-restrictive by placing it inside commas. However, Murphy’s use of this and other typographical practices is not always consistent, as can be seen in (2), which is similarly non-restrictive, but is missing the conventional punctuation:
(2) They belonged to his uncle who was Dr McDonald who was the parish priest …
Given the fact that research questions relating to the types of relative clause preferred by males versus females and the extent to which both groups have adopted Standard English norms in their lifetimes were amongst those that this project was to address, issues such as these are problematic. However, the costs of ‘trade-offs’ like this are worth bearing when it is clear that, in so many other respects, Murphy’s transcriptions are indeed ‘consistent’ with the ‘real language’ he was aiming to ‘represent’ (Tagliamonte Reference Tagliamonte, Beal, Corrigan and Moisl2007).
There are elements of the Murphy corpus, then, that in Labov’s (Reference Labov2001: 11) sense are ‘bad data’ and cannot be overcome. However, there are very strong arguments that the data remain ‘good’ enough for certain types of linguistic analysis, as demonstrated in the diachronic analyses of relativisation in the corpus published as Corrigan (Reference Corrigan, Filppula, Klemola and Paulasto2009), and in the analysis of vernacular verb forms sketched in Section 2.3.1. Indeed, Murphy (Reference Murphy1973: 65) himself likens his task to that of the ‘linguistic quest’ of dialectologists, in that both enterprises are what he describes as ‘coldly scientific’. We can assume that what he is referring to here is his claim that his recordings always ‘aimed at the highest possible fidelity towards the speech’ (Murphy Reference Murphy1975: vii). Hence, the use of swear words like frig and blasphemous lexemes, which would have been considered very strong language for the time and place, are instances of such authenticity (see Andersson and Trudgill Reference Andersson and Peter1990; Farr and Murphy Reference Farr and Murphy2009).
Moreover, Glassie (Reference Glassie1982: 734, fn.4) confirms Murphy’s objectives stating that the discipline of folklore relied on collecting ‘accurate texts’. Indeed, Murphy’s particular insistence on the careful preservation of his narratives has been much commented on since his death (see Smyth Reference Smyth1997).
In addition to the mimetic commitment demonstrated in the previous paragraphs, it is also important to consider the intrinsic value of Murphy’s status as a native speaker in the SA community, in which he acted as a participant observer. His family was indigenous to the area and he is known to be the third generation to have lived there. His lack of geographical mobility increases the likelihood that the dialect used by his informants will have matched his own. Hence, he is unlikely to have misunderstood the speakers or to have felt the need to normalise their output. Indeed, Murphy (Reference Murphy1975: ix) makes it clear that he will not standardise the material even for a more general readership. Furthermore, as a folklorist, Murphy’s fundamental interest was in the content of his informants’ stories. He was insistent, therefore, that the narrative be conveyed intact and believed this could be achieved only by faithful transcription.
Murphy has insider-status in this community and while one would not expect his personal relationship with each informant to be identical, his role of collector remains constant and he shares his informants’ personal communication networks. Moreover, unlike the sociolinguistic interview techniques practised within the Labovian tradition (see Labov Reference Labov1981; Milroy and Gordon Reference Milroy and Gordon2003; Tagliamonte Reference 127Tagliamonte2006), Murphy does not have absolute control over the exchange in which he participates. His technique seems to have been to initiate the narrative turn with what he terms a ‘topical tag’ and defines as ‘any event or calamity’ (Reference Murphy1973: 38), which is somewhat comparable to ‘danger of death’ questions articulated in Labov (Reference Labov1981). By contrast to the usual folklorist practice, which Glassie (Reference Glassie1982: 743) describes as: ‘isolating tales out of conversations’, Murphy appears to have given his interlocutors a relatively loose rein thereafter, so that the ordering of topics is left to them. However, topic choice is constrained by Murphy’s role (see Reference Murphy1973: 38). Hence, while there are exchanges relating to the immediate situation of the conversation, the narratives are autonomous and cover a narrow range of themes. From a sociolinguistic perspective, the constancy of the speech event in all these respects is extremely helpful since it has been shown that changes in topic, setting, and audience can induce code-switching, which would not be desirable for subsequent social and regional analyses where style was not an independent variable.
2.1 Corpus Dimensions and Representativeness
From the perspective of quantifying the distribution of features, an important concern raised by the corpus dimensions is the fact that the potential occurrence of linguistic variables is skewed by gaps in the dataset. These are partly due to the speech event and partly to the fact that Murphy’s output was more prolific in some years.
Although the Gaelic custom associated with keening was largely the preserve of women, seanchaí were predominantly men (Glassie Reference Glassie1982: 742, fn.17). Murphy (Reference Murphy1975: vii) notes this for SA and so his participants are not evenly divided between males and females, which is problematic for ascertaining gender differences. There are fourteen female versus forty-eight male narrators, resulting in the corpus containing a negative ratio of male to female words. This imbalance means that the kind of statistical analysis possible is limited to demonstrating tendencies and, even then, it requires some means of accounting for female unrepresentativeness. As such, it is doubtful that the usual quantitative techniques associated with the sociolinguistic paradigm could be applied successfully (particularly GoldVarb X/Rbrul, as detailed in Johnson Reference Johnson2009; Sankoff et al. Reference Sankoff, Tagliamonte and Smith2005; and Tagliamonte Reference 127Tagliamonte2006 inter alia).
Table 5.1, which summarises the corpus dimensions, illustrates the nature of the problem. There are a number of years for which Murphy, by chance, did not collect any data from females (shaded grey). Moreover, male speakers in 1949 and 1963 are excluded entirely (in black) since in these years only females were recorded. Additionally, Murphy’s collection phase was most prolific in the 1940s with over 47 per cent of the entire corpus being collected in a single year (1945) during which almost 70 per cent of the female data was gathered.
Table 5.1: Number of words and percentage occurrence of words in the Murphy corpus by gender (1942–1974).
| Year | N Male Words | % of Total Male Words in Corpus per Year | N Female Words | % of Total Female Words in Corpus per Year | N Total Words | % of Total Words in Corpus |
|---|---|---|---|---|---|---|
| 1942 | 1257 | 3.37 | 1257 | 2.41 | ||
| 1945 | 14331 | 38.45 | 10206 | 68.41 | 24537 | 47.02 |
| 1946 | 947 | 2.54 | 312 | 2.09 | 1259 | 2.41 |
| 1947 | 310 | 0.83 | 310 | 0.59 | ||
| 1948 | 408 | 1.09 | 1665 | 11.16 | 2073 | 3.97 |
| 1949 | 428 | 2.87 | 428 | 0.82 | ||
| 1951 | 1135 | 3.05 | 991 | 6.64 | 2126 | 4.07 |
| 1956 | 718 | 1.93 | 718 | 1.38 | ||
| 1958 | 345 | 0.93 | 345 | 0.66 | ||
| 1959 | 121 | 0.32 | 121 | 0.23 | ||
| 1961 | 540 | 1.45 | 544 | 3.65 | 1084 | 2.08 |
| 1963 | 167 | 1.12 | 167 | 0.32 | ||
| 1964 | 584 | 1.57 | 584 | 1.12 | ||
| 1965 | 3971 | 10.66 | 3971 | 7.61 | ||
| 1968 | 1743 | 4.68 | 1743 | 3.34 | ||
| 1969 | 1716 | 4.60 | 1716 | 3.29 | ||
| 1970 | 1957 | 5.25 | 1957 | 3.75 | ||
| 1971 | 1122 | 3.01 | 1122 | 2.15 | ||
| 1972 | 2231 | 5.99 | 2231 | 4.28 | ||
| 1973 | 2877 | 7.72 | 343 | 2.30 | 3220 | 6.17 |
| 1974 | 954 | 2.56 | 262 | 1.76 | 1216 | 2.33 |
| TOTAL | 37267 | 14918 | 52185 |
These difficulties are exactly what one might expect of a corpus like this which is available for linguistic analysis by chance rather than design. Since NFCSAC’s fundamental advantage lies in the degree of objectivity with which it was collected – combined with the possibility that it can, nevertheless, track real-time constraints on certain variables – it is analogous in many ways to the type of imperfect data available in historical linguistics (see Nevalainen and Raumolin-Brunberg Reference Nevalainen, Raumolin-Brunberg, Nevalainen and Raumolin-Brunberg1996: 62).
However, the NFCSAC is superior, in that there is consistency in its method of collection and there is considerably more metadata available to describe its content and its speakers’ demographic characteristics than we could ever hope for regarding historical corpus materials (see Beal et al. Reference Beal, Corrigan, Rayson, Smith, Meurman-Solin, Anneli and Arja Nurmi2007).
2.2 Digitisation, Annotation, and Metadata
The original data that NFCSAC is derived from is held in bound manuscripts at University College, Dublin (UCD). Their regulations/workspace during corpus creation meant the process had to be manual, leading to short cuts of various kinds with important consequences for the re-purposing of the data longer-term. The conventions used in the manuscripts suggest that Murphy transcribed his recordings using a ‘discourse-oriented approach’ (Slembrouck Reference Slembrouck1992: 103), in that the quoted insets also contain transcriber comments on accents, etymologies, and idioms. Moreover, narratives are arranged by topic and the identities of the speaker–hearer and their social role relationship with the collector are marked. Thus, the extract in Figure 5.1 contains important metadata, noting that the topic is ‘Woman with a Cure’, that the informant, Brigid O’Hare, has kinship ties to Murphy and that the narrative’s physical setting is ‘Dromintee, Dromintee Parish (Newry) South Armagh’.
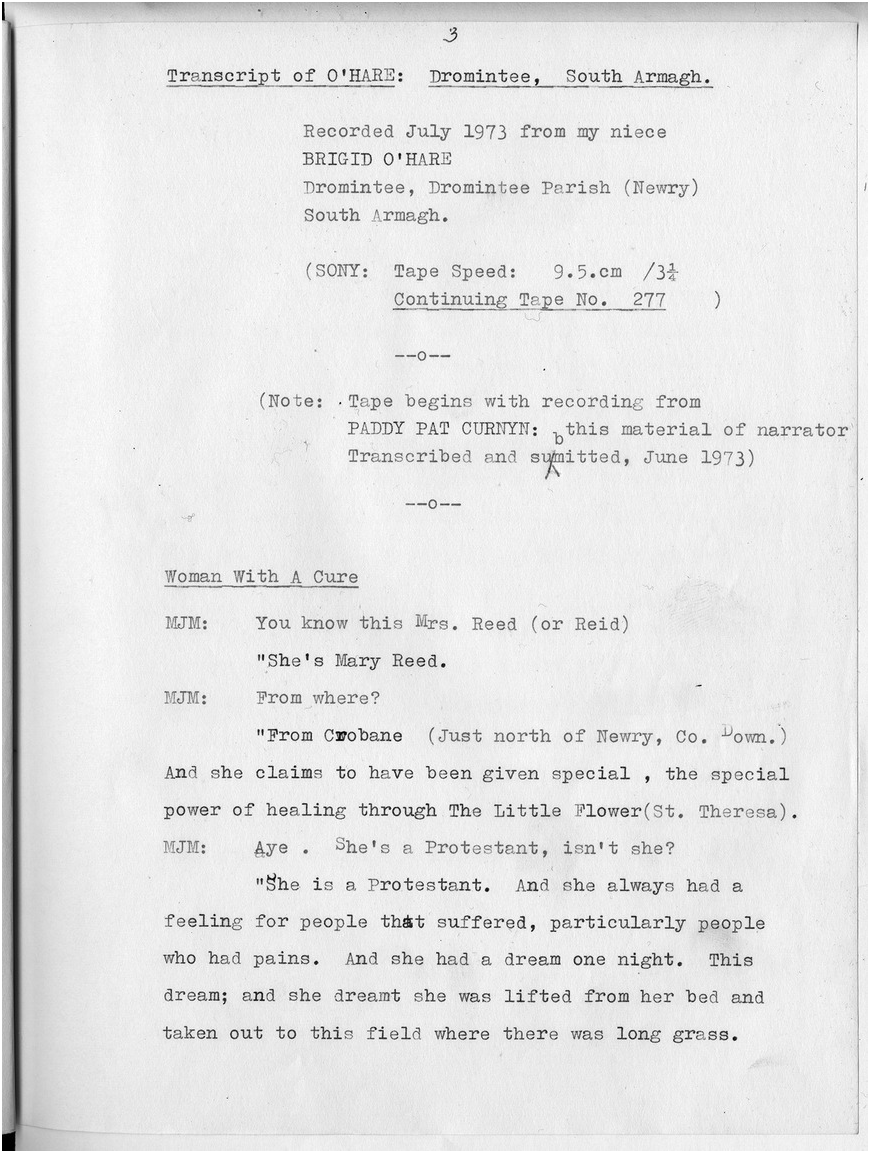
Figure 5.1: Transcript from the original NFCSAC archive.
During the transfer to computer-readable text, doggerel verse, extraneous exchanges and notes made by Murphy that appeared not to have any linguistic relevance at the time (though they did contain relevant metatadata that would have been useful to preserve for subsequent potential uses of the corpus) were edited out. Hence, NFCSAC consists exclusively of the personal narratives. Thus, in Figure 5.1, neither the introductory exchange between Murphy and his niece, establishing who exactly Mary Reed (the subject of the narrative) was, nor the bracketed section four lines into the start of the conversation denoting Crobane’s location, appears in the digitised version (Figure 5.2). This begins with the narrative proper only, though it does preserve certain metadata, such as the date of recording and the fact that the participant was female since knowing these facts was pertinent to the research hypotheses. No attempt was made to provide pseudonyms since this was not the practice in the folkloric tradition, and it was envisioned as a corpus designed only for personal use.
Figure 5.2: Truncated transcript from the digitised NFCSAC.
| MANUSCRIPT: 1810 | DATE: July 1973 |
INFORMANT: Mrs. Brigid O’Hare | LOCATION: Dromintee |
TOPIC: Woman with a Cure |
Otherwise, the original was kept as intact as possible including punctuation and glosses that were linguistically relevant. This entailed preserving Murphy’s misspellings and his attempts at rendering the pronunciation of Irish and South Armagh dialect lexical items. Hence, I retain spellings like jasus for Jesus representing typical MEAT-MATE mergered pronunciations (Corrigan Reference Corrigan2010: 34; Harris Reference Harris1985; Milroy and Harris Reference Milroy and Harris1980) as well as spellings influenced by eye dialect/folk etymology like sirosis for sclerosis.
In keeping with the recommendations of Kretzschmar et al. (Reference Kretzschmar, Anderson, Beal, Corrigan, Opas-Hänninen and Plichta2006) and Sinclair (Reference Sinclair and Wynne2005), the NFCSAC version retains metadata relevant to the speakers’ demographic characteristics, as well as certain linguistic issues. New annotations to represent features potentially relevant for subsequent analyses (like the relative clause marker coding <REL-WH> indicated in Figure 5.2) were also added to the computer-readable copy as well as other annotations like <§> designating new paragraphs, since spacing of this type needs to be more clearly represented in digital formats. Moreover, there are other aspects of the corpus design which comply broadly with the Open Language Archives Community (OLAC) (www.language-archives.org/OLAC/metadata.html) and Dublin Core (DC) (http://dublincore.org/documents/dces/) guidelines on corpus metadata, such as providing a detailed description of the electronic resource and how it relates to the original manuscript version at UCD. NFCSAC does not, however, adhere to all fifteen elements defined in DC. This is hardly surprising, though, since the digitisation process ended in 1993 and thus pre-dates these 1995 standards.
The NFCSAC corpus was always intended to be private so issues of rights and the kinds of human subject documentation advocated in Kretzschmar et al. (Reference Kretzschmar, Anderson, Beal, Corrigan, Opas-Hänninen and Plichta2006) and DC/OLAC played a marginal role in its design (cf. Bauer Reference Bauer, Chambers, Trudgill and Schilling-Estes2002: 98–9). In addition, NFCSAC remains as a plain text version with manual additions of diamond bracketed mark-up to highlight pertinent features and has never been converted to XML format,Footnote 4 despite its important benefits (see Section 3.2).
2.3 The Value of NFCSAC as a Corpus for Regional and Social Analysis
2.3.1 Analyses of NFCSAC
A significant advantage of this corpus is its potential to contribute to our understanding of the extent to which South Armagh English has been subject to change across real-time, and indeed which linguistic features do or do not index variation. To demonstrate this, I outline below a quantitative analysis of vernacular verbs. This is a well-documented feature of non-standard Englishes (see Cheshire Reference Cheshire1982) and is illustrated by NFCSAC in examples such as bruck, catched and step for broke, caught and steeped, respectively.
Figure 5.3 displays all occurrences of this variable in NFCSAC and, whilst there are some obvious peaks and troughs, the average number of tokens overall remains steady and the figures for 1942 and 1974 are almost identical. This suggests that vernacular verbs in South Armagh English are particularly well integrated in the grammars of Murphy’s participants. As such, they seem to be one of the few morpho-syntactic features examined in Corrigan (Reference Corrigan1997) that do not index societal change in SA.

Figure 5.3: Occurrence of vernacular verbs for all informants (N = Frequency of occurrence per 1,000 words per year).
2.3.2 Summary
As outlined in the analysis sketched in Section 2.3.1 and in Corrigan (Reference Corrigan1997), despite the issues already described, NFCSAC has proved to be an invaluable resource for the analysis of constraints operating on the development of South Armagh English from the 1940s to the 1970s. Moreover, the data has also been successfully used to test theoretical models of language acquisition, contact and (parametric) variation so that the considerable ‘labour and expense’ in Sinclair’s (Reference Sinclair and Wynne2005) terms associated with NFCSAC’s creation (which Sinclair warns against for this reason) have indeed been worthwhile.
3. The Diachronic Electronic Corpus of Tyneside English
The second corpus discussed in this paper, DECTE (Corrigan et al. 2012), was formed by amalgamating datasets dating back to the late 1960s. Unlike NFCSAC, DECTE is a public corpus and is not sample but monitor in nature. It currently consists of audio recordings, transcriptions, and associated material related to three different research projects: (i) the Tyneside Linguistic Survey (TLS) (1971–2), (ii) the Phonological Variation and Change in Contemporary Spoken British English (PVC) project (1994–7) and (iii) the Newcastle Electronic Corpus of Tyneside English 2 (NECTE2). The last of these three began in 2007 and has a broader geographical reach than either the TLS or PVC (see Figure 5.4). From 2001 to 2005, the TLS and PVC datasets were updated to form the Newcastle Electronic Corpus of Tyneside English (NECTE), a single enhanced XML-encoded and aligned corpus that conformed to the standards established by the TEI for the digital representation of documents. DECTE is also an XML, TEI-compliant corpus and was formed by amalgamating NECTE and NECTE2. This enhances DECTE’s sustainability as well as its interoperability in ways that will be discussed in Section 3.2.

Figure 5.4: North East Map indicating the locations of DECTE interviews.
3.1 Corpus Dimensions and Representativeness
Table 5.2 and the accompanying notes outline the dimensions of DECTE and summarise the dates of interviews, genders of the interviewees, and number of words in the transcriptions/hours in the audio recordings. Although DECTE’s current size is small by comparison to mega-corpora like the CNN corpus (Hoffman Reference Hoffman, Hundt, Nadja and Biewer2007), it is considerably larger than the NFCSAC, for instance, which acted as a starting point for DECTE’s design. Thus, it shares NFCSAC’s key characteristics of being a regionally delimited corpus, comprising speech data from males and females recorded in real-time. However, it surpasses NFCSAC not only in terms of their relative dimensions to one another, but also because the speech data that DECTE contains was sampled using strict sociolinguistic criteria to ensure representativeness. Murphy, described as the last of the ‘uneducated intellectuals’ in the South Ulster area, will have been entirely unaware of such criteria (Murphy Reference Murphy2012). While the original data sample for the TLS is not replicated in DECTE for reasons that relate to its legacy status, the surviving material, in terms of its dimensions and its balance between genders, is comparable to that of the PVC dataset. This similarity has allowed certain kinds of longitudinal comparisons of sociolinguistic variants to be successfully undertaken (see Barnfield and Buchstaller Reference Barnfield and Buchstaller2010; Beal and Corrigan Reference Beal, Corrigan, Elspass, Langer, Scharloth and Vandenbussche2007; Moisl and Maguire Reference Hermann and Maguire2008; Fehringer and Corrigan Reference Fehringer and Corrigan2015). As Table 5.2 summarises, DECTE comprises three separate sub-corpora (TLS/PVC/NECTE2) containing ninety-nine interviews with a grand total of 160 informants. We also have access to additional data from the TLS and NECTE2 sub-corpora, which are in the process of being XML-encoded, but are not yet complete. For the former, this is because new materials have only recently come to light and for the latter, this is because up to ninety new interviews are conducted to augment NECTE2 each year since the monitor phase of the corpus began in 2007, and only those between then and 2013 had been XML-encoded at the time of writing.Footnote 5
Table 5.2: DECTE’s composition.
| DECTE | Components | |||
|---|---|---|---|---|
| TLS | PVC | NECTE2 | ||
| Recording Dates | 1971–2013 | 1971–1972 | 1994 | 2007–2013 |
| XML-encoded Corpus | ||||
| Interviews | 99 | 37* | 18 | 44 |
| Words | 804,266 | 229,909 | 208,295 | 366,062 |
| Audio (hrs:min:sec) | 71:45:43 | 22:53:55 | 17:34:25 | 31:17:23 |
| Informants† | 160 | 37 | 35 | 88 |
| Female | 87 | 20 | 18 | 49 |
| Male | 73 | 17 | 17 | 39 |
| Full Collections | ||||
| Interviews | 588 | 88* | 482 | |
| Words | c. 4.7 million | c. 584,000 | as above | c. 3.9 million |
| Audio | c. 408 hours | c. 60 hours | c. 330 hours | |
* The TLS corpus also contains seven phonetic transcriptions of Newcastle informants. There are no orthographic transcriptions or audio recordings for these interviews, so they are not included here.
† The PVC and NECTE2 interviews have two informants per interview, while the TLS has one. There are thirty-five (rather than thirty-six) informants recorded for the eighteen PVC interviews because one participant was recorded twice.
3.2 Digitisation, Annotation, and Metadata
The digitisation and annotation processes surrounding DECTE’s construction have already received considerable attention (see Allen et al. Reference Allen, Beal, Corrigan, Maguire, Moisl, Beal, Corrigan and Moisl2007; D’Arcy Reference D’Arcy, Maguire and McMahon2011; McEnery and Hardie Reference McEnery and Andrew2012; and Mearns (Reference 126Mearns and Hickey2015); as well as: http://research.ncl.ac.uk/necte/documentation.htm and http://research.ncl.ac.uk/decte/documentation.htm). As far as digitisation is concerned, a key issue was how to handle the analogue reel-to-reel recordings associated with the TLS. The state in which the materials were found is an excellent example of what Widdowson (Reference Widdowson1999) describes as neglected archival data. All the TLS recordings included in NECTE were digitised in WAV format at 12000 Hz 16-bit mono and were enhanced to counter the ‘meltdown’ (Widdowson Reference Widdowson1999: 84) of the originals by amplitude adjustment, graphic equalisation, clip/hiss elimination, as well as speed regularisation. This strategy improved the audio files considerably to the point where it has become possible to analyse the materials using tools like CLAN, PRAAT and WinPitch (see Amand Reference Amand2014; Martin Reference Martin2013; and Parisse Reference Parisse2013).
As far as annotation is concerned, an important objective of the NECTE initiative was to provide a fully searchable, grammatically tagged corpus, in which the audio files and orthographic transcriptions were linked. Given the fact that this sociolinguistically sampled corpus, by comparison to NFCSAC, was to be a public corpus, and costly to produce, it was crucial to ensure that the end result was sustainable on the one hand and interoperable on the other, so that it could be searched alongside other datasets like the Scottish Corpus of Texts and Speech (see www.gla.ac.uk/schools/critical/research/fundedresearchprojects/enroller/). As such, it was decided to encode the data for ‘distribution following standards established by corpus linguistics’ (McEnery and Hardie Reference McEnery and Andrew2012: 117). Thus, we chose TEI-compliant XML as the basis for the mark-up and subjected the orthographic transcripts to part-of-speech (POS) tagging. Having reviewed the full range of software available, the Constituent Likelihood Automatic Word-Tagging System (CLAWS), was selected. This is a grammatical tagger developed for annotating speech in the British National Corpus (BNC) (see Beal et al. Reference Beal, Corrigan, Rayson, Smith, Meurman-Solin, Anneli and Arja Nurmi2007 and http://ucrel.lancs.ac.uk/claws/). It fulfilled our requirements as a mature system, consistently achieving an accuracy rate of over 96 per cent.
In the first instance, the CLAWS lexicon was expanded to accommodate items not in the BNC, such as the verb gan (equivalent to the standard verb ‘go’). Given the fact that CLAWS was originally designed to be used on standardised (written) texts, the tag ‘FU’ also had to be created for coping with speech phenomena that cannot be lemmatised like that which Murphy annotated as <…..> in (1). The CLAWS (C8) tagset, prior to its application to NECTE, did not have a specific tag to represent discourse pragmatic markers (DPMs) either, for exactly the same reason, since they do not constitute a discrete grammatical category that was easily recognisable by such software. The solution was to expand the application of an already existing tag, namely ‘UH’, which was originally applied to interjections in the BNC, so that it could also identify the DPMs illustrated in Figure 5.5 from Beal et al. (Reference Beal, Corrigan, Rayson, Smith, Meurman-Solin, Anneli and Arja Nurmi2007).

Figure 5.5: Concordance list identifying discourse markers in NECTE.
The entire corpus was then POS tagged by the CLAWS4/Template taggers using the UCREL C8 tagset, and output samples were proof-read. Because the corpus was much smaller and more dialectally homogeneous than the BNC, it offered greater opportunities for identifying issues created by automatic tagging. Naturally, the process also entailed arriving at solutions to accommodate the anomalies with the bonus that they could then be subsequently applied to the annotation of other corpora.
The public nature of DECTE presented a significant challenge with respect to the legal/ethical issues already discussed in relation to NFCSAC’s metadata. It was clear that consent for even the earliest interviews in the NECTE sub-corpus had been given for the use of the data to further research. However, only the interviewees in the NECTE2 sub-corpus gave explicit permission for their data to be downloadable. The technology was only invented in 1989, decades after the TLS project finished and a mere five years before the PVC interviews.Footnote 6 The interviewees, and any personal information by which they could be identified, can be anonymised, of course, but the fact that DECTE contains audio as well as transcribed data means that it is impossible to guarantee privacy. Moreover, as McEnery and Hardie (Reference McEnery and Andrew2012: 62–3) have argued, even corpora that have been systematically anonymised may contain text that nevertheless betrays the identity of a participant or discussant. A case in point is the conversation in (3) between <PVC16a> and <PVC16b> who both went to Newcastle’s Canning Street School. Although the teacher’s surname has been anonymised (Mr (NAME)), the surrounding context plus the personal description could well lead to his being identified:
(3) <PVC16b> … head teacher hasn’t changed at Canning Street he’s still there what’s he called Mr <pause> oh God <pause> … <interruption> Mr (NAME) <Line 0862><Informant PVC16a> mm <Line 0863><Informant PVC16b> pitch black hair <pause>
It was for these reasons that the decision was made to restrict DECTE’s availability with potential end users being asked to prove their credentials.
3.3 The Value of DECTE as a Corpus for Regional and Social Analysis
3.3.1 Analyses of DECTE
Since NECTE’s launch in 2005, datasets relating to what eventually became DECTE have been used for teaching and research at Newcastle University, as well as further afield (see Amand Reference Amand2014). The corpus has provided new insights into the relationship between language and society in north-eastern England. Moisl and Maguire (Reference Hermann and Maguire2008), for instance, used the TLS sub-corpus to identify the main phonetic determinants in the region that group speakers socially. In a similar vein, Beal and Corrigan (Reference Beal, Corrigan, Elspass, Langer, Scharloth and Vandenbussche2007) examined the trajectories of socio-syntactic change across real-time in NECTE, like those involved in relative clause marking illustrated in Figure 5.6, which they found to be both internally and externally constrained. It was clear from their longitudinal investigation that the 1890s-born informants very rarely use wh- (preferring that or zero forms) and that, whilst wh- usage increases gradually in the 1900s and 1910s-born cohorts, the most dramatic rise occurs in the speech of those born in the 1920s. Thereafter, wh- usage levels off, until the proportions for the 1950s and 1970s-born cohorts are very similar. Indeed, from the 1950s period onwards, the distribution of all three relative markers in NECTE is more or less equivalent.

Figure 5.6: Relative marking in NECTE by birth decade.
Real-time changes like these can, of course, be even more revealing when they are viewed across the entire time depth of DECTE (namely, to include NECTE2) and this has been very nicely demonstrated in Barnfield and Buchstaller’s (Reference Barnfield and Buchstaller2010) investigation of longitudinal change in the intensification system (Figure 5.7). It shows that both really and dead increased in frequency between the 1960s and 1990s and, while usage of the latter drops off dramatically in the twenty-first century, the former continues to compete with very as a popular intensifier.

Figure 5.7: Rates of intensifier usage in DECTE (1960s–2000s).
Even more recently, DECTE has been used by researchers from a comparative sociolinguistic perspective (Tagliamonte Reference Tagliamonte, Chambers, Trudgill and Schilling-Estes2004) to examine language variation and change cross-dialectally, permitting a view on north-eastern English that accounts not only for local trends but also examines the extent to which speakers there follow global changes (Childs et al. (2015), Fehringer and Corrigan [in press]).
3.3.2 Summary
Since impact is increasingly viewed as a measure of success with respect to research output, the fact that requests to use DECTE by scholars have come from all corners of the globe demonstrates its reach.Footnote 7 This access has led to other important research contributions, in addition to those already outlined, that have brought insights in the fields of regional and social analyses as well as beyond these (see, e.g., Martin Reference Martin2013; and Parisse Reference Parisse2013). The scholarship that has been built on DECTE is a testament to its utility and is also a pay-off for the considerable investment that the corpus has required. There is always room for improvement, of course, and the team have their sights fixed on revisions like upgrading the interface so as to make it more suitable for users of iPhones (see Mehl et al. Reference Mehl, Wallis, Aarts, Corrigan and Mearns2016).
4. Conclusion
Although NFCSAC and DECTE are very divergent corpus building enterprises in terms of their aims, this chapter has demonstrated that there are points of congruence with respect to their design. In addition, while there have been challenges associated with their creation, each of them can be regarded as having achieved some measure of success, however that might be defined. Key issues that have arisen in the discussion are the importance of documenting, digitising and enhancing archival data so that it can be re-purposed and used longer-term. There is also the need to make the most of automated tools for annotation and, of course, to bear in mind that these techniques will in the end require some level of manual checking. Sociolinguists interested in the analysis of variation must also engage with computational linguists and software developers so that the valuable annotations they require for marking up ‘real language’ in Tagliamonte’s (Reference Tagliamonte, Beal, Corrigan and Moisl2007) terms are allowed for in the available technology, as advocated by Smith et al. (Reference Smith, Hoffman and Rayson2008). The abundant, though idiosyncratic, annotation applied to NFCSAC has been retained so that, to the present day, I can locate every relative clause marker (even those which are zero). However, the annotation information on relative clause marking developed for Beal and Corrigan’s (Reference Beal, Corrigan, Elspass, Langer, Scharloth and Vandenbussche2007) analysis of relativisation in the north-eastern data that eventually became DECTE could not be retained. This was because the kind of eclectic mark-up invented during earlier transcription phases denoting such additional grammatical information (affectionately known as ‘cockroaches’ and ‘pesky critters’ – see Beal et al. Reference Beal, Corrigan, Rayson, Smith, Meurman-Solin, Anneli and Arja Nurmi2007) was sacrificed for the greater good of a TEI-compliant XML corpus, because there simply was no mechanism for preserving such unconventional interpretive information.
This chapter also serves as a timely reminder to researchers who are increasingly striving towards ‘big data’ that developing good practices with respect to the ethical treatment of linguistic materials, whether or not they are subject to legislative protection already, is ever more crucial. Corpus creators require protocols for the ethical treatment of human subjects, such as that advocated in Kretzschmar et al. (Reference Kretzschmar, Anderson, Beal, Corrigan, Opas-Hänninen and Plichta2006), and more research is needed to better understand the ethical issues surrounding corpus construction and use, particularly with respect to the increasingly large collections of legacy data which are being re-purposed for linguistic applications (see Hasund Reference Hasund and Renouf1998; McEnery and Hardie Reference McEnery and Andrew2012: 57–70; and Rock Reference Rock2001).
As Bender and Good (Reference Bender and Good2010: 1) are keen to point out, scaling up the kinds of datasets normally used is crucial if we are to meet what they describe as its ‘grand challenge’ of integrating theoretical frameworks and analytical approaches from various sub-fields of linguistics, including ‘language in social interaction’, an important sub-theme of this chapter and indeed of this volume as a whole. In the same way that I have already noted the importance of accounting for the legal/ethical implications of legacy datasets like those described here, ‘big data’ initiatives that target corpora for regional and social analyses also need to remain respectful of the different social dynamics which pertain across communities. These factors must not be lost sight of when striving to collect and share datasets on a significantly grander scale than those described here (see also Kendall Reference Kendall and Gries2011). A balance needs to be struck between being in a position to mine megacorpora, and fully understanding the very unique social and regional contexts from which the constituent corpora derive.
1. Introduction
This chapter describes the innovative approach to dialect study that underpins the Language, History, Place project: a research, teaching, and public engagement initiative that brings together materials from an existing language and cultural heritage archive, the Leeds Archive of Vernacular Culture (LAVC), with real-life objects in the museum setting. The chapter explores the substantial research opportunities and benefits offered by reuniting tangible with intangible heritage; it discusses the intellectual and methodological challenges associated with trying to reuse archive data for purposes not originally envisaged, and investigates the possibility of augmenting the archive by inviting visitors to contribute their own linguistic heritage through various enactive engagement activities. The paper seeks to address a number of questions: what is and is not possible, defensible, or allowable within the parameters of publicly engaged sociolinguistic research? Is it possible to collect useful research data using such methods, whilst at the same time significantly enriching museum collections and providing an enhanced, enjoyable, and stimulating visitor experience? Must historical archives such as the LAVC remain closed, completed repositories or can they be open, dynamic resources that we reuse, reframe, and repurpose, and to which new materials are added?
2. The LAVC: An Historic Archive
The Leeds Archive of Vernacular Culture is a unique multimedia archive collection relating to the study of dialect and folk life in England. It is derived from two main sources: materials from the Survey of English Dialects (SED) developed by Harold Orton and Eugen Dieth during the 1950s and 1960s (see Orton and Dieth Reference Orton and Dieth1971; Sanderson and Widdowson Reference Sanderson and Widdowson1987; Upton et al.Reference Upton, Parry and Widdowson1994; Upton and Widdowson Reference Upton and Widdowson2013) and materials from the former Institute of Dialect and Folk Life Studies (IDFLS). Following the closure of the IDFLS in 1983, the SED and IDFLS archives were rather neglected, before being relocated to the University of Leeds Brotherton Library’s Special Collections in the early 1990s. A successful bid to the AHRB’s Resource Enhancement scheme in 2002, designed to make the collections ‘accessible to researchers and ensure their long term preservation’ (University of Leeds 2014), facilitated the development of a detailed catalogue for the renamed Leeds Archive of Vernacular Culture collection (Wiltshire and Jenner Reference Wiltshire and Kathryn2005), and the digitisation of an extensive range of sound recordings. A tantalising sample of twenty-three digitised photographs and sixteen audio files was made available on the project website in order to indicate the types of material held in the archive.
The LAVC contains all the materials associated with the SED, both published and unpublished, including nine subject-specific books containing the responses to the Survey’s 1,300 questions (administered in 313 locations). This material also comprises all the fieldworkers’ notebooks (a fascinating record of sociolinguistic research from a previous era before audio recordings in the field were routine), word maps showing dialect isoglosses, the Basic and Incidental Materials, and a series of photographs commissioned as part of the Survey (taken by renowned ethnographical photographer Werner Kissling). With advances in audio technology, it became increasingly possible to capture recordings in the field, hence some of the original locations and contributors were later revisited, and a series of informal conversations on home, farm, and working life were recorded as a complement to the original Survey materials, between the original survey and the early 1970s. The LAVC also contains the outputs from the IDFLS, also based at the University of Leeds, which, originally under the direction of Stewart Sanderson, operated from 1964 until the early 1980s. In total, the archive comprises some 2,000 photographs, over 900 audio recordings, more than 220 student theses and dissertations, myriad research papers, newspaper cuttings, administrative records, and Survey and Institute correspondence. All were collected over a period of thirty years and provide exceptional insights into language, culture and everyday life in twentieth-century England.
Unquestionably, the LAVC is a marvellous and exciting collection; but despite the 2002–5 project’s cataloguing of the archive, and its digitisation of the sound recordings (some of which are available via the British Library’s sound archive website (see http://sounds.bl.uk/Accents-and-dialects/Survey-of-English-dialects), the collection remains locked away in Special Collections – safely preserved but largely inaccessible to, and unused by, the communities from which its rich dialect and cultural materials were collected. Visitors can, of course, make appointments to consult it (and the LAVC catalogue has made it possible to map the scope of the archive, and to locate specific resources), but, realistically, only bona-fide academic researchers, or determined and motivated individual members of the public, are ever likely to access it. Consequently, the archive is underused and underpublicised, a fate that befalls all too many of our important collections. Its status has thus diminished over time and, like many other such resources, although carefully preserved, it is in danger of becoming a historical artefact and linguistic reliquary.Footnote 1
3. The Language, History, Place Project: An Archive Reborn
The Language, History, Place project seeks to breathe new life into the LAVC by using the archive as a catalyst for new research and teaching activities, coupled with public engagement initiatives within the communities from which the archive materials originally came. The project embraces the UK’s National Coordinating Centre for Public Engagement (NCCPE)’s (2014) definition of public engagement as: ‘the myriad of ways in which the activity and benefits of higher education and research can be shared with the public. Engagement is by definition a two-way process, involving interaction and listening, with the goal of generating mutual benefit’. The project is based on a partnership, established in 2009, between the School of English at the University of Leeds, the Brotherton Library’s Special Collections, and three Yorkshire museums: the Dales Countryside Museum in Hawes, the Ryedale Folk Museum in Hutton-le-Hole, and the Shibden Hall Folk Museum outside Halifax. To date, project activities have been a six-month Museum Library and Archive (MLA) Council-funded pilot (2010), and various undergraduate student research opportunities at the University of Leeds, such as a research scholarship (2010), the Language, Identity and Community option module (2011 onwards), and final year dissertations (2014).
The museums are located in different parts of Yorkshire, and each seeks to reflect the area’s local culture and heritage. Though different in character, governance, and funding structures, all have vernacular culture or folk lifeFootnote 2 collections centring on traditional ways of life and everyday objects that might once have been found in the home, on the farm, or in a craftsman’s workshop. Whereas the museum collections and displays focus on ‘tangible heritage’, as manifested by historical artefacts, the LAVC contains complementary and contemporaneous ‘intangible heritage’Footnote 3 materials, with especial strengths in ‘oral traditions and expressions, including language as a vehicle of the intangible cultural heritage’ (UNESCO 2003). Many folk museums, including the three Yorkshire partners, have their origins in the post-war period, especially during the 1950s and early 1960s,Footnote 4 when vernacular culture collections were often assembled in response to the perceived threats of increased industrialisation (Smith Reference Smith2012). Thus, as the SED and IDFLS were busy collecting ‘genuine’ dialect from older, ‘ordinary’ people in mainly rural locations, with a view to preserving it for future generations before it was irrevocably changed by increasing social and geographical mobility, the folk life museums were simultaneously gathering the everyday objects that were rapidly becoming, or were already, obsolete and in danger of being lost forever.
The Language, History, Place project aims to open up the very substantial archives of the LAVC to much wider audiences by marrying digitised copies of archive materials with the physical artefacts to which they relate within these museums, hence returning them to the local community context. Not only does this enrich the museums’ displays and enhance the visitor experience, it also puts these resources back into the communities from whence they came, upholding Wolfram’s (Reference Wolfram1993) principle of linguistic gratuity (see also Wolfram et al. Reference Wolfram, Reaser and Vaughn2008; Wolfram Reference Wolfram2010, Reference Wolfram2012). To date, use of the LAVC has been largely restricted to the academic community. But given its cultural, historic, and linguistic importance, it is not only desirable, but ethically responsible, to ensure that its resources are made accessible to a wider and non-specialist audience. After all, these materials were collected from local communities. It is their voices that speak on the audio recordings, their pronunciations, and their words for everyday objects that were collected and analysed, their customs, beliefs and ways of life that are documented by the extensive photographic and folk life collections. By locking these resources up in academic repositories, treating them as artefacts of a bygone age, and separating them from the way of life they describe as well as their communities of origin, we lose much of their vital energy and significance.
By uniting the LAVC’s language and other resources with the museums’ physical artefacts, we have the opportunity to unlock meaning and reawaken connections. Language has the power to connect us with places and history, and with remote or unfamiliar cultural heritage. There is something powerfully evocative about hearing voices from the past, or learning about the unfamiliar words people used for everyday objects of a bygone age, that connects us to the original community. As Anderson (Reference 143Anderson1991: 145) says: ‘nothing connects us affectively to the dead more than language’. Voices from the past may be in the form of dialect recordings, such as those from the LAVC, or oral history recordings held in museums, libraries, or oral history archives; both can provide valuable data for the sociolinguist (e.g. Maguire’s (Reference Maguire2014) Dialect of the Holy Island of Lindisfarne (DHIL) corpus, Moore’s (Reference Moore2010) Scilly Voices project (see Sections 1 and 3 of this volume respectively), and Leach’s (Reference Leach2014) work with Stoke-on-Trent museums on Voices of the Potteries. Miller (Reference Miller2008) argues for everyday objects as important means by which people connect with both the past and human relationships; ‘the “past” is embodied and commodified in the things that people buy and use’ (Shove et al. Reference Shove, Trentman and Wilk2009: 7). By reuniting tangible and intangible heritage, bringing together the language, stories, voices, and visual representations of the past with the physical objects they describe, and doing so within the communities from which they originated, both the LAVC and museum collections gain new meaning and salience. To quote one of the museum directors: ‘your language resources will make our objects sing’.
4. Enactive Engagement in the Museum Contact Zone
Museums have much in common with academic archives: both are safe places for the long-term storage, curation, and preservation of historical collections, and both are loci of trusted knowledge and institutional authority; but unless carefully managed and reinvigorated, each runs the risk of having collections that become static and moribund. In the case of the partner folk life museums, their fascinating collections of everyday objects from the past represent earlier ways of life that grow increasingly remote from visitors’ experience with each passing year. Smith (Reference Smith2012: 56) argues that such museums face significant problems as the passage of time results in artefacts becoming ‘divorced from the intangible cultural heritage that gave them significance’.
As is often the case in folk life museums, objects are displayed as they might have been found in situ, not locked away in glass cases and given scholarly labels, but located in reconstructed rooms and workshops and presented as though the person had just stepped out for a moment, leaving their tools or everyday objects behind them. Despite these naturalised settings, folk life museums have to work hard to make their collections relevant and meaningful to present-day audiences. Because there is little traditional written interpretation in the form of labels, visitors are required to have ‘cultural competence’ (McIntosh and Prentice Reference McIntosh and Prentice1999: 591) – which entails having a cultural, historical, cognitive, and sensory competence that enables them to experience the display in a way that is understandable, stimulating, and satisfying. In short, without detailed interpretative labels attached to each object, people need to be able to draw on their own ‘funds of knowledge’ (González et al. 2005) to help them make sense of the artefacts. ‘Funds of knowledge’ are acquired on the basis of lived experience, and may be particular to family or local life. An important cultural resource, they are often passed down the generations, but can be damaged or lost by cultural or temporal dislocation (Vélez-Ibáñez and Greenberg Reference Vélez-Ibáñez, Greenberg, González, Moll and Cathy2005).
When originally established in the 1950s and 60s, folk life museums could rely on some of their visitors being able to recognise objects from their childhood, bringing their own life experiences to bear on interpreting the displays. With time, however, fewer and fewer visitors can be expected to make sense of objects that represent a culture of which they have little or no direct experience; in short, their ‘funds of knowledge’ have been lost, and they are disconnected from the past and its associated cultural heritage. Craftsmen’s tools used by blacksmiths, coopers, saddlers, and wheelwrights, commonplace objects associated with domestic routines such as dairying and laundry, implements from rural life, farming, and agriculture – all of this tangible heritage can mean little to the present-day museum visitor. The objects themselves, though interesting, are seldom especially beautiful or valuable; these are the bits and pieces of everyday life from a bygone era, not aesthetically prized, and it would be easy to dismiss them as dull and uninteresting, ‘a pile of rusty old stuff’. This situation presents significant challenges to the museums: how can they best engage with visitors who do not have the requisite cultural competence, and for whom the objects displayed and ways of life represented are remote, unfamiliar, and difficult to relate to?
One powerful means of doing so is via ‘enactive engagement’ (Hooper-Greenhill Reference Hooper-Greenhill1994), which some would argue is essential in folk life and living museums. Enactive engagement is ‘the opportunity … for visitors to participate themselves, and become part of the exhibition experience, rather than act as passive bystanders’. This harnesses the potential of the ‘nostalgic memories that visitors share and may transmit to one another’ and to staff, demonstrating the evocative power of stories that have been passed down the generations (Wilks and Kelly Reference Wilks and Kelly2008: 132–5). In so doing, visitors are helping to generate meaning, and the whole experience becomes a ‘collective activity’ with both personal and interpersonal significance. Whereas individuals can transmit their memories simply by talking about them first-hand, Halbwachs (Reference Halbwachs1925) argued that a community’s ‘social’ or ‘collective’ memory is more disconnected from original events. Importantly for the Language, History, Place project, story-telling, objects, and a sense of place can help to remake these connections (Halbwachs Reference Halbwachs1925; Connerton Reference Connerton1989; Fentress and Wickham Reference Fentress and Chris1992; Feld and Basso Reference Feld and Basso1996; Winter Reference Winter2009; Crane Reference Crane and Macdonald2011). Crucially, social memory is ‘an active and ongoing process’ (Van Dyke and Alcock Reference Van Dyke, Alcock, Van Dyke and Alcock2003: 3), so by offering visitors these opportunities, it is possible to maintain a dynamic dialogue between past and present.
Clifford (Reference Clifford and Clifford1997) conceptualises museums as ‘contact zones’,Footnote 5 places of ‘encounter’, with permeable walls, where communities, cultures, and the museum itself interact, intersect, and influence each other. Though the theory has since been challenged (most especially by the work of Bennett Reference Bennett1998, see also Dibley Reference Dibley2005), reworked and revisited (Macdonald 2002; Boast Reference Boast2011; Onciul Reference Onciul, Golding and Modest2013; Schorch Reference Schorch2013), it remains an influential, pervasive, and productive concept (Peers and Brown Reference Peers, Alison, Peers and Brown2003; Crooke Reference Crooke2007). The 2011 conference, Revisiting the Contact Zone: Museums, Theory, Practice, established the theory as significant for ongoing debates. The contact zone’s emphases on dialogic encounter and the role of the visitor (Witcomb Reference 146Witcomb2003; Mason Reference Mason and Macdonald2011) have particular importance for the Language, History, Place project. The Leeds project’s partner museums are places where meanings and significations can be negotiated and co-created by encounters between visitors, staff, space, objects, and ideas (Hennes Reference Hennes2010). Peers and Brown (Reference Peers, Alison, Peers and Brown2003: 4) argue that artefacts function as ‘contact zones’, both as ‘sources of knowledge’ and ‘catalysts for new relationships – both within and between … communities’. This dialogic dynamism is also characteristic of intangible cultural heritage, which UNESCO (2003) characterises as being ‘transmitted from generation to generation’, ‘constantly recreated by communities’ and providing them with ‘a sense of identity and continuity’. It represents both past ‘inherited traditions’ and ‘contemporary urban and rural practices in which diverse cultural groups take part’ (UNESCO 2014).
Visitors bring to the contact zone their own ideas, funds of knowledge, narratives, memories, and cultural heritage; in so doing, they create new meanings, new ideas, and new intersections. Crucially for the Language, History, Place project, they also bring their own linguistic heritage, identities, and practices; this gives them a way in to interpreting unfamiliar cultural heritage (e.g. by hearing voices from the past which bring the museum objects to life), and also means they have something valuable to contribute within the contact zone.
So, the project goes beyond reuniting tangible and intangible heritage, important though that is. The purpose is not just to make the LAVC’s existing academic research data and cultural resources available to museum communities, and to the wider public, through the enrichment of museum displays (both physical and virtual/online exhibitions) by combination with museum artefacts; it also aims to use these resources as a stimulus, creating a range of public engagement opportunities that both enhance the visitor experience and enable us to collect new present-day language data from visitors. By harnessing the potential of enactive engagement within the museum context, we can help visitors to (re)connect with a sense of themselves, their heritage, their history, their language, and their sense of place and identity. The experience is participatory in the fullest sense, given that the visitors are invited to share their present-day language with us, for the benefit of other visitors, the museums and their displays, and the ongoing research project.
With time, as the gap widens between the objects displayed in these museums and the cultural competence of visitors, and as funds of knowledge are lost (Vélez-Ibáñez and Greenberg Reference Vélez-Ibáñez, Greenberg, González, Moll and Cathy2005), this type of activity is likely to increase in importance. In many cases, they are what we might term ‘privileged encounters’ – privileged because they occur within that specific space owing to the convergence of particular circumstances, social actors, and stimuli. In other words, without the co-presence in the museum space of people and objects, we are unlikely to glean many of these stories, and the associated language practice. Without the museum context to reunite tangible and intangible heritage, many of these conversations would never happen, and the discovery of a shared cultural inheritance and distinctive linguistic practice would be lost to researchers and visitors forever.
5. Transformative Encounters for All
Hennes (Reference Hennes2010) emphasises the potentially transformative importance of these encounters in the museum context. By focusing attention on the objects in front of them, by spending time engaging with and thinking about the ideas and stories presented, visitors may discover things they have repressed or not yet realised. By making sense of the exhibition, it may also transpire that they are able to make sense of themselves in relation to it. By giving to the process, they gain from it. There are clear benefits such as a more enjoyable and memorable museum visit, because one has taken part in something meaningful rather than simply consuming the thoughts or narratives of others. There may also be educational benefits, given that activities can be designed to inform as well as to engage. If other visitors are simultaneously engaged in the same activity, then as a group they may begin to uncover shared ideas, narratives, and cultural or linguistic heritage. Even where visitors have no immediate connection to the objects and ideas presented, they are still likely to be discussing and reacting to what they see, hear, and experience within the museum space. If invited to consider thematic topics, such as home life or domestic objects as well as history and place, everyone has an opportunity to contribute and to have their contribution valued (see Pahl and Pollard Reference Pahl and Pollard2010; Pahl and Roswell Reference Pahl and Pollard2010; Pahl Reference Pahl2012). In this way, even visitors with no geographical or cultural links to the museum’s artefacts can become involved with what is on offer. Properly managed, enactive engagement is an inclusive rather than exclusive experience.
6. Language Research in the Museum
The Language, History, Place project’s emphasis on language gives all visitors a point of entry, regardless of background or education, because it is something that most of us use daily, to which we can easily relate, and to which we can all contribute. Language is an important part of our identities: it says much about who we are, where we come from, what we value. As the chapters in this volume show, it gives us a sense of place and history. Language also connects us to others within the community in the present-day, so it has a horizontal as well as vertical reach: ‘there is a special kind of contemporaneous community which language alone suggests’ (Anderson Reference 143Anderson1991: 145). It is simultaneously inclusive and exclusive: inclusive because it gives us a sense of belonging; exclusive because it underlines difference. Both sides of the coin offer enactive engagement opportunities: familiarity stimulates discussion around similarities to visitors’ own varieties; difference often prompts them to supply their own words, sayings and pronunciations. Most people are very willing to discuss their language use and that of others, their linguistic likes and dislikes, favourite words and accents, and generally they enjoy doing so. Thoughtfully harnessed, all of this can provide valuable data for language research, as well as enhancing the visitor experience and museum displays. All we have to do is collect it – but how best to do so? What are the opportunities and challenges of gathering language data in this context, and how do we address issues of comparability with earlier datasets such as those of the LAVC?
7. Challenges, Opportunities and Comparability
In most types of research involving the collection or analysis of sociolinguistic material, data integrity and robustness are usually deemed essential, and researchers will go to considerable lengths to preselect data samples, control variables, and ensure consistency. What does this mean for the reuse of legacy archive data in sociolinguistic research alongside the collection of new, present-day language data from museum visitors?
Firstly, there is the question of how best to reconcile the existing and new datasets so as to ensure comparability. What were the data collection protocols for the original studies, and which parameters should inform the new data collection strategies? How can comparability across two different datasets, collected for different purposes over different time periods, and according to different conventions, be achieved? Other sociolinguistic research projects which reuse and augment legacy data have faced similar issues, for example the Diachronic Electronic Corpus of Tyneside English (DECTE)Footnote 6 (Beal Reference Beal2009; Corrigan et al. Reference Corrigan, Buchstaller, Mearns and Moisl2012; Beal and Corrigan Reference Beal, Corrigan, Mallinson, Childs and Van Herk2013, and Corrigan, Chapter 5, this volume). Secondly, there is the question of the extent to which it is possible to add to the archive by using self-selecting contributors whilst still maintaining representativeness. Thirdly, there is the matter of the logistical and methodological mechanics of collecting language data from museum visitors.
Traditional dialectology, of which the SED is a good example, was largely concerned with tracing connections between dialect and older forms of the language, so it had a strong historical dimension. Although such work is valuable, and provides useful historical comparisons for present-day language researchers, it has been criticised for being unrepresentative, most especially because it offers only limited information about variability within individual speech communities, as in most cases only a few and the ‘best’ dialect speakers were selected for inclusion (Chambers and Trudgill Reference Chambers and Trudgill1998; Foulkes and Docherty Reference Foulkes, Docherty and Britain2007). Representativeness was never the aim of the SED, and the data collection methods favoured older, predominantly male, speakers from rural communities in the belief that they would best represent the ‘pure’ dialect forms of the past. The Language, History, Place project does not seek to be a present-day SED. Influential and significant as it was and still is, the SED is not without its flaws. The questionnaire format is both expensive and time-consuming to administer, and it yields data with its own idiosyncrasies and problems. SED participants were selected, not on the basis of being a representative sample of the overall population, but according to the rather dubious criterion of the state of their dentition:
The informants themselves were predominantly natives from rural communities, with preference being given to those who had spent little or no time away from their home village, to males (who were less inclined to correct their speech) and to those who were intelligent and had a good set of teeth (!)
Unless the present-day data collection activities were to reproduce the SED methodologies and sampling regime, absolute data comparability cannot be guaranteed. But, as already discussed, working within the museum context via interactive public engagement activities, it is not desirable to exclude swathes of visitors on the basis of their social/cultural background, geographical origins, age, or indeed on the state of their teeth! To what extent, then, is it possible to undertake useful sociolinguistic analysis if you are not in a position to select and control the sample?
Many sociolinguistic studies aim to have fixed proportions of specific age-groups, genders, socio-economic profiles and so on (see chapters on methodology in Mallinson et al. 2013; Schilling Reference Schilling2013). Whilst such controls seem to promise more reliable data, they may unwittingly skew the final results. There are many advantages in collecting language from a self-selecting volunteer sample, rather than from a preselected and conservative group like the NORMs favoured by the SED and other traditional dialect surveys. By inviting everyone to participate, we can gain insight into the range of visitor profiles. Self-selection offers its own brand of representativeness, though like all museum work, we need to be aware of potential lacunae in socio-economic profiles. If we operated with predetermined categories based on regional and social demographic criteria, we might find they do not readily suit visitor profiles. By not excluding visitors from beyond the museum’s geographical area, and by not setting predetermined sociolinguistic criteria, we not only ensure a more inclusive visitor experience, but are likely to gain a richer and less restricted dataset. By asking visitors to submit non-intrusive accompanying metadata information (e.g. their and their parents’ place of origin and residence, an indication of age range, and other social and demographic data) whilst contributing their own language to the project, we can build the collection from the bottom up rather than by the top-down approach usually favoured in sociolinguistic studies. The dataset can be augmented as necessary by running event days, putting out special appeals, and experimenting with online crowdsourcing collection methods. We therefore have the potential to explore both synchronic and diachronic comparisons with existing and new archive data. And because the project welcomes linguistic contributions from all visitors, not just those who recognise or share the dialect varieties exhibited, or who fit predetermined sociolinguistic categories, everyone can share in the experience.
The museums likewise are keen that we research actual language use in all its rich variety as evidenced across the range of their visitors. They are not looking to preserve a community or its language in aspic, or to build exhibitions and experiences that focus only on times past. The Dales Countryside Museum, for example, is interested in current life in the Dales, which is not only about rural farming communities, but also includes the rich variety of individuals who currently live, work, and visit there. It encompasses both those with long-standing family connections to the area, and those with no family links to the Dales who may have moved there more recently, some of whom may fully or partially work from home in non-traditional Dales occupations such as finance, PR, web design, and also day-trippers and holidaymakers. In short, they are interested in both locals and incomers, or off-cumdens as the latter are known in Yorkshire. Ultimately, museums want to relate to their audiences, whoever they may be.
It is well known that elicitation techniques can have a major impact on the type and quality of data collected. The Observer’s Paradox remains a bugbear for all who try to collect language data, and eliciting casual or naturalistic language often seems to be the holy grail of sociolinguistic studies, especially for those investigating ‘non-standard’ or ‘dialect’ usage. Both individual and group data collection approaches have been used by others harnessing the opportunities offered by public engagement. The British Museum’s 2010 Evolving English exhibition used a mock telephone booth to collect language data from respondents reading aloud from Mr Tickle or a short word list (British Library b). In 2005, BBC Voices took a variety of approaches in its attempt to obtain a snapshot of language use at the start of the twenty-first century, and combined audio-recorded group interactions with individual voluntary website-elicited responses to the project’s thematically structured spidergramsFootnote 7 (Elmes Reference Elmes, Upton and Davies2013; Robinson et al. Reference 145Robinson, Herring, Gilbert, Upton and Davies2013).
Where does all of this leave us? There is clearly no one ideal method of collecting dialect data, and so the Language, History, Place project tests different methods of enactive engagement and data elicitation, using both individual and group data collection strategies to see which are the most effective in the museum context. It is hoped that collecting language data as part of a museum visit that is both enabling and enjoyable for participants makes much more feasible the eliciting of good and perhaps even naturalistic data. Visitors are likely to be relaxed and enjoying themselves. The context is fairly informal, and sharing one’s words or pronunciations for things may seem much less threatening or odd in that context than it would within a traditional academic research environment where people may feel they need to be on their best linguistic behaviour. Researcher observation suggests that, when presented with even basic LAVC stimuli in the museum, such as photographs, audio recordings, and word maps among other things, visitors often spontaneously begin to discuss and reminisce with each other, and that process of interaction yields much richer and less self-conscious linguistic data than responses to targeted questions within a controlled environment.
Activities tested by the Language, History, Place project to date, within the context of the pilot study and the undergraduate research opportunities (which enable students to carry out primary research and public engagement activities within the museum context) have been multifarious, have yielded rich research data, and have been warmly welcomed by the partner museums and their visitors. We have used a variety of stimulus materials from the LAVC to elicit present-day language from museum visitors, and set up recording stations on site, inviting people to come along and share their memories and language with us. The community links offered by the museums, both via their physical location and their extensive networks of museum friends and volunteers, present exciting and unique opportunities. By collaborating with visitors and volunteers, we have seen that encounters with artefacts and voices from the past within the museum contact zone yield new experiences and insights, and we have been able to make links between past and present. For example, we interviewed someone who remembers the original visits made to her father by Kissling and the SED researchers; some fifty years on, she was able to shed new light on SED fieldwork and photographs. Students have made an educational film about dialect for one of the museums, drawing on the first-hand experience of one of the volunteers who remembers World War II evacuees arriving in the village and their bewilderment on first encountering the local dialect variety. We have also carried out mini surveys where visitors have been invited to ‘post’ their words in the dialect letter-box. Visitors have responded enthusiastically to all of these invitations, and valuable and diverse language data has been collected in a relatively brief period. The results have been analysed and compared with existing research data (past and present), and students have written up as their work as academic essays and as accounts for lay audiences, with the latter being displayed both in the museum and online via museum blogs. In this way, students learned to work between the academic and museum environments, ‘translating’ their research for different audiences. Even activities that superficially may have seemed like ‘just a bit of fun’, such as the dialect-informed Call my Bluff Footnote 8 game run at a museum open day, have revealed the public’s appetite and enthusiasm for all things language-related. (Although primarily aimed at children, we soon found that adult visitors were keen to take part in guessing which dialect words were real and which were bluffs.) All of these activities can yield rich language data, and in ways that have benefits for all concerned.
8. The Legacy of Privileged Linguistic Encounters
The Language, History, Place project invites visitors to make a lasting contribution to both the museums and research partners, and, by extension, to the communities within which the museums are situated. By taking part in these activities, visitors contribute their language, stories, and cultural heritage to the project for the benefit of other visitors, themselves, the museums and academic researchers. Nowadays, many museums have interactive displays which encourage visitors to tell their own stories, or contribute their thoughts to a visual display; but all too often such activities, whilst fulfilling for visitors during their actual visit, lack legacy value. After a brief period on display, such contributions are all too often discarded or, if retained, put into storage or the museum archive. Simon (Reference Simon2010: 15) talks about the problem of ‘broken feedback loops’ where individuals who have contributed to participatory museum activities do not ‘see their work integrated in a timely, attractive, respectful way’, and she stresses the need for museums to think carefully about the scaffolding, parameters, flexibility, and ‘rewards’ for visitor participation. In short – contributing should count.
Further to the benefits of enactive engagement already cited, this project offers additional advantages that are linked to the focus on language and its often overlooked capacity for ensuring social inclusion. One consequence of these transformative encounters is powerful validation of the importance of the language varieties that people bring with them. All too familiar are situations where individuals have been told and believe that the language they use is ‘slang’, or somehow inferior to more prestigious standard forms. Even by labelling a variety as ‘non-standard’ or ‘dialect’, we immediately invoke, intentionally or otherwise, ideological presuppositions about value, desirability, and appropriateness. The Language, History, Place project makes no value judgements about linguistic varieties. It is not looking only for correct, proper or standard varieties. Nor, unlike the SED, is it looking only for conservative, good, broad or traditional dialect, or carefully choosing a preselected group of ‘dialect informants’. All contributions are valued equally, and for those visitors who may have previously felt or been told that their variety is non-standard, or somehow ‘substandard’, there is a validating effect in having that language seen as worthy of collection, public display, and further study. Helping visitors to discover and celebrate their individual linguistic practice and recognise its place within a larger linguistic heritage has long-lasting benefits that extend well beyond the life of any project.
By harnessing the potential of enactive engagement for dialect research within the museum, we stand to gain new knowledge as researchers, and perhaps to uncover novel, unforeseen research avenues. By enabling serendipitous, as well as planned, encounters within the museum contact zone, we open up the archive, and ourselves, to fresh insights. By encouraging the public to engage with, contribute to, and have a sense of ownership in the archive, we democratise access to these rich cultural resources. But crowdsourcing and self-selecting data collection methodologies mean we also have to relinquish some control. We may even have to go as far as modifying our traditional scholarly notions of authority and the expert. By allowing so-called non-experts or laypersons to help us reframe the archive through their encounters with it, things may get messy, or beyond our control, but this is not necessarily a negative outcome. There are undoubtedly significant implications attached to throwing open the archive doors to all, but to continue concentrating our efforts on simply preserving it and keeping most people out will bring more serious consequences, including potentially the death of the archive. Rebirthing the archive is tricky, but ultimately it can mean fresh beginnings for our carefully garnered and conserved, precious resources. Our existing archives and repositories have the potential to be reanimated and reframed – to become living, culturally significant resources that bring forth new and perhaps unforeseen research and public engagement benefits. Each encounter with the archive has the potential to change it. As researchers and custodians, it is our responsibility to enable these transformative archival interventions, to breathe new vitality into our archives, and so secure their future.
By inviting visitors to share their language with us, and by respecting them as co-creators and co-curators of knowledge, we can make this an empowering encounter for all concerned. Visitors’ contributions are a valuable and rich resource, and will help to shape our understanding of language use (and indeed museum visitor patterns and behaviour) in the twenty-first century. By asking visitors to share their linguistic heritage, we can ensure that their contributions will feed into the research, archive, and museum collections of the future. By contributing their language to the project, visitors have the opportunity to discover more about themselves, more about their cultural heritage, and to have their linguistic heritage valued, studied, and preserved. There are several ways we can keep the doors to the Language, History, Place archive open and its walls permeable:
1. By collaborating with local museums, communities, and members of the public;
2. By engaging in proper dialogue with them;
3. Via embedding our ongoing research in their collections, collective memories, and individual funds of knowledge;
4. Through ensuring they share ownership in the data we collect.
To attain these goals would be to achieve enactive engagement and linguistic research at their very best: empowering, inclusive, meaningful and with lasting legacies.
1. Introduction
In this chapter, I will discuss the role of maps and mapping techniques in the field of dialectology, exploring methods and data from Great Britain. Maps are ‘something to which very many people seem instinctively to be drawn, of which they feel they have some immediate understanding’ (Upton Reference Upton, Lameli, Kehrein and Rabanus2010: 144), and they have a long tradition in the field of dialectology. I conceive the field to include data which not only reveal what people do (data relating to production), but also data that expose what they think about what they and others do (data relating to perception). By taking this approach, I adopt an integrated folk linguistic approach to the study of language and place, following Preston (Reference Preston and Preston1999). This type of approach allows researchers to treat space as relative, acknowledging that ‘human beings live space, rather than live in space [italics in original]’ (Auer et al. Reference Auer, Hilpert, Stukenbrock, Szmrecsanyi, Auer, Hilpert, Stukenbrock and Szmrecsanyi2013: 3), and recognising that ‘our perceptions of the physical and socialised spaces around us can lead us to act and behave in differing ways’ (Britain Reference Britain, Lameli, Kehrein and Rabanus2010: 71).
Treating space as dynamic, shaped both by our interactions and perceptions, means that scholars working in the field of dialectology must avoid treating space as a ‘blank canvas’ (Britain Reference Britain, Lameli, Kehrein and Rabanus2010: 87) onto which we paint our results in the form of static maps. As noted by Tufte (Reference Tufte1990: 12), despite our living in a three-dimensional world, ‘the world portrayed on our information displays is caught up in the two-dimensionality of the endless flatlands of paper and video screen’. When visualising information, ‘escaping this flatland is an essential task’ (Tufte Reference Tufte1990: 12) in order that we better understand the world around us. Just as Nichols (Reference Nichols, Auer and Schmidt2013) has demonstrated ‘that areal linguistics has paid insufficient attention to the variable of altitude’ (Auer et al. Reference Auer, Hilpert, Stukenbrock, Szmrecsanyi, Auer, Hilpert, Stukenbrock and Szmrecsanyi2013: 11), researchers working in the field of language and place need to understand the role of language users’ ideologies and perceptions. Following Szmrecsanyi (Reference Szmrecsanyi, Auer, Hilpert, Stukenbrock and Szmrecsanyi2013: 239), I argue that these factors matter, perhaps even more so than ‘objective’ maps created by geographers.
This more nuanced understanding will not come from research that treats space, the people who live (in) that space, and the language that they use as static, according to fixed coordinate points. Instead it will be brought about from research that integrates what we know about language and place, and how they represent and signal their local belonging (e.g. Beal Reference Beal1999; Reference 167Beal2009), with the huge wealth of data available relating to how people live their lives (e.g. census data and other large-scale datasets). One way to more fully understand the relationship between language and place is to make use of technology from other fields, such as Geographical Information Systems (GIS), to bring together linguistic and other datasets. In this chapter, I will discuss data types in dialectology, before examining the ways in which technology might be used to process these types of data, and concluding the chapter with a case study that uses perceptual dialectology data and GIS.
2. Dialect Survey Data Types
Szmrecsanyi (Reference Szmrecsanyi, Seržant and Wiemar2012) has commented the science of traditional dialectology began as a result of three factors: (1) the need to test the Neogrammarian principle of exceptionless sound change (also discussed by Chambers and Trudgill Reference Chambers and Trudgill1998: 14), (2) a desire to study ‘authentic’ non-standard dialects and (3) the related will to discover the boundaries of dialect areas. In order to do this, dialectologists surveyed individuals in particular locations, either indirectly (as in the case of Ellis [Reference Ellis1889]) or directly via the use of fieldworkers (as in the Survey of English Dialects [Orton Reference Orton1962: 15–16]). In this section, I focus on data produced by traditional dialect surveys, using the Survey of English Dialects (SED) as an exemplar. In SED-type dialect surveys, the respondents were usually older males who had lived in the same (usually rural) location all of their lives.
The introduction to the SED demonstrates a clear awareness of wider sociolinguistic issues, as shown in the following observations from Orton (Reference Orton1962: 14): ‘it is amongst the rural populations that the traditional types of vernacular English are best preserved today’, and ‘in this country men speak vernacular more frequently, more consistently, and more genuinely than women’ (Reference Orton1962: 15). Nonetheless, such statements demonstrate that it was expressly not the focus of traditional dialect surveys to investigate sociolinguistic variation. Instead, dialectologists such as Orton sought to document the state of traditional dialects using a questionnaire, which resulted in a particular type and amount of data.
The SED used a network of 313 locations, chosen according to various factors, such as relative isolation of the community, the stability of the population, and the presence of natural boundaries (Orton Reference Orton1962: 15). In each location, (typically) single item responses to 1,322 questions aimed at eliciting different data types were gathered. This approach generated ‘more than 404,000 items of information’ (Upton et al. Reference Upton, Parry and Widdowson1994: v). In the case of the SED, the data have been published in various forms, from tables of data in the four volumes of the ‘Basic Materials’ (e.g. Orton and Barry Reference Orton and Barry1969), to a synthesis of these volumes in dictionary form (Upton et al. Reference Upton, Parry and Widdowson1994). Dialect atlases, discussed in the following sections, were also published.
Data gathered by the methods outlined above tie question responses to specific co-ordinate points on the basis of one respondent’s answer. This approach assumes that the respondent is representative of the location (and is as representative of the location as other respondents in the ‘panel’ of people recruited to complete the questionnaire, if one was used). Data is then catalogued for each location and used as a basis of comparison with other locations. Although representativeness is an issue here, traditional dialectological approaches produced extremely valuable resources. As a guide to the traditional dialects of English, the systematically collected data of the SED is invaluable, and has ‘provided data for linguistic enquiries of kinds undreamt of when [the SED team] began their work’ (Upton and Widdowson Reference Upton and Widdowson1996: x).
Despite the benefits of dialect survey data of this type, I argue below that its nature has led to interpretative approaches that have abandoned ideas of ‘relative space’ (Auer et al. Reference Auer, Hilpert, Stukenbrock, Szmrecsanyi, Auer, Hilpert, Stukenbrock and Szmrecsanyi2013: 3–4). Such approaches have considered only how to represent dialect forms using lines or symbols on maps, and along the way have abandoned the idea that the data we use are concerned primarily with people. In order to fully understand dialect data, methods that abandon ‘spatially sensitive’ (Britain Reference Britain, Auer and Schmidt2009: 144) approaches are insufficient. In the following sections, I will consider how both dialectologists and dialectometrists have mapped survey data, and how these approaches have neglected to consider more nuanced senses of space in their analyses.
3. Dialectology and Mapping
The point-based data generated by dialect surveys is beneficial for the creation of maps that examine the distribution of variants. In the case of the SED, a linguistic atlas of England was the project’s ‘ultimate aim’ (Orton Reference Orton1962: 14), and the questionnaire was developed with this in mind (Dieth and Orton Reference Dieth and Orton1952). Such an approach would allow the geographical distribution of large numbers of systematically gathered dialect forms in England to be visualised for the first time.
The first attempt to display data from the SED was Kolb’s (Reference Kolb1966) phonological atlas of the six northern counties of England, an example of which is shown in Figure 7.1. It sought to display the phonological variation present in all of the data, and chose data from one specific region (as opposed to the whole country), as this would permit ‘the fine differentiation necessary to bring out all the local differences in pronunciation’ (Kolb Reference Kolb1966: 11). This logic dictates that maps of the whole country would not be able to deal with the number of forms they had to plot without over-simplification. Whether simplification is necessarily a bad thing when trying to create a useful map that avoids ‘hiding critical information in a fog of detail’ (Monmonier Reference Monmonier1991: 1) is not considered by Kolb. The resulting collection of display maps (Chambers and Trudgill Reference Chambers and Trudgill1998: 25) presents data using numerous symbols and three colours (black, white, and red [in the original version of the map]), for 165 questions from the SED. For each individual question, unique symbols were generated for each variant, showing the range of variation present in the northern counties. The use of symbols has an ‘undoubted immediacy’ (Upton Reference Upton, Lameli, Kehrein and Rabanus2010: 148), although McDavid (Reference McDavid1983) dismissed representation of the totality of variation in such a way as ‘treat[ing] too many variants with too many symbols’ (McDavid Reference McDavid1983: 49).

Figure 7.1: Realisation of vowel in House(s) in SED data, from Kolb (Reference Kolb1966: 257).
Some selection, generalisation, and interpretation would address McDavid’s concerns. This type of hybrid approach can be seen in Orton, Sanderson, and Widdowson’s linguistic atlas, which uses both symbols and interpretative lines (see, for example, Reference Orton, Sanderson and Widdowson1978: Ph149). By contrast, Orton and Wright’s (Reference Orton and Wright1974) lexical atlas chose a wholly interpretative route (for example, Reference Orton and Wright1974: 63). Interpretative maps do not attempt to display all variation present, and instead use isoglosses (‘the obvious, problematic approach’ according to Upton [Reference Upton, Lameli, Kehrein and Rabanus2010: 150]) to suggest patterns in the data to readers of the map. Such approaches are widely used (e.g. Upton and Widdowson Reference Upton and Widdowson1996) but, as Upton notes, are not without their problems; the act of drawing lines immediately suggests an intended reading, as well as the impression of sharp boundaries which have little in common with the situation on the ground. In any event, Orton and Wright’s (Reference Orton and Wright1974) atlas did little to placate McDavid (Reference McDavid1983: 49), who described it as ‘not a word geography; for it nowhere summarizes, in statement or maps, the characteristic vocabulary of any region in England’.
McDavid’s statement suggests unease examining individual responses to questions and displaying them on a map either in display or interpretative form. Critics such as McDavid claimed that these approaches risk missing the bigger picture of variation according to regions (or dialects, as we might otherwise call them). By examining items in isolation, map by map, researchers are less able to make inferences about the wider state of variation. Even examination of isoglosses for coincidence is problematic as they may not overlap, as noted by Upton (Reference Upton and Mugglestone2006: 386) (and are not always drawn consistently [see Macaulay Reference Macaulay, Kirk, Sanderson and Widdowson1985: 175]). Upton (Reference Upton and Mugglestone2006: 384–6) discusses whether examining variation in terms of dialect areas is desirable; Although in addition to noting the fictional notion of ‘dialect areas’ (Upton Reference Upton and Mugglestone2006: 386), he also observes that researchers are unable account for particular forms being more salient than others (e.g. the STRUT-FOOT split in England) when forms are treated in isolation. However, despite the criticism expressed in Upton (Reference Upton and Mugglestone2006), dialectometrists have developed their own methods of working with large-scale survey data to investigate dialect areas using large numbers of features, as discussed in the following section.
4. Dialectometry and Mapping
Dialectometry is an approach that ‘proceeds from the scientific conviction that dialectal data are too complex to be studied one at a time’ (Nerbonne and Kretzschmar Reference Nerbonne and Kretzschmar2013: 2). Whilst clearly addressing the concerns expressed by McDavid, this conflicts with traditional dialectological practice, which has tended to display or interpret patterns on a feature-by-feature basis. Examining features in isolation in this way is flawed, according to Nerbonne and Kretzschmar (Reference Nerbonne and Kretzschmar2006: 388), who state that:
individual features … are associated only weakly with geography. For every promising candidate of a feature which might ‘define’ a dialect area, it always turns out that there are exceptional sites within and without the area which run counter to the candidate definition.
If one’s aim is to define dialect areas on a map, focusing on single features is clearly an issue. Data aggregation was found to be the solution to the problem, and was first proposed by Séguy (Reference Séguy1973) in the form of ‘counting the number of items on which the neighbours [in different survey locations] disagreed’ (Chambers and Trudgill Reference Chambers and Trudgill1998: 138). This quantitative approach permitted the calculation of dialect areas in an objective fashion, avoiding the serious biases (Nerbonne Reference Nerbonne, Lameli, Kehrein and Rabanus2010: 477) of the selective approach characterised by interpretative maps or analyses that attempted to present dialect areas on the basis of only a few features (e.g. Trudgill Reference Trudgill1999).
Goebl (Reference Goebl and Viereck1993) continued Séguy’s work on the quantification of dialect areas, although his focus was on the calculation and mapping of similarities rather than differences (Heeringa and Nerbonne Reference Heeringa, Nerbonne, Hiskens and Taelderman2013). Working with colleagues in the Salzburg school of dialectometry (Goebl Reference Goebl, Lameli, Kehrein and Rabanus2011: 435), Goebl sought to refine both theoretical and methodological aspects of dialectological mapping, most notably introducing Thiessen tiling. This method converts point data in polygons by drawing lines around each point as evenly as possible (Heeringa and Nerbonne Reference Heeringa, Nerbonne, Hiskens and Taelderman2013). Thiessen tiling permits the creation of choropleth maps that allow similarity or difference to be displayed over a continuous surface (Heywood et al. Reference Heywood, Cornelius and Carver2006: 258). This technique produces the honeycomb maps that are characteristic of dialectometry, in which patterns are shown for single and grouped items, generally using colour to show the relatedness (or lack of it) between data tiles (see Goebl Reference Goebl, Lameli, Kehrein and Rabanus2011). Other ‘schools’ of dialectometry have worked in a similar fashion to Goebl; most notably in recent years, the Groningen school has championed the exploration of various clustering techniques in order to understand variation further (Wieling et al. Reference Wieling, Shackleton and Nerbonne2013).
A good deal of effort in dialectometry has focussed not only on mapping variation, but also the methods of mapping this variation. As objectivity is a central aim for all scholars, early methods that relied on researchers setting thresholds, cut-offs, and the interpretation of statistical results, meant that for Chambers and Trudgill (Reference Chambers and Trudgill1998: 138) no ‘method can ever completely remove the dialectologist from the analysis’. Relatively recent developments in computer technology have permitted the automation of much of the process of working with data in dialectometry (Nerbonne and Kretzschmar Reference Nerbonne and Kretzschmar2003). More recent still is the proliferation of the free online tools that enable researchers to conduct their own dialectometric analyses on their data. Tools such as Visual Dialectometry (VDM) (see Goebl Reference Goebl, Lameli, Kehrein and Rabanus2011: 436), and its successor GabMap (Nerbonne et al. Reference Nerbonne, Colen, Gooskens, Kleiweg and Leinone2011), along with DiaTech (Aurrekoetxea et al. Reference Aurrekoetxea, Fernandez-Aguirre, Rubio, Ruiz and Sanchez2013) allow the easy input of data and produce an output of maps and statistical representations of the data.
The contribution of dialectometry to the study of dialect variation is clear, although reservations do remain about the central focus of the discipline on aggregate data. As Wieling et al. (Reference Wieling, Shackleton and Nerbonne2013: 31–2) comment:
the professional reception of dialectometry has been polite but less than enthusiastic, as some scholars express concern that its focus on aggregate levels of variation ignores the kind of linguistic detail that may help uncover the linguistic structure in variation.
Wieling et al. (Reference Wieling, Shackleton and Nerbonne2013) address this central problem by presenting exciting advances in clustering techniques, which enable assessments of the role of specific variants in dialect area clusters. Such advances are, of course, welcome, although there is clearly some way to travel before agreement is reached over the best way to cluster and display dialectometric results.
Perceptual dialectology is another subfield in which there have been multiple methods of processing data, and I consider some of these in the following section.
5. Perceptual Dialectology and Mapping
The aim of perceptual dialectology (Preston Reference Preston1989) is to gather data relating to non-linguists’ perception of the dialect landscape. The most frequently used technique in perceptual dialectology is the ‘draw-a-map’ task (Preston Reference Preston1982), in which respondents are asked to draw lines on a map in order to indicate where they believe dialect areas to exist. Data from ‘draw-a-map’ tasks is quite difficult to use and has therefore required employment of novel techniques for its analysis. The primary factor that makes data from ‘draw-a-map’ tasks hard to work with is the use of a map itself. The range of data that can be gathered is wide and varied, with data relating to perceptions of dialect area placement and extent, dialect area names, as well as qualitative data, all finding their way onto respondents’ maps, as shown in Figure 7.2.

Figure 7.2: 17-year-old female respondent’s completed draw-a-map task. Respondent from Presteigne, Wales (marked on the map with a star).
Dialect area names and qualitative data are relatively easily dealt with, but it is the data relating to the placement and extent of dialect areas that is much more difficult for the researcher to use. Some perceptual dialectology studies that have used the draw-a-map approach have chosen to disregard this geographical data in their analyses (e.g. Bucholtz et al. Reference Bucholtz, Bermudez, Fung, Edwards and Vargas2007; Bucholtz et al. Reference Bucholtz, Bermudez, Fung, Vargas and Edwards2008). This permits more swift examination of survey responses, but it ignores the geographical elements of the data. Not paying attention to this means that it is not possible to assess respondents’ mental maps of dialect areas, which is one of the key aims of perceptual dialectology (Preston Reference Preston, Chambers, Trudgill and Schilling-Estes2002: 51). In addition, this approach neglects to consider a further aim of perceptual dialectology, which has always been to arrive at an aggregation of geographical perception data (Preston and Howe Reference Preston, Howe, Denning, Inkelas, McNair-Knox and Rickford1987: 363).
Arriving at this aggregation technique has proved a long road. An obvious ‘low-tech’ solution to aggregating dialect area placement and extent data is the use of overhead transparencies or tracing paper. I used this technique in early perceptual dialectology research in England and Wales (Montgomery Reference Montgomery2007: 59–61) and would recommend that it only be used for preliminary investigation of patterns, and not with more than thirty respondents’ maps.
Computerised techniques are far more robust than their non-electronic counterparts, and this is the direction perceptual dialectology data processing has taken. Preston and Howe’s (Reference Preston, Howe, Denning, Inkelas, McNair-Knox and Rickford1987) article discusses a method that permits the capture of respondent lines and the calculation of perceptual dialect areas at various levels of agreement. This approach was built upon by Onishi and Long (Reference Onishi and Long1997), who developed Perceptual Dialectology Quantifier for Windows (PDQ). PDQ was able to sophisticate additional functions to Preston and Howe’s approach, displaying data on a single map with levels of percentage agreement relating to dialect areas’ placement and extent. Such an advance allowed immediate analysis of perceptions of core and peripheral dialect areas without overlaying various percentages, the only recourse in Preston and Howe’s approach. Long (Reference Long and Preston1999) and Long and Yim (Reference Long, Yim and Preston2002), along with Montgomery (Reference Montgomery2007) demonstrate the use of PDQ.
These early computer-based solutions were valuable, but they were also flawed. Both Preston and Howe’s technique and PDQ relied on technology in place only in the location in which they were developed and, in the case of PDQ, it was usable only in conjunction with other programmes and computers. This type of bespoke and static technology was not suitable for use amongst the worldwide research community of perceptual dialectologists.
Most recently, researchers have alighted on Geographical Information Systems (GIS) to help process data, and have developed numerous protocols in order to cultivate a standardised method of processing perceptual dialectology data worldwide. A GIS is defined as a system which integrates the three basic elements of hardware, software, and data ‘for capturing, managing, analysing, and displaying all forms of geographically referenced information’ (ESRI 2011). Given the map-based approach taken in perceptual dialectology, the use of a GIS is an obvious choice, as demonstrated by its use in numerous recent studies (Evans Reference Evans2011, Reference Evans2013; Cukor-Avila et al. Reference Cukor-Avila, Jeon, Rector, Tiwari and Shelton2012; Montgomery Reference Montgomery2012; Stoeckle Reference Stoeckle, Hansen, Schwarz, Stoeckle and Streck2012; Montgomery and Stoeckle Reference 169Montgomery and Stoeckle2013).
Montgomery and Stoeckle (Reference 169Montgomery and Stoeckle2013) discuss the GIS method for processing perceptual dialectology data fully, but a brief explanation is provided here. Draw-a-map data, such as that shown above in Figure 7.2, is difficult to process because it involves respondents drawing lines on maps that seek to delimit the boundaries of areas. Lines and areas are considered separate types of data by geographers. Vector data refers to line data, and raster data is that relating to areas. Vector data can be thought of as a list of values which give the points through which a line is drawn. Raster data is stored as a matrix, the cells of which are given a value indicating whether or not they are part of the area in question.
Of course, when respondents draw lines on maps, they do not have any awareness of such technical details, and they are tasked with trying to outline the boundaries of dialect areas (or ‘areas in which people speak differently’, e.g. see Cukor-Avila et al. [Reference Cukor-Avila, Jeon, Rector, Tiwari and Shelton2012]; Evans [Reference Evans2013]). This means that, in order to aggregate draw-a-map data, there has to be a conversion process whereby the vector data are converted to raster data. Once each area drawn by a respondent has been converted to a raster, multiple responses can be added together, and calculations performed which produce outputs showing the extent of agreement and overlap between respondents’ perceptions of the placement, and the extent of individual dialect areas. These agreement calculations are typically displayed using shading (either in black and white, as in this chapter, or in colour, as in Montgomery and Stoeckle [Reference 169Montgomery and Stoeckle2013]). Shading techniques tend to use darker shades to represent greatest agreement over the placement and extent of an area, and lighter shades to show lesser agreement. Multiple areas can then be added to a single map, permitting the relative distribution of the perceptions of different areas. Figures 7.4 and 7.5 show these shading techniques, and comparisons between the placement and extent of different areas. All of this can be done in a GIS, as discussed in Montgomery and Stoeckle (Reference 169Montgomery and Stoeckle2013), and resulting outputs can be used in the spatially sensitive fashion discussed earlier. This is due to the fact that a GIS uses georeferencing to assign real-world coordinate points to data, in order to ‘anchor’ layers of data to a point on the earth’s surface. This means that multiple layers of data can be added together in order to look for patterns and explain the spatial distribution of data.
The use of GIS for perceptual dialectology has four main benefits. Firstly, and most importantly, it permits conversion and processing of the type of data generated by the draw-a-map task. The second benefit, which is only slightly less important than the first, is that, throughout the processing stages and at the point of data output, a GIS works with spatially meaningful data. This means that the data have a relationship to the earth’s surface and are not simply graphical. There are clear advantages to this, as perceptual dialectologists are now able to compare their data with other similarly georeferenced datasets in order to find patterns and explore and understand their data further. The final two benefits are that GIS software is widely available (with open-source software also available), and that it has the ability to produce professional quality outputs.
In the remainder of this chapter, I will present a case study demonstrating the benefits of using GIS and georeferenced data to interpret and understand linguistic data.
6. Perceptual Dialectology and GIS
The case study presented here uses GIS to work with the multifaceted responses to draw-a-map tasks, and to map additional data in order to aid explanation of these responses. It shows that mapping data in perceptual dialectology is important in order to understand the perceptions of respondents that could not be accessed using numerical data alone.
The data are taken from a perceptual dialectology study of the Scottish-English border region. Respondents in five locations completed a draw-a-map task which asked for their large-scale perceptions of dialect regions in Great Britain. Figure 7.3 shows the location of each of the survey points.

Figure 7.3: Survey locations.
School-aged respondents from each of the survey locations were given a minimally detailed map and were asked to draw lines on the map indicating where they believed dialect areas to exist. The task lasted for 10 minutes and, in order to assist respondents, a location map which contained a number of cities and towns in England, Scotland and Wales was shown to respondents for the first 5 minutes of the task. In total, 151 respondents completed hand-drawn maps. Seventy-six were from the three locations on the Scottish side of the border, and seventy-five from the two on the English side. Their mean age was 16 years and 6 months. After the draw-a-map task had been completed, the data were processed in ArcGIS using the method discussed earlier.
In total, respondents drew 970 lines delimiting seventy-nine separate areas (a mean of 6.4 areas drawn per map). Overall numerical data are presented in Table 7.1, which I will address according to the differential levels of dialect area recognition by respondents either side of the Scottish-English border. Table 7.1 shows the twenty most recognised dialect areas for Scottish and English respondents in rank order. Recognition levels for each area are given in the ‘Recognition’ column, which expresses a bare number referring to the number of lines drawn indicating the area. The bracketed figures relate to the percentage of respondents who drew the area. In order to aid interpretation, non-Scottish areas are shaded.
Table 7.1: Recognition of dialect areas by respondents’ country, non-Scottish dialect areas shaded.
| Scottish respondents (n=76) | English respondents (n=75) | ||||
|---|---|---|---|---|---|
| Rank | Dialect areaFootnote 1 | Recognition (%) | Rank | Dialect area | Recognition (%) |
| 1 | Geordie [Newcastle] | 53 (69.9) | 1 | Geordie [Newcastle] | 55 (73.3) |
| 2 | Weeji [Glasgow] | 53 (69.9) | 2 | Scouse [Liverpool] | 53 (70.7) |
| 3 | Scouse [Liverpool] | 52 (68.4) | 3 | Brummie [Birmingham] | 41 (54.7) |
| 4 | Welsh | 46 (60.5) | 4 | Cockney | 40 (53.3) |
| 5 | Brummie [Birmingham] | 38 (50.0) | 5 | Manc [Manchester] | 40 (53.3) |
| 6 | Cockney | 27 (35.5) | 6 | Welsh | 36 (48.0) |
| 7 | Manc [Manchester] | 27 (35.5) | 7 | Cumbrian/Carlisle | 31 (41.3) |
| 8 | Aberdeen | 13 (17.1) | 8 | Yorkshire | 23 (30.7) |
| 9 | Borders | 12 (15.8) | 9 | Scottish | 17 (22.7) |
| 10 | Strong/broad Scottish | 11 (14.5) | 10 | Weeji [Glasgow] | 15 (20.0) |
| 11 | West Country | 11 (14.5) | 11 | Strong/broad Scottish | 11 (14.7) |
| 12 | Highlands | 11 (14.5) | 12 | London | 11 (14.7) |
| 13 | Gaelic | 11 (14.5) | 13 | Aberdeen | 10 (13.3) |
| 14 | London | 10 (13.2) | 14 | West Country | 9 (12.0) |
| 15 | Cumbrian/Carlisle | 9 (11.8) | 15 | Bristol | 8 (10.7) |
| 16 | Yorkshire | 7 (9.2) | 16 | Cornwall | 7 (9.3) |
| 17 | Scottish | 7 (9.2) | 17 | Southern | 7 (9.3) |
| 18 | Bristol | 6 (7.9) | 18 | Highlands | 6 (8.0) |
| 19 | Cardiff | 6 (7.9) | 19 | West Cumbria | 6 (8.0) |
| 20 | Lancashire | 3 (3.9) | 20 | Midlands | 5 (6.7) |
Table 7.1 shows both similarities and differences in Scottish and English respondents’ recognition levels. The clearest difference is that of the perception of non-Scottish dialect areas amongst the two groups of respondents. The expected effect of proximity (Montgomery Reference Montgomery2012) sees Scottish respondents drawing 118 lines in recognition of Scottish dialect areas (29 per cent of all lines drawn for ‘top twenty’ dialect areas). In contrast, English respondents drew only fifty-nine lines (14 per cent of all ‘top twenty’ lines).
The English respondents’ ten most frequently drawn dialect areas are predominantly English, with the only Scottish areas occupying the ninth and tenth slots. For English areas, the recognition rates for these areas are very similar to those found in previous research undertaken in different locations in England (Montgomery and Beal Reference Montgomery, Beal, Maguire and McMahon2011), and reflect the impact of both proximity and ‘cultural prominence’ (Montgomery Reference Montgomery2012: 658–60). By contrast, the ‘top ten’ dialect areas for Scottish respondents contain four Scottish areas and six in England, with the English areas recognised by Scottish respondents similar to those recognised by English respondents.
Despite the similarity in the perception of English areas, further consideration of the frequently recognised dialect areas by country reveals the different way in which the border impacts on perception according to respondents’ country of residence. For Scottish respondents, the most frequently drawn dialect areas are ‘Geordie’ and ‘Weeji’, both identified by 69.9 per cent of respondents. For English respondents, the ‘Weeji’ area is the most frequently recognised city-based area in Scotland, but its recognition rate of 20 per cent is nowhere near the rates for other city-based dialect areas. This suggests that the Scottish-English border is working to inhibit the perception of dialect areas in the United Kingdom, but that this effect is felt most by respondents living in England.
Moving on to the map-based data, Figure 7.4 shows composite map data relating to the perception of dialect variation in Scotland, with corresponding data shown for England in Figure 7.5. In both figures, dialect areas are labelled according to their recognition level (with larger labels indicating greater levels of recognition) and shaded according to agreement levels (darker areas indicate greater agreement over the placement of an area).

Figure 7.4: Perception of Scottish dialect areas.Footnote 2

Figure 7.5: Perception of English dialect areas.
The composite maps shown in Figure 7.4 demonstrate that the mental maps of the ‘Scottish’ dialect area differ considerably for respondents from Scotland and England. There is a greater acknowledgement of variation in Scotland amongst Scottish respondents, and less awareness on the part of English respondents. Figure 7.4 displays a focussed ‘Weeji’ dialect area, an Aberdeen dialect area, and a Borders area, as well as a Gaelic area, and a Highlands area (a similar space to the ‘Scottish’ area on the English respondents’ map). For Scottish respondents the ‘Strong/broad Scottish’ area is not included as it did not appear to relate to one specific geographical area. Figure 7.5 shows fewer areas for English respondents. These are, in turn, less focussed than those drawn by their Scottish counterparts. The ‘Weeji’ area is included on the map, as is Aberdeen, Broad Scottish, and Highlands. However, the most frequently drawn area was the ‘Scottish’ area. Respondents choosing to add this area simply drew a circle around Scotland, and generally did not indicate any further subdivisions. The large ‘Scottish’ label on the map indicates this general area, which serves as a backdrop for the other composite areas shown in Figure 7.4.
The generalised perception of variation in Scotland amongst English respondents, versus the more specific perceptions of Scottish respondents, is perhaps unsurprising. It is not controversial to assume that respondents would have more knowledge of their own country, as well as an increased motivation for detailing it. One might therefore expect the situation to be similar for English dialect areas. As I have already discussed in relation to Table 7.1, this is not the case, and the maps in Figure 7.5 show that the areas drawn by English and Scottish respondents are remarkably similar. Both composite maps reveal the perception of a greater amount of variation in the north of England. Here, five distinct areas are recognised (‘Geordie’, ‘Cumbrian’, ‘Yorkshire’, ‘Scouse’ and ‘Manc’), and there is very little difference between their placement and extent for Scottish and English respondents. The same is true of the remaining areas on the maps.
It is important to take both the numerical and map data together, but without the composite map data it would be particularly difficult to assess the extent to which respondents had similar (or dissimilar) mental maps of the dialect areas they were drawing. The map is central to the study of perceptual dialectology and, without it, we are simply left with a list of prominent dialect area concepts. This highlights the central importance of mapping to the perceptual dialectologist, and illustrates how the GIS approach adds to our analytical toolkit.
Whilst attitudinal factors clearly impact on the way in which dialect areas in Scotland might be perceived amongst English respondents (see Montgomery Reference Montgomery, Watt and Carmen2014), other factors such as contact are also important. Here, the use of GIS, which ensures data are spatially relevant, opens up the possibility of working with large-scale datasets in order to investigate how people interact with the spaces and places in which they live.
One such large-scale dataset is based on data gathered in the UK census. The UK census takes place every ten years and includes questions relating to commuting and migration. The question relating to migration is relatively limited, as noted by Buchstaller and Alvanides (Reference Buchstaller and Alvanides2010). However, data relating to commuting is perhaps more useful for the dialectologist’s purpose, and I consider these as ‘routinised social practices’ (Britain Reference Britain, Auer and Schmidt2009: 151) important in the creation of regions (see Britain Reference Britain, Auer and Schmidt2009: 151–4). Commuting data make it possible to measure the possibility for contact amongst people living in different areas. Of course, not all people in an area have equal access to resources in their communities, with the result that different people will experience different levels of interaction from others (highlighting the importance of micro-level sociolinguistic study, see Moore and Carter, and Snell, this volume). However, as a proxy for likeliness of contact between populations, the commuting data are useful.
Commuting data for 2011 (Office for National Statistics 2011) were extracted in an origin-destination matrix on the basis of Local Area District (LAD) geography. For 2011, there were considered to be 404 LAD areas in the United Kingdom, and data were extracted from the twenty-two districts that lay within 50 miles of the Scottish-English border. Commuting data were then mapped with ArcGIS using the centre points of each of the districts, and line thickness to indicate population flow. Figure 7.6 displays commuting flows from the LADs north and south of the Scottish-English border, shaded so that the LADs containing survey locations are darker than other areas. The survey locations used in this study are sited in ‘Dumfries and Galloway’ (Langholm and Moffat), ‘Scottish Borders’ (Galashiels), ‘Carlisle’ (Brampton), and ‘Northumberland’ (Hexham).

Figure 7.6: Commuting flows along the Scottish-English border.Footnote 3
Figure 7.6 shows clusters of interaction centred on Edinburgh in Scotland, and Carlisle and Newcastle upon Tyne in England, and demonstrates more commuting across the Scottish-English border from the English side than from the Scottish side. On the west side of the maps, a sizeable amount of reciprocal commuting is revealed. There is commuting to and from the Carlisle District (in England) and the Dumfries and Galloway District (in Scotland). There is a smaller amount of reciprocity on the east side of the map.
The maps reveal that, based on these commuting data, there is likely to be a greater amount of contact with English dialect speakers in the south of Scotland than there is contact with Scottish dialect speakers in the north of England. Table 7.2 subjects the commuting data to further interrogation for the purpose of understanding the commuting patterns and possible links between these and the recognition of dialect areas. The table summarises the commuting data, dividing commuters from outside specific Interaction Districts on the basis of their country of origin (Scotland or England). Also included in the table are the mean percentage dialect area recognition levels for respondents in each survey location.
Table 7.2: ‘Out-of-area’ commuting data, with recognition levels for Scottish and English dialect areas.
| Local Authority District (2011) | Carlisle | Northumberland | Scottish Borders | Dumfries and Galloway | |
|---|---|---|---|---|---|
| Containing survey location | Brampton | Hexham | Galashiels | Langholm | Moffat |
| Economically active populationFootnote 4 | 79531 | 233224 | 58659 | 75727 | 75727 |
| ‘Outside District’ commuters (%) | 10055 (12.6) | 21789 (9.3) | 2517 (4.3) | 1957 (2.6) | 1957 (2.6) |
| Of these, total from England (%) | 7671 (76.3) | 20584 (94.5) | 937 (37.2) | 955 (48.8) | 955 (48.8) |
| Of these, total from Scotland (%) | 2384 (23.7) | 1205 (5.5) | 1580 (62.8) | 1002 (51.2) | 1002 (51.2) |
| % recognition of English areas | 31.6 | 26.0 | 27.4 | 22.0 | 18.8 |
| % recognition of Scottish areas | 13.9 | 10.8 | 27.8 | 22.5 | 21.5 |
Table 7.2 shows that outside-area commuting is more likely in English LADs than Scottish ones. When the data for these outside district commuters is examined more closely, a stark contrast between districts in Scotland and England is revealed. In Scotland, there is a much higher percentage of commuters from England in Scotland than when the situation is reversed. In the Dumfries and Galloway LAD, for example, the ratio of English to Scottish commuters is nearly 50:50 whereas in the English LADs commuters are generally from England. In the Carlisle district, 76.3 per cent of commuters are from England, and in the Northumberland district 94.5 per cent commute from other English LADs.
These data mean that the opportunities for contact with speakers of English varieties are similar in all of the Scottish survey locations. In English locations, this opportunity is generally diminished. Such disparities in contact opportunities could explain differences in the perception of dialect variation. Scottish survey locations have a similar mean percentage recognition level for English and Scottish dialect areas, and a high percentage of English commuters working in their LADs. In contrast, the decreased opportunities for contact in the English areas, particularly in the Northumberland district, could be one of the reasons for the lower level of Scottish dialect area recognition in England, and the lowest recognition level in Hexham specifically.
Ensuring that data processing in perceptual dialectology is spatially accurate brings with it is own advantages in terms of guaranteeing that data can be manipulated and analysed in a meaningful fashion. The ability to visualise large numbers of respondents’ perceptions of dialect areas means that we are able to understand the similarities and differences of respondents’ views of the world, and the use of large-scale spatial datasets, such as the census commuting data, means that we can account for respondents differing views of the world around them.
7. Conclusion
In this chapter, I have argued that in order to understand dialectological data researchers must pay attention not only to the distribution of linguistic phenomena, but also what the use of these phenomena mean to the people on the ground. I have argued that maps, although generally useful for the display of data, do have their drawbacks associated with overlaying data onto a ‘blank canvas’ (Britain Reference Britain, Lameli, Kehrein and Rabanus2010: 87). These approaches do not pay attention to how people live space, and how this might impact on our understanding of the data. As noted above, this is not a new argument (Britain Reference Britain, Auer and Schmidt2009; Britain Reference Britain, Lameli, Kehrein and Rabanus2010; Auer et al. Reference Auer, Hilpert, Stukenbrock, Szmrecsanyi, Auer, Hilpert, Stukenbrock and Szmrecsanyi2013). Nonetheless, my contribution proposes a possible solution to the problem in the form of using GIS to tie together many layers of geographically meaningful data.
Although the case study presented here is based on perceptual data, there is no reason why GIS, and the geospatial techniques it relies upon, could not be used to analyse production data. As with the perceptual data example, the use of these techniques may more effectively incorporate data from outside dialectology. Additionally, an understanding of the benefits of this type of method may allow more visually appealing incorporation of sociolinguistic factors into our dialectological analyses, long recognised as essential to the field (Chambers and Trudgill Reference Chambers and Trudgill1998).
GIS is of course not a magic bullet. As historians such as da Silviera have noted, the use of GIS ‘did not bring about a revolution in knowledge production in history’ (da Silveira Reference da Silveira2014: 29). Nor is GIS synonymous with the production of maps, as ‘maps can be produced more easily with many standard drawing applications’ (Jessop Reference Jessop2007: 43). Instead, dialectologists should embrace the possibilities of GIS not only to visualise our data, but also to ‘analyse and display data in a variety of maps, graphics, networks or hierarchy trees as well as extending database functionality to the investigation of spatial relationships’ (Jessop Reference Jessop2007: 39 [my italics]). The investigation of spatial relationships will permit dialectologists to use data relating to how people use space as a tool for better understanding linguistic data and the patterns presented within it. I contend that dialectologists and dialectometrists should have fewer debates about the correct clustering techniques for analysing variation, and spend more time considering how valuable linguistic data can be used alongside other datasets in order to produce spatially meaningful accounts of language use.
GIS technology allows us to do this, as do geo-browsers like Google Earth (de Vriend et al. Reference de Vriend, Boves, van Hout and Swanenberg2011), but both rely on georeferenced data that has a real-world reference point. Researchers working in the field are, of course, not ignorant of the concept of georeferenced data, GIS, or geo-browsers, as numerous articles demonstrate (Kirk and Kretzschmar Reference Kirk and Kretzschmar1992; Light and Kretzschmar Reference Light and Kretzschmar1996; Labov et al. Reference Labov, Ash and Boberg2006; Nerbonne et al. Reference Nerbonne, Colen, Gooskens, Kleiweg and Leinone2011; de Vriend et al. Reference de Vriend, Boves, van Hout and Swanenberg2011; Gregory and Hardie Reference 168Gregory and Hardie2011). However it seems that the full opportunities of such technology have not yet been seized. For example, the dialectometry interface GabMap works with Google Earth in order to import real-world coordinate data for survey points into the mapping interface, but does not permit output of data into either a GIS or geo-browser, leaving data in the form of a graphical output that cannot be interrogated further using spatial analyses.
More recent work has demonstrated the possibilities of working with georeferenced data in R (R Core Team 2014); in particular, Grieve has produced spatial statistical analyses of large datasets (e.g. Grieve Reference Grieve, Szmrecsanyi and Wälchli2014), marrying linguistic data with census data in order to suggest reasons for innovation diffusion (Grieve et al. Reference Grieve, Guo, Kasakoff and Nini2014). Although R is not at present useable for perceptual dialectology data, the underlying georeferenced data means that datasets can be combined and examined together.
Working with multimodal data in this way means that researchers interested in language and place can work with data, not just as points or polygons on a blank surface, but as something spatially meaningful. This enables us to further understand the relationship between language and place, rather than simply ascribing forms to locations. Put simply, combining linguistic and other datasets will enable researchers to understand much more about ‘lived space’ and how this affects the language that research subjects use.
1. Introduction
The ways we conceptualise ‘urban’ and ‘rural’ are strongly conditioned by a range of discourses (institutional, public, media) – discourses which are dynamic yet which often have roots reaching well back into earlier times, discourses which are interactive and which shape how we see, read, and interpret the landscape. These discourses themselves are also often deployed to deliberately manipulate how we interpret these landscapes: they are used to commodify certain landscapes (e.g. in tourist promotional materials) or to package and sell particular partial and politicised representations of landscape (witness, e.g. how the Countryside Alliance in the United Kingdom portrayed the countryside in its attempt to prevent a ban on fox hunting). The way in which we see the city and the countryside, then, is shaped by these discourses and is deeply ideological.
In this chapter, I argue that these circulating ideological discourses have also shaped the way dialectologists – traditional and variationist – have gone about their business of understanding the nature of language change, and shaped the way dialectologists have seen, understood, and ‘exploited’ ‘rural’ and ‘urban’ in their research. Drawing upon applications of Foucault’s work by urban and rural geographers, I will apply the concept of the rural and urban ‘gaze’ (e.g. Abram Reference Abram and Cloke2003) to help understand the contrasting ways in which ‘rural’ and ‘urban’ have been theorised in different forms of dialectology. Gaze is defined by Woods (Reference Woods2011: 103) as ‘an act of power in which collective social norms define not only how we interpret the things we see, but also what we actually see (and do not see) and where we look’. As this definition makes clear, our gaze not only leads us to see things in certain ways, but also leads us not to see certain things too. Woods (Reference Woods2011: 103), for example, points to Foucault’s original concern with the ‘medical gaze’, which showed that, until the eighteenth century, ‘mental illness’ was not seen as such, because the symptoms of such illness were interpreted as evidence that the sufferer was ‘possessed’ and not as a symptom related to general health. I will also show how the rural and urban gazes in dialectology have often meant that scholars have not ‘seen’ and therefore not investigated contexts of change which tend to fall outside of our usual associations and expectations of those landscapes.
I begin from an assumption that, despite society’s very different conceptualisations of rural and urban, typologically language changes in the same way in both (Britain Reference Britain, Al-Wer and de Jong2009, Reference Britain, Hansen, Schwarz, Stoeckle and Streck2012). Remarkably, this assumption seems to surprise many people. Some dialectologists have gone as far as to argue that there are certain linguistic changes which are unique to cities (Calvet Reference Calvet1994; Bulot and Tsekos Reference 186Bulot, Tsekos and Bulot1999; Messaoudi Reference Messaoudi, Bulot, Bauvois and Blanchet2001; Bulot Reference Bulot2002). Calvet, for example, asked:
Why the city? One needs only to look at rates of urbanisation in different countries around the world to realise that the city represents an inevitable outcome of our recent history. People from rural areas everywhere are lured by the false promises of urban life, by its bright lights and the hope of better paid work. And this coming together of migrants to the city has linguistic consequences … the city also produces specific linguistic forms, urban dialects … Urban sociolinguistics cannot be content to study urban contexts, it must tease out what is specific about these contexts and build a specific approach to these contexts.
Calvet proposes semantic transparency and the levelling of grammatical and morphological redundancy as examples of these specific linguistic forms. Such types of change are indeed often found in cities, but not rarely found also in rural areas. In Britain (Reference Britain, Al-Wer and de Jong2009, Reference Britain, Hansen, Schwarz, Stoeckle and Streck2012), I argued that contact, not urban location, is typologically most responsible for many of the changes that Calvet lists, and proposed that there are large-scale sociolinguistic processes which are perhaps most obviously and vividly expressed in cities, but are not confined politically, sociologically, or epistemologically to an urban context.Footnote 1
Hubbard (Reference Hubbard2006: 9) argues that geographers, too, once identified cities as distinctive spaces and consequently sought specific ways to describe and explain them. By the late 1960s, however, geographers were beginning to question the explanatory fruitfulness of the opposition, and there is now a general consensus that the distinction between the two cannot be explanatory. Pahl (Reference Pahl and Pahl1968: 263, 302) was an early especially critical supporter of this view, arguing that ‘in a sociological context, the terms rural and urban are more remarkable for their ability to confuse than for their power to illuminate … any attempt to tie particular patterns of social relationships to specific geographical milieu is a singularly fruitless exercise’. Additionally, Harris (Reference Harris1983: 104) argued that defending the distinction between urban and rural ‘encourages us to believe that the term urban might explain something. To the contrary … in its spatial sense ‘urban’ adds nothing to our understanding of proximity and its effects, as they vary in intensity over space. This conclusion offers new support to the emerging consensus that, when applied to the present, ‘urban’ explains nothing. If the ghost has not yet been laid, there is now another nail in the coffin’ (see Britain Reference Britain, Al-Wer and de Jong2009, Reference Britain, Hansen, Schwarz, Stoeckle and Streck2012 for further confirmation of the non-explanatory nature of ‘urban’ and ‘rural’).
I proceed now to expand on the idea of the rural and urban gaze, considering how this gaze is rooted in ideologies about the countryside and the city, and how it has shaped dialectological practice. As we will see, ‘rural’ and ‘urban’ are often represented as opposites, and it is often ‘negative’ ideologies of the city which help shape ‘positive’ ones of the countryside, and vice versa. As Kroskrity (Reference Kroskrity and Kroskrity1999: 12) reminds us, ideologies are multiple, divergent, often seemingly contradictory and created by a diverse range of actors. Nevertheless, ideologies of the rural and urban are powerful and, as we shall see later, can trigger significant language change-inducing consequences.
2. Thatched Cottages, Chocolate Boxes, Rhoticity and NORMs
In an excellent overview of rural geography, Woods (Reference Woods2011), countering essentialist notions of urban and rural, argues that ‘rurality is understood as a social construct … an imagined entity that is brought into being by particular discourses of rurality that are produced, reproduced and contested by academics, the media, policy-makers, rural lobby groups and ordinary individuals. The rural is therefore a ‘category of thought’’ (Woods Reference Woods2011: 9). Consequently, ‘the importance of the rural lies in the fascinating world of social, cultural and moral values that have become associated with rurality, rural spaces and rural life’ (Cloke Reference Cloke, Cloke, Marsden and Mooney2006: 21). One of the more dominant ideologies of the rural is that of the rural idyll, an ideology that is ‘an enduring, far-reaching, deeply ingrained contemporary imagining of rurality” (Horton Reference Horton2008b: 389).Footnote 2 Space precludes the possibility of an extensive summary of the large literature on the rural idyll (see Woods Reference Woods2011: 21–2), but the notion bundles together bucolic discourses of the countryside: the rural as peaceful, tranquil, stable, simple, virtuous, moral, unspoilt yet fragile, and vulnerable to ‘contamination’ from the urban, supportive and community-driven and, importantly, as traditional – a site of heritage and preservation. Woods (Reference Woods2011: 17) shows that many of these ideas of the rural date back at least to Classical Roman times and Bunce (Reference Bunce1994) has argued that many of them, furthermore, are generated and reproduced from outside, from urban and suburban sitting rooms, from the ‘armchair countryside’. As Woods (Reference Woods2011: 30) makes clear, there are a multitude of discourses of rurality, and the rural idyll competes with other representations of the countryside, for example the rural as backward, conservative, boring, dangerous, threatening, uncultured and uneducated. Horton (Reference Horton2008b: 389) points to a number of authors who have suggested that ‘this “rural idyll” has too often borne particular (typically white, Anglocentric, conservative, heterosexist, elitist) cultural/ideological “baggage”’. Others have added ‘male’ to the list.
The rural idyll has (of course) been commodified – in promotional literature for rural tourism, for example, and, of course, in the stereotypical images of thatched cottages on confectionary boxes that have generated the adjective ‘chocolate-box’ which now rarely has anything to do with chocolate.Footnote 3 Crucially, this concept has been circulated and reproduced through the mass communication media. Phillips et al. (Reference Phillips, Fish and Agg2001) point to the fact that dramas set in rural areas are amongst the most popular (and enduring) programmes on television – consider the popularity of British comedy and drama series such as Last of the Summer Wine, Heartbeat, Midsomer Murders, Peak Practice, but also non-fictional series such as Escape to the Country, and, even, One Man and His Dog.Footnote 4 They, and others, argue that such programmes present a very partial, middle-class view of the countryside, and ‘a stylised and exaggerated version of the rural that is detached from the everyday material experience of rural life’ (Woods Reference Woods2011: 36). Woods (Reference Woods2011: 36) has argued that through these programmes, many urban viewers come to know the rural. The role the media play in the intergenerational entrenchment of such vistas of the rural can be seen in the popularity of series for young children in which idyllic pastoral representations of the countryside are presented: most notably Postman Pat (a British programme about a mail delivery driver, working in a small village, see Horton [Reference Horton2008a, Reference Horton2008b] for discussions of the reproduction of the rural idyll in Postman Pat).
The concept of the rural gaze suggests that when we ‘look at’ or ‘interpret’ the countryside, our view is ‘directed’ and steered by circulating social ideologies about the rural, and our perceptions of rural authenticity are often measured by the extent to which ‘reality’ matches the hegemonic picture. In the case of the rural, dominant ideologies mask many of the less serene realities of social life in the countryside, so the rural gaze also shapes what we do not see or understand too. It also guides how we see the countryside linguistically. The rural dialectological gaze tends to draw especially on the countryside as site of tradition and of the archaic. In the south of England, for example, rhoticity – a now declining characteristic of the Englishes of south-western England (Piercy Reference Piercy2006) – is routinely recruited to phonologically perform rurality, and is regularly used and commodified in characterisations of the English south-west, both dramatic and comedic. Examples include Exeter City football fans’ chant of ‘Oooh arrrr, we are Exeter’, the Scrumpy and Western band The Wurzels’ hyperrhoticised cover version of Gina G’s 1996 non-rhotic rendition of Eurovision song ‘Ooh ahh just a little bit’, and mocking references to the Cornish National Liberation Army as being the ‘Ooh-Arr-A’.Footnote 5 As is often the case with iconicised ideological representations, a particular characteristic of some members of a group is deemed to hold for all members of that group. Rhoticity has, in some discourses, been assumed to be characteristic of all of the rural south of England, even in those parts where rhoticity has long disappeared, such as East Anglia. Consequently, the speech of some older and less educated characters, especially, in drama series set in East Anglia such as Stephen Fry’s KingdomFootnote 6 is rhotic, even though this area was already reported as being absent of rhoticity back in the late nineteenth century (Ellis Reference Ellis1889). And rhoticity is regularly used in comedic representations of East Anglia too (e.g. see comedian Russell Howard’s use of rhoticity to represent the English of Norwich in Right Here, Right Now (Howard Reference Howard2011)). For many, iconic representations of East Anglia are performed through yod-dropping,Footnote 7 a traditional, but also declining feature of the local variety that became enregistered as a result of a series of frozen turkey advertisements from the 1980s onwards. Almost invariably, it is traditional, often obsolescent characteristics of rural dialects which are iconised and, to reword Woods, these present stylised and exaggerated versions of the rural soundscape that are similarly detached from everyday dialect use in the countryside.
Many of these ideologies that steer the rural gaze have shaped dialectological practice from the earliest days right through to the present. For the traditional dialectologist, the conservative, traditional, nostalgic, simple, peaceful, unadulterated qualities of the gaze made rural areas especially appealing for work aiming to, in the words of Ellis (Reference Ellis1889: 92 [his emphasis]), ‘determine with considerable accuracy the different forms now or within the last hundred years … in passing through the mouths of uneducated people, speaking an inherited language, in all parts of Great Britain where English is the ordinary medium of communication between peasant and peasant’. Unlike many working in the traditional approach, Ellis did collect some data from towns and cities, though most data collection localities were rural. Most data came via local contacts, often clergy, who were asked to ‘translate’ texts into the local accent using conventional spelling. He recognised, furthermore, the problem of getting clergy to do his translations, but asked:
But why not go to the peasantry at once? Why not learn from word of mouth, so that the errors would be limited to the writer’s own appreciation? … there are many difficulties in the way. First the peasantry throughout the country have usually two different pronunciations, one which they use to one another, and this is that which is required; the other which they use to the educated … is absolutely worthless for the present purpose. If I, having no kind of dialectal speech, were to go among the peasantry, they would of course use their ‘refined’ speech to me. I have therefore not attempted it.
Later dialectological work was much more explicitly anti-urban in its approach. For the Survey of English Dialects (SED), preference was given in informant selection to ‘agricultural communities that had had a fairly stable population of about five hundred inhabitants for a century or so … newly built up locations were always avoided’ (Orton and Dieth Reference Orton and Dieth1962–71: 15). As well as avoiding urban locations, the SED sought a very specific sort of informant:
The kind of dialect chosen for study was that normally spoken by elderly speakers of sixty years of age or over belonging to the same social class in rural communities, and in particular by those who were, or had formerly been, employed in farming, for it is amongst the rural populations that the traditional types of vernacular English are best preserved to-day … Great care was taken in choosing the informants. Very rarely were they below the age of sixty. They were mostly men: in this country men speak vernacular more frequently, more consistently and more genuinely than women … dialect speakers whose residence in the locality had been interrupted by significant absences were constantly regarded with suspicion.
Note the association of data they deem ‘authentic’ with many of the component ideologies shaping the rural gaze – associations with agriculture, stability, fragility in the face of urban incursion, the traditional. While the types of informants that the SED fieldworkers sought are clearly defined, the extent to which they were able to realise their goal is another matter. Although many agricultural workers were exempt from military service after World War II – agriculture was deemed an ‘essential service’ – the SED Basic Materials reveal that many of the SED informants had military experience during World War I, a significant ‘leveller’ in many respects, including linguistic.Footnote 8
Whilst, as we will see, developments in dialectology from the 1960s largely turned the focus away from the countryside, the rural gaze persists in some forms of variationist sociohistorical linguistics which seek to trace sources of pre-migratory dialect patterns. Tagliamonte’s (Reference Tagliamonte2013) work on the British roots of North American dialects deliberately and specifically sought localities that were apparently rural, remote and stable, as well as informants who were old.
The rural dialectological gaze goes further, however. The focus on NORMs (Chambers and Trudgill Reference Chambers and Trudgill1998: 29) – non-mobile old rural men – as suitable informants for dialect investigations generally and the ensuing portraits of rural dialect variation as socially homogeneous but regionally differentiated helped feed not only ideologies (including academic ideologies) of rural dialects as highly localised – of the ‘you go to the next village and you can’t understand a word they say’ kind – but also of rural locations as sociolinguistically barren, as hyperconservative, and as static.
The problematic view of the dialectological landscape through the rural gaze was one of the triggers for the variationist, sociolinguistically oriented dialectology of the 1960s. At this time, academic dialectology acquired an urban gaze that has largely persisted to this day. I turn now to consider the urban gaze and its implications for variationist approaches, before considering the ways in which both gazes have tended to make invisible forms of social change that have profound linguistic outcomes.
3. Where It’s All Happening: The Urban Gaze
The way we see and interpret cities is constructed in the same ways as the rural gaze, through cycles of the emergence, circulation, and reproduction of official, lay, academic, mediated, and other ideological discourses. The discourses themselves are again multiple and deep-seated, but often contradictory and, understandably, quite different in content. Hubbard (Reference Hubbard2006: 61) argues that, unlike for the countryside, where the ‘rural idyll’ mythology is dominant, there are two oppositional ideologies that compete to shape our understanding of the city. One is an anti-urban view that sees the city as ‘a nadir of human civility’ and ‘associated with sin and immorality, with a movement away from “traditional” order and mutual values’ (Hubbard Reference Hubbard2006: 60), with ugliness, decay, alienation, criminality, disorder and a lack of belonging. It is an ideology that is propped up by that of the rural idyll that presents the countryside as promising everything positive that the urban cannot, and Hubbard suggests both helped inform the garden city movement of the early twentieth century in Britain, which tried to create cities injected with many elements of rural living.
The other more liberal ideology is that of the city as vibrant, exciting, cultured, creative, diverse, tolerant, entrepreneurial, connected, cosmopolitan and ‘edgy’, innovative, at the forefront of new ideas – where it’s all happening. To these characteristics, Hubbard adds the ideology of the city as cultural melting pot. This, he says, ‘valorises the very size of the city as providing opportunities for variety, social mixing and vibrant encounters between very different social groups. Because of this, the city may be seen as having a radical potential, where it is possible to challenge entrenched order’ (Hubbard Reference Hubbard2006: 66). And just as the rural idyll reinforces anti-urbanist perspectives, so the view of the vibrant city of culture, social heterogeneity, education, and creativity is given strength by comparisons with the ‘ignorant and brutish yokel’, and with ‘isolationist and technophobic’ ruralites (Hubbard Reference Hubbard2006: 64).
Mediated portrayals of the city help reproduce these ideologies. On the one hand, it is not hard to find representations of anti-urbanism. Futuristic dystopian worlds in literature and cinema are overwhelmingly urban; one of the largest selling computer game series, Grand Theft Auto, is set amongst scenes of urban disorder, and, Hubbard (Reference Hubbard2006: 62) reminds us, the chaos and lawlessness of some cities can only be contained by cinematic superheroes such as Batman, Spiderman, or, more recently, the Incredibles. On the other hand, there are many media portrayals that show the city as a buzzing, frenetic but ultimately sociable and supportive locale, such as Sex in the City and the aptly named Friends.
The urban gaze, then, is more contested, and not dominated by one particular way of seeing. How does it shape the way we see the city linguistically? Certainly city dialects appear to be more well recognised (Montgomery Reference Montgomery2007) and are more likely to have been enregistered, at least in Britain. Many more cities have specific labels for their dialects than rural areas – Geordie, Scouse and Cockney, for instance, though language attitudes research tends to show that urban dialects are evaluated poorly in terms of prestige and social attractiveness (see Bishop et al. Reference Bishop, Coupland and Garrett2005, who show that it is the dialects of Birmingham, Liverpool, and London that are evaluated most negatively in attitudinal studies conducted 35 years apart). London’s repertoire of commodified language features includes both elements of Cockney, such as rhyming slang and TH-fronting on the usual array of T-shirtsFootnote 9, mugs and tea towels, as well as Multicultural London English (see, e.g., Cheshire et al. Reference Cheshire, Kerswill, Fox and Torgersen2011), in the form of comedic characterisations, such as the Sacha Baron Cohen character Ali G.
We can now examine how the urban gaze has shaped dialectological practice. As we saw earlier, variationist sociolinguistics emerged partly in reaction to traditional approaches to dialectology that were strongly steered by the rural gaze. In addition, though, this and other emergent forms of sociolinguistics coincided with a growing politicisation of social problems centred around ethnicity, gender, and disadvantage, which were at their most visible and pressing in large multicultural urban centres. All of the main founders of the broader discipline were engaged (and continue to be so) in attempts to address these concerns as they applied to language, for example, Labov in his (ongoing) educational and advocacy work on behalf of speakers of AAVE (see, for instance, Labov Reference Labov1982), and Fishman in his work counteracting misunderstandings about multilingualism and on language revitalisation (see, for instance, Fishman Reference Fishman1991).
Perhaps somewhat ironically, the first major fully variationist study (and the one that appears to have best survived the test of time) in what became widely known as ‘urban sociolinguistics’ was Labov’s study of rural Martha’s Vineyard. When contrasting his work there with the later study of the Lower East Side of New York, Labov made it clear that the latter represented ‘a much more complex society’ (Labov [1966] Reference Labov2006: 3). Certainly ‘urban as complex’ is one routine element of the urban gaze, though few of the early urban variationist studies matched the Martha’s Vineyard research in terms of the number of social variables actually analysed empirically. Labov’s ([1966] Reference Labov2006) New York study was ultimately distilled down to the variables of age, class, ethnicity, and gender – some, but not all, of the factors relevant to explaining sociolinguistic diversity in Martha’s Vineyard. As the results of Labov’s analysis demonstrated, Martha’s Vineyard showed considerable sociolinguistic diversity with respect to age, location, occupation, ethnicity, orientation towards the island, and desire to stay or leave (Reference Labov1972: 22, 25, 26, 30, 32, 39). In terms of social and linguistic structure, Martha’s Vineyard hardly fits the rural stereotype of quiet and sleepy pastoralism, or of traditional dialectological NORMs. But dialectology had now moved to the city and it has largely stayed there since.
In some senses, the urban gaze provided a number of motivations for shifting dialectology to the city. If, as Weinreich et al. (Reference Weinreich, Labov, Herzog, Lehmann and Malkiel1968) make clear, the main goal of variationism is to understand the orderly heterogeneity of the speech community undergoing change, where better to examine it than in communities which appear to be the most vibrant, diverse, fluid, socially heterogeneous, and innovative. The motivations are clear, though the practice has not usually been able to live up to the full diverse spectacle – few studies examined variation within different parts of the city (though Trudgill Reference Trudgill1974 did so in Norwich), a good number focussed on one small part of a city (e.g. Labov [1966] Reference Labov2006), and rarely do early studies stretch beyond a rather limited set of social variables. In most early work, non-natives and late arrivals to the community were excluded, so despite the attraction of finding order in the messiness of the city, a lot of that messiness was ignored (see Britain Reference Britain, Al-Wer and de Jong2009, Reference Britain, Hansen, Schwarz, Stoeckle and Streck2012).
Nevertheless, the literature demonstrates that dialectologists tend to travel to the city in their search for socially diverse communities to probe. We can point to a number of other consequences of the urban gaze on variationist dialectology:
1. The view of urban as innovative (and rural as conservative) has strongly shaped models of geolinguistic innovation diffusion, and assumptions are made that cities are the sources, generators, and projectors of change.
2. The view of urban as a diverse and vibrant melting pot has certainly very strongly shaped variationist examinations of multiethnolects, though again diversity is often (and understandably) somewhat simplified for the purposes of empirical analysis.
3. Very recent research, often linked to work on multiethnolects, under the label ‘superdiversity’ (see Blommaert Reference Blommaert2013) (note the use of the mostly positive prefix super-) is, too, confined to urban locales.
4. Cities are often seen as ‘‘par excellence’ places of contact and heterogeneity’ (Miller Reference Miller, Miller, Al-Wer, Caubet and Watson2007: 1), associated with weak social network ties (yet many analyses that have demonstrated the local norm enforcement power of strong social networks have been carried out in cities, for example, in Reading [Cheshire Reference Cheshire1982], Belfast [Milroy Reference Milroy1987], and Brazlandia [Bortoni-Ricardo Reference Bortoni-Ricardo1985]).
4. Looking Beyond the Gaze
It is appropriate at this point to make it absolutely clear that I have no dispute with conducting variationist research in cities. I certainly do not deny that many linguistic innovations are generated in cities, that dialect contact can be especially intense in cities, or that the potential for the emergence of multiethnolects is particularly great. It is fully understandable why such research is usually carried out there, and equally understandable, as mentioned earlier, that in investigating complex communities, the full apparent diversity of the sociolinguistic setting cannot be readily captured methodologically, analytically, or theoretically. I have no complaints either with traditional dialectology’s focus on NORMs, or Tagliamonte’s (Reference Tagliamonte2013) comparative variationist sampling of only older speakers, given their research agendas, and, in the case of the traditional dialectologists, given their resources and technology (see Britain Reference Britain, Al-Wer and de Jong2009, Reference Britain, Hansen, Schwarz, Stoeckle and Streck2012). What I do want to highlight, however – and this is where we especially see the power of the gaze construct – is that both the urban and rural gazes, while directing our dialectological attentions in certain directions, hide from view other sites of sociolinguistic variation and change.
The rural gaze, directing us to see the dialectological countryside as isolated, conservative, and a preserve of linguistic heritage, diverts us from examining and interpreting urban areas in terms of conservatism and isolation. The patterns of linguistic variation and change that we encounter in the traditional dialectological enterprise are, we must not forget, the product of a distinct period. The informants of both Ellis and the SED were born in the nineteenth century, which saw massive population increases (a tripling of the population over the century), urbanisation, and a rural exodus. Millions left the countryside to seek their fortune in the city. In the twentieth century, however, it was the turn of a number of urban areas to experience demographic decline. Liverpool’s population has declined by almost 400,000 since 1931 (over 45 per cent), that of Manchester by 250,000. What are the dialectological implications of such extensive population decline? While sociologists and geographers are beginning to examine more closely the similarities among shrinking cities across the Western World – Detroit, Leipzig, Halle, as well as Liverpool and Manchester (see, e.g., Oswalt and Rieniets Reference Oswalt and Rieniets2006), there is the potential to begin to examine dialectological developments too in light of this demographic change. I have argued elsewhere that the types of changes currently underway in Liverpool (e.g. Watson Reference Watson2006) are not atypical of those usually associated with variation and change in isolated communities – both resistance to and divergence from outside supralocal changes (Britain Reference Britain, Hansen, Schwarz, Stoeckle and Streck2012).
Furthermore, the rural gaze, in presenting the countryside as an isolated, remote agricultural preserve, obscures the dramatic economic shift in some rural areas away from agriculture and towards consumption, especially tourism. In Britain (Reference Britain, Schreier and Hundt2013), I argue that we cannot underestimate the dialectological importance of fleeting and mundane but mass-scale mobilities (and changes in those mobilities) triggered by, for example, tourism and consumption. But the anonymous and the fleeting are associated with an urban not a rural gaze.
The urban gaze, meanwhile, has tended to obscure examination of a number of demographic changes, some substantial, that have affected the countryside. While, as far as the impacts of migration are concerned, the dialectological gaze has been firmly fixed on international arrivals and the creation of new multi-ethnic dialects in cities, rural areas, on the other hand, have been experiencing a demographically more substantial impact from internal migration, especially, but not solely, triggered by counterurbanisation, an overall demographic shift from city to country. Allinson (Reference Allinson2005: 171), for example, shows not only that year on year there were around 300,000–400,000 moves from metropolitan areas to non-metropolitan areas, there were, in addition, again year on year, between 600,000 and 800,000 moves from one non-metropolitan area to another. These figures are considerably more significant than moves to or within metropolitan areas. Champion’s (Reference Champion2001, Reference Champion and Chappell2005a, Reference Champion2005b) analyses showed that it was the most rural areas of England that have been the most significantly affected by counterurbanisation (see also Champion et al. Reference Champion, Coombes and Brown2009).
Interestingly, the rural idyll is held responsible for a good proportion of this counterurbanisation movement, with urban residents influenced by the rural gaze (and the anti-urbanist one) departing for the ‘good life’ in the country. But counterurbanisation is not the only form of mobility that has caused massive demographic churn in rural areas over the past half century (see further Britain Reference Britain, Llamas and Watt2010, Reference Britain2011, Reference Britain, Schreier and Hundt2013). Despite this, however, there are few empirical dialectological studies examining change in the light of the very socially differentiated nature of counterurbanisation and other similar forms of internal mobility (for examples, see Piercy Reference Piercy2010, Britain Reference Britain2011, Reference Britain, Schreier and Hundt2013, in preparation).
It is also important to note that rural demographic churn is not restricted to the twentieth century. Pooley and Turnbull (Reference Pooley and Turnbull1998: 93–146), in a detailed account of mobility in Britain since the 1700s, demonstrate that, whilst there is, throughout the eighteenth and nineteenth centuries, an overall migratory shift from rural to urban, movement up the urban hierarchy only narrowly outstrips movement down. There was considerable mobility within rural areas, and overall shifts were predominantly of a relatively local, relatively short-distance nature. The eighteenth- and nineteenth-century English countryside was neither static nor straightforwardly or wholeheartedly depopulating. And whilst agricultural workers have been the least likely to move long distances, the proportion of the population actually employed in agriculture has declined from 22 per cent in 1841 (Phillips and Williams Reference Phillips and Williams1984: 38) to less than 1 per cent today. Even in the nineteenth century, but especially in the twentieth, a sample consisting of non-mobile farm labourers fails to representatively capture the typical demographic of rural England.
A related consequence is that we have almost entirely failed to examine the dialectological ramifications of international migration to the countryside. One extremely widely held view is that international migrants always head for the city. While there has been a tendency for immigration to be city-bound in the past century, rural areas too have also experienced periods of significant arrivals from abroad. The Commission for Rural Communities (2007: 11) examined migration to rural areas in light of the addition of eight Eastern European countries to the EU in 2004. They showed that the district with the highest number of new work registrations in the country, one way in which institutions have measured EU-internal migration in the absence of border counts, was rural Herefordshire; a number of other rural areas also saw significant numbers, especially relative to the size of the local population, including south Lincolnshire,Footnote 10 Cambridgeshire, West Norfolk (essentially the Fens), and parts of rural Somerset and north Devon. The 2011 census also shows how some small rural towns have seen dramatic demographic change since 2004.
Figure 8.1 shows the non-UK born population of three small Fenland towns between 2001 and 2011, and highlights the impact of the post-2004 EU accession states of (mostly) Eastern Europe. Similarly, a number of rural areas have significant and relatively stable migrant populations – for example, the significant Portuguese community in the small Norfolk towns of Thetford, Dereham, and Swaffham (Pina et al. Reference Pina Almeida and Corkill2010: 36).Footnote 11

Figure 8.1: The percentage of the population of three small Fenland towns born outside of the United Kingdom (in pre-2004 member states, in the new post-2004 accession states, and elsewhere) from the 2001 and 2011 census.
Recent research has also highlighted that historically, too, rural areas have been the destination of immigrants. The England’s Immigrants project at the University of York’s Centre for Medieval Studies has revealed that a significant number of international arrivals in medieval times settled and worked in rural areas.Footnote 12 Our urban gaze expects multiethnolects in the city, but not in the countryside, so as yet there appear to be no studies of Multicultural Rural Englishes in the literature, not because they do not or cannot exist, but again because we have not looked.
Our expectations that linguistic innovations have urban sources have largely led us not to seek innovation in the countryside, but, if studies have been conducted at all, examine the impact of urban innovations on the countryside. I am to some extent guilty of that myself (Britain Reference Britain2005), but not entirely. In Britain (Reference Britain1997), I examine contact-based innovations that had a rural source. Our view of the countryside, then, is one of conservatism, not entirely because we have regularly empirically examined rural sites and found it to be that way, but also because we largely have not looked or, at least, not looked for the right things.
5. Conclusion
I certainly do not want to claim that we would find typologically different manifestations of linguistic change if we were to investigate the ‘superdiverse’ countryside, or conservatism in cities, or the consequences of commuting in remote villages. We may well, however, locate innovations, witness the emergence of new ethnolects, or discover the consequences of unresearched contact situations if we are aware of the limitations circulating ideologies place on not only how we look, but how and where we investigate, and also how we interpret the dialectological landscape. Our job as dialectologists is to unpick and deconstruct those forces which are causing language variation and change to operate with different outcomes in different places. Ultimately, the very same cultural, economic, social, and political processes and conflicts can affect rural areas as affect urban – perhaps less routinely, less visibly, less intensively (or of course more routinely, visibly, intensively), but affect them, nevertheless. In examining the rural and urban gaze, I hope to have demonstrated not only the role that ideological forces play in propelling us to dialectologically examine rural and urban areas in certain and distinctive ways, but also how those forces can prevent us from looking at these landscapes in ways that would be innovative, productive, and significantly add to our understanding of what is possible as language varies and changes.


