Weathering the storm at the Qingtu Lake Observation Array

20 October 2021
Last update: 26/11/21 16:01
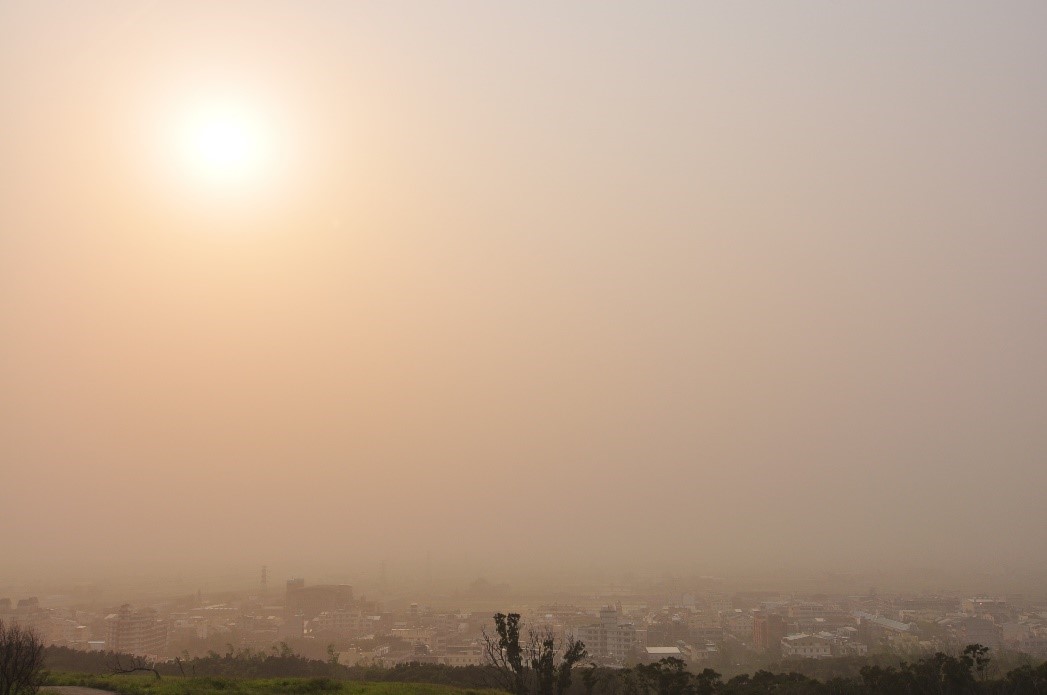
On July 25th, 2021, a wall of sand engulfed the Chinese city of Dunhuang. As the dust rolled in, the air in the city took on a nearly opaque burnt orange hue that made travel practically impossible. At its worst, visibility was reported as dropping below 800 m and meteorologists urged people to remain indoors with windows shut. And yet, despite the seemingly apocalyptic images of the event, this is nothing out of the ordinary for northwest China’s stormy season. Just months before, in March of 2021, China’s capital of Beijing was enveloped by what was considered to be the worst sandstorm of the last decade. The dust blew in from the Gobi Desert in the west and caused hundreds of flights across the country to be cancelled. Clearly, these phenomena can be intense and pose serious risk to life and property, and China has been active in a reforestation campaign to help mitigate some of the causes of these storms. But, an understanding of the structure of these storms could help predict, prepare for, and ultimately avoid a potential disaster. Researchers like Hongyou Liu and Xiaojing Zheng with the Qingtu Lake Observation Array are hoping to do just that.
South of the Gobi Desert and hundreds of miles west of Beijing, in the province of Gansu, there is an observation station. This station – the Qingtu Lake Observation Array (QLOA) – is in the dry, flat bed of what was once Qingtu Lake, and the surrounding environment is sparce. In the 1950’s, increasing agricultural demands in the region required more and more water to be diverted to farms, leading to a significant decline in ground water levels. By 1959, Qingtu lake had dried out completely, and in response to the rapid desertification, much of the area’s population has since been forced to move southward to cities and more fertile grounds. It has also turned the empty expanse of Qingtu lake and the surrounding deserts into some of the most active areas for dust and sandstorms in all of China, and as a result, has created a unique location to study large-scale turbulence, the flow of particulate matter, and dynamics in the atmospheric surface layer.
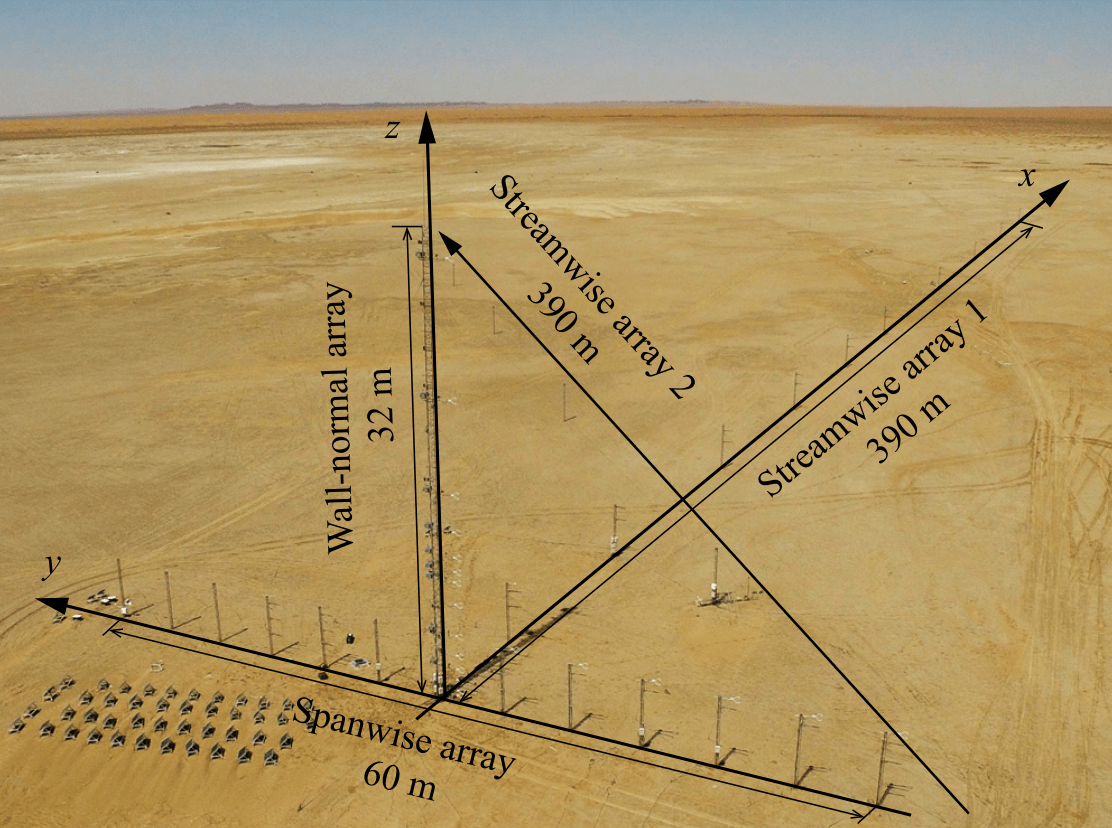
From pictures like the above, the observation array is as plain and utilitarian as it gets – looking more like the Cartesian coordinate system than a high-tech science station. But, if you were to stand beneath it, you would likely be in awe of its sheer scale. The observatory is really an array of metal arms and towers stretching 390 meters along one axis and reaching 32 m high with its tallest tower. Each tower is covered in a variety of sensors; sonic anemometers allow for wind-speed measurements, aerosol monitors collect data on the particulates in the air, and three-dimensional vibrating-reed electric field mills track the electric fields generated by the collisions between dust and sand particles. These instruments cover each of the towers, creating an enormous three-dimensional observation mesh that is synchronized in time by GPS. As a result, highly detailed, three-dimensional measurements of wind velocity, temperature, and electric field intensity can be made.
With this suite of instruments, the QLOA collects data on large-scale turbulence in the atmospheric surface layer to characterize the features of wind-blown sand flows and sandstorms. But, research into these sorts of flows has not been easy. The air velocity during these storms, coupled with the size of the boundary layer (the thickness over which turbulence and other flow-based features are influenced by the ground), and the low viscosity of air, makes atmospheric surface layer dynamics uniquely difficult to reproduce in smaller-scale lab environments. Similarly, the dynamics that occur during these events are computationally expensive to simulate. These fluid dynamics processes are non-linear; small perturbations to the flow can grow in wild and chaotic ways. This means that large-scale features in the flow of a storm can be significantly affected by much smaller structures, which makes coarse-graining of simulations to save computational power a precarious strategy.
The particles carried on the wind during a sandstorm can also affect the dynamics of the system. As the particles themselves are tossed and tumbled against each other, electric fields up to three orders of magnitude larger than typical, day-to-day ambient electric fields can develop. A build-up of electrostatic charge among the sand and dust has been shown to affect how easily particulates are lifted by the air flow, and in extreme environments like Mars and during volcanic eruptions, it is possible for lightning strikes from electrified dust storms to cause unlikely electrochemical reactions in the soil. One of the unique features of the QLOA is that it can measure the flow of particulates during a storm while simultaneously measuring the electrical field generated by the suspended particles. Researchers working on the QLOA can use this data to reconstruct three-dimensional maps of the generated electric fields while also tracking the air and particle flows. The hope is that combining these results will allow for a better understanding of how these features relate and affect one another.
There are many factors that affect the processes governing a sandstorm, yet the data on them is sparse. However, as desertification proceeds, developing an understanding of the dynamics of two-phase flows (dust/sand and air) will become increasingly important to mitigate damage to both natural and human-made environments. To date, the QLOA site has collected over 7400 hours of observational data with its array of sensors, some of which includes particle-free, steady wind flows in addition to the chaotic and turbulent particle-laden flows that happen during storms. As more data is collected, Xiaojing Zheng and colleagues will seek to answer specific questions like how suspended particles influence turbulence structures during sandstorms, as well as trying to develop a more fundamental understanding of natural and industrial processes where dust couples with flow to generate electric fields. To date, the results from several QLOA studies have been published in the Journal of Fluid Mechanics (JFM) and a review of the state of the literature on large-scale turbulent structures and two-phase flows has recently appeared in FLOW, the open-access companion journal to JFM. The review contains more details on the types of measurements the QLOA is capable of, as well as an overview of the physical processes at play during sandstorms, and an outlook on the future of boundary layer atmospheric research and two-phase flows.
In addition to publishing interdisciplinary and widely-interesting research, FLOW is committed to making research accessible through articles like this. Be sure to follow Flow and the Journal of Fluid Mechanics on Twitter to stay up to date with the latest developments in the field and see what is featured next on the blog.
Related Posts

Australia’s Response to the Coronavirus Pandemic – Now updated
From time to time, until the crisis has passed, the HEPL blog series authors will be given the opportunity to provide short updates on their country/region’s continuing response to this worldwide catastrophe and their further reflections on those responses. Each update will be labelled accordingly with the original response at the bottom of each post. […]
Spain’s Response to the Coronavirus Pandemic – Now updated
From time to time, until the crisis has passed, the HEPL blog series authors will be given the opportunity to provide short updates on their country/region’s continuing response to this worldwide catastrophe and their further reflections on those responses. Each update will be labelled accordingly with the original response at the bottom of each post. […]

Can you dig it? Parasites influence the rates of bioturbation in lakes and rivers
The impact of parasites can often reach beyond their individual hosts, shaping populations and communities in their ecosystems. Parasites often control the behaviour of their hosts, leading to their role as “ecosystem engineers,” changing the ways in which the hosts physically shape their environments.
India’s response to the Coronavirus Pandemic – Now updated
From time to time, until the crisis has passed, the HEPL blog series authors will be given the opportunity to provide short updates on their country/region’s continuing response to this worldwide catastrophe and their further reflections on those responses. Each update will be labelled accordingly with the original response at the bottom of each post. […]


