Cross-cultural correlations must be interpreted with caution

18 October 2023
Last update: 02/11/23 14:04
Is human cultural diversity partly shaped by the diversity of environments in which human societies live? Finding that a particular cultural feature is significantly associated with specific environmental variables adds weight to an argument that human diversity is shaped by environment. For example, many aspects of human cultural diversity have been found to correlate with parasite load, and these correlations have been interpreted as support for the hypothesis that cultures with high pathogen load develop features that limit the chance of infection, such as ritualized behaviours, xenophobia, belief in supernatural agents, and inclusion of antimicrobial ingredients in food.
The problem is that it’s surprisingly easy to generate significant correlations between human cultural diversity and environmental features. For example, a significant correlation between frequency of beards in a population and pathogen load has been interpreted as evidence that beards act as an indicator of male quality in high pathogen environments. But we should be cautious about accepting this correlation as evidence of a causal connection between parasites and beards. If you choose any cultural feature that is more similar between neighbouring cultures, you may find that it correlates with other cultural features or environmental variables that are also similar between neighbours, even in the absence of any causal connection between the two features. For example, beard frequency is also correlated with alcohol consumption per person per year, number of nurses and midwives, and population size. These significant correlations are unlikely to be interpreted as evidence for a causal connection, yet the statistical evidence is just as strong as those that have been used to support the parasite stress theory.
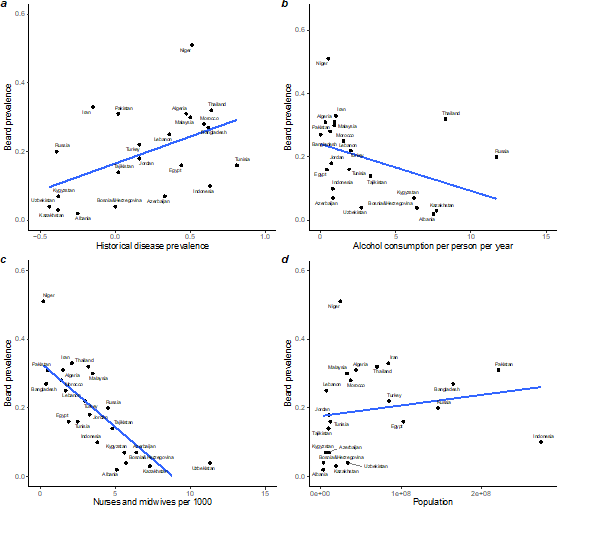
Figure 1: Correlation between frequency of beards and aspects of human societies: see Bromham L, Yaxley KJ (2023) Neighbours and relatives: accounting for spatial distribution when testing causal hypotheses in cultural evolution. Evolutionary Human Sciences 5:e27. Data on beard frequency from Pazhoohi F, Kingstone A (2020) Parasite prevalence and income inequality positively predict beardedness across 25 countries. Adaptive Human Behavior and Physiology 6:185-193.
Because pathogen load is similar often between neighbours, it will tend to correlate with cultural features that are also similar between neighbours, such as cheese consumption and number of medals in the last summer Olympics (Figure 2). The hypothesis that pathogen stress fosters belief in supernatural forces has been supported by a correlation between belief in the devil and pathogen load. But if neighbouring cultures tend to be more similar in their belief in the devil than two cultures chosen at random, then we expect belief in the devil to correlate with many cultural or environmental traits that are similar between neighbours, even in the absence of any causal connections. In fact, it is not difficult to find factors that correlate with belief in the devil, such as number of fatal traffic accidents.

Figure 2: Parasite stress is correlated with many cultural variables. Data on Belief in the Devil and historical pathogen prevalence from Bastian B et al. (2019) Explaining illness with evil: pathogen prevalence fosters moral vitalism. Proceedings of the Royal Society B 286(1914):20191576. For other variables see Bromham L, Yaxley KJ (2023) Neighbours and relatives: accounting for spatial distribution when testing causal hypotheses in cultural evolution. Evolutionary Human Sciences 5:e27.
The take home message is simple: any graph where the points are countries or cultures or languages should be scrutinized carefully. If points cluster by location (e.g. cultures from one part of the world tend to all have similar values) or by relationship (e.g. related languages tend to cluster together), then the p-value and slope may not be valid, because an assumption of the test is not satisfied. Most statistical tests used in cross cultural analysis assume statistical independence of datapoints, but countries, cultures, and languages are not independent because they share history and their environments. If knowing the value of a variable for one culture allows you to predict its value in neighbouring countries, then the assumption of independence is violated.
A simple first step is to plot the values on a map and ask if they show distinct spatial patterns. For example, languages with a single word for hand-and-finger are more likely to be endangered than languages that have separate words for hand and finger. Plotting the data on a map suggests a possible explanation for the correlation. Many languages with a single semantic category for hand-and-finger are in North America and Australia, which both suffered colonial suppression of Indigenous languages.

Figure 3: Global distribution of languages with a single semantic category for hand and finger
(triangles) and languages with separate sematic categories for hand and finger (cross) for the 593 languages with this variable recorded in the World Atlas of Linguistic Structure (WALS) database. Colour of triangles and crosses indicate the endangerment status of each language: see Bromham L, Yaxley KJ (2023) Neighbours and relatives: accounting for spatial distribution when testing causal hypotheses in cultural evolution. Evolutionary Human Sciences 5:e27.
Another simple diagnostic is to label points on a graph and look for clustering of neighbours and relatives. For example, correlations between number of spices per recipe, temperature and parasite load have been interpreted as evidence that spices are favoured in places with a greater risk of food-borne infection. Spice use correlates with foodborne infection rates, but also with other poor health outcomes, like fatal traffic accidents. Poor health outcomes tend to correlate with wealth, so Gross Domestic Product per capita is a better predictor of spice use than temperature, parasite load, or rates of foodborne infection.

Figure 4: Any variable that is spatially clustered, such as Gross Domestic Product per capita (GDPpc) could incidentally correlate with any other variable that shows similar patterns of spatial clustering, such as spiciness of food. (a) Map from OurWorldInData.org published under CCBY licence. (b) Average number of spices per recipe plotted against GDPpc reproduced from Bromham et al. (2021) There is little evidence that spicy food in hot countries is an adaptation to reducing infection risk. Nature Human Behaviour 5(7):878-891
This doesn’t meanthat variation in the spiciness of cuisine is caused by GDP. We could add other variables with a similar spatial distribution and find that they also show a strong statistical correlation. While we can weigh up the relative explanatory power of different variables, it may be difficult to rule out indirect association via some other, unmeasured, variable.
There are a range of statistical approaches to diagnosing the influence of proximity and relationships on cross-cultural correlations, and a battery of statistical tools to analyse spatially and phylogenetically structured data. Using these tools helps to prevent being led down unhelpful explanatory paths based on indirect relationships generated by similarity between neighbours and relatives.
For more information see: Bromham, L., & Yaxley, K. (2023). Neighbours and relatives: Accounting for spatial distribution when testing causal hypotheses in cultural evolution. Evolutionary Human Sciences, 5, E27. doi:10.1017/ehs.2023.23
Related Posts
Tyrolean stigmata in England: the voyage of the supernatural in the nineteenth century
Two young women in villages less than ten miles apart drew international attention from devout Catholics and sensation seekers.

The effect of heat damaged feed on pigs
Many of the feed ingredients that are used in formulating diets for pigs have gone through heating or drying to make the ingredient stable for conservation. However, every time heat is applied to a feed ingredient, there is a risk that the ingredient can be overheated, which will result in the Maillard reaction that induces heat damage to the ingredient.

International Day of Awareness of Food Loss and Waste
September 29th is designated as the International Day of Awareness of Food Loss and Waste by the United Nations General Assembly and is co-convened by the Food and Agriculture Organization and the United Nations Environment Program. This day aims to highlight the importance of the food waste problem with a focus on possible solutions and […]

Did COVID-19 Increase Xenophobia? Results from a Four-wave Longitudinal Study
The global pandemic brought unprecedented challenges and changes to societies worldwide. Beyond the immediate health crisis, there was a significant impact on our social lives. One area of concern was whether the heightened risk of infectious diseases would lead to increased xenophobia—fear or hatred of foreigners and immigrants. A popular hypothesis from the behavioral immune system literature said yes. It suggests that negative attitudes toward outgroups serve pathogen-neutralizing functions.


