1 Public Opinion and Rising India
India is an increasingly pivotal player in international politics in the twenty-first century. Its growth over the last three decades has created one of the world’s largest economies. Its strategic value as a partner against China has increased its importance to the United States and the West, even as it seeks to maintain historically strong ties with Russia and is developing its own relations with the Gulf states and Southeast Asia. India’s foreign policy elites now call this constellation of relations a “multi-alignment” strategy (Jaishankar, Reference Jaishankar2020) that seeks to leverage competition among other great powers to move supply chains into India, to create new technology sharing arrangements, and to gain political support for its goals globally. This is intended to help India carve out a strong position in what New Delhi sees as an emerging multipolar world. India also faces new challenges, such as a growing Chinese footprint in its region that has empowered smaller states to push back against Indian influence.
India is also the world’s largest electoral democracy. Its domestic politics are often highly competitive, with a mass public that some suggest has become increasingly attuned to international affairs. Indeed, crises with Pakistan in 2019 and 2025 and with China starting in 2020 quickly entered domestic political competition, with the ruling party and opposition clashing over whether the government handled these incidents properly. While there is generally a difference between actual policy choices and mass attitudes in foreign policy (both in India and other countries), there is still great value in understanding how the Indian public has viewed other major global powers, both in the distant past and recently: public sentiment may act as a constraint or accelerant for policymaking, especially if mobilized as part of domestic political competition.
To understand how India’s public views and has viewed other major global powers, this project uses dozens of surveys measuring Indian opinion toward China, Russia/USSR, and the United States over six decades. We explore specific questions about past and present foreign policy issues associated with these powers, from the border dispute with China to the Soviet intervention in 1980s Afghanistan, as well as general favorability toward these major powers. With important caveats, these insights can help us understand the areas where India’s government appears to have more and less domestic political space for policy maneuver in a world where Indian relations with the US, China, and Russia are essential to its foreign security and economic policies.
In this Element, we explore three topics. First, we ask how Indian respondents have viewed the United States, China, and Russia/USSR over time, both generally and regarding specific issues. This is descriptive historical information that has not been systematically gathered in a single place. Quantitative description is especially valuable when it comes to India, where historical trends in public opinion have received far less attention from political scientists than other democracies like the United States or United Kingdom. Second, we ask what structures individual respondents’ foreign policy views – and propensity to answer questions about these countries in the first place – to identify the characteristics of India’s “foreign policy public” and fine-grained patterns within it. Third, we identify future research questions that arise from our study, including better understanding of elite-mass gaps in opinion, how malleable mass opinion in India is to media and political cues, and sources of individual-level variation. We also explore the trends that analysts should pay attention to in the years to come, from the ways that foreign affairs feature in election campaigns to the effects of growing social media exposure on how the Indian public engages with the world.
Public Opinion and Foreign Policy in the Literature
Public opinion research has long identified a distinction between “hard” issues for opinion formation and issues that are “easy” (Carmines and Stimson, Reference Carmines and Stimson1980). Because foreign policy considerations are, as the name suggests, relatively remote from the daily experiences of most democratic citizens and perhaps harder issues in general (Rosenau, Reference Rosenau1961), a vibrant literature has investigated the sources of foreign policy opinions, whether those opinions are coherent, and whether public opinion constitutes a practical constraint on foreign policy.
Two schools of thought are particularly relevant for interpreting evidence from India. One holds that democratic citizens have relatively coherent attitudes about foreign policy issues (Holsti, Reference 78Holsti1992; Page and Shapiro, Reference Page and Shapiro1992; Kertzer, Reference Kertzer2013; Rathbun et al., Reference Rathburn, Kertzer, Reifler, Goren and Scotto2016), and that their attitudes may not substantially differ from the attitudes of elites and experts (Mattes and Weeks, Reference Mattes and Weeks2019; Kertzer, Reference Kertzer2020, but see Scholten and Zhirkov, Reference Scholten and Zhirkov2025).Footnote 1 Citizens take meaningful positions, this school suggests, on many aspects of foreign policy, including reconciliation with historic enemies (Mattes and Weeks, Reference Mattes and Weeks2019), use of military force (Tomz, Weeks, and Yahri-Milo, Reference Tomz, Weeks and Yarhi-Milo2020), distaste for casualties (Mueller, Reference Mueller1971), and a preference for multilateralism (Chaudoin et al., Reference Chaudoin, Milner and Tingley2010). A second view holds that, while stable patterns in public opinion clearly exist, they are created by some form of cueing. Citizens in democracies do not form foreign policy opinions so much as they adopt them from trusted sources, like political leaders (Berinsky, Reference Berinsky2007, Reference Berinsky2009; Baum and Groeling, Reference Baum and Groeling2009; Guisinger and Saunders, Reference Guisinger and Saunders2017; Saunders, Reference Saunders2018), media elites (Zaller, Reference Zaller1992), or social peers (Kertzer and Zeitzoff, Reference Kertzer and Zeitzoff2017).
Lurking below the content of opinions expressed in surveys, some literature in American politics identifies differences in the backgrounds of people who do and don’t voice opinions. The “opinionated public” – people who respond to surveys – are on average wealthier and better educated and have systematically different opinions compared to people who respond “don’t know” (Berinsky, Reference Berinsky2004). The “public” whose opinion is measured might be a comparatively advantaged, nonrandom subset of the democratic public at large.
Understanding the source of foreign policy attitudes – both where they come from and who is expressing them – is practically important. Public opinion in democracies can constitute a conflict accelerant in some situations and a constraint on military adventurism in others (Fearon, Reference Fearon1994; Schultz, Reference Schultz2001; Caverley, Reference Caverley2014; Kreps et al., Reference Kreps, Saunders and Schultz2018; Mattes and Weeks, Reference Mattes and Weeks2019; Tomz et al., Reference Tomz, Weeks and Yarhi-Milo2020, among others).
The (in)coherence of public opinion is also key to explaining the relationship between democratic publics and foreign policy. The Hyde and Saunders (Reference Hyde and Saunders2020) “malleable constraints” framework, for instance, builds on earlier work (e.g., Bueno de Mesquita et al., Reference Bueno de Mesquita, Smith, Siverson and Morrow2003; Doyle, Reference Doyle1986; Russett and Oneal, Reference Oneal and Russett2001) with a new theory to explain how mass politics intersects the characteristics of political institutions to shape constraints on leaders. The cases generally used as examples in this literature tend to be drawn from the West, typically the US and United Kingdom. It is an open question whether these frameworks help explain foreign policy in other countries that have not occupied center stage in the past half century of empirical international relations research.
Research on Public Opinion and Foreign Policy in India
India is a natural case to compare to the US- and Europe-centric literature, since it combines extensive involvement in geopolitics with a vibrant, contentious domestic political arena (Narang and Staniland, Reference 80Narang and Staniland2018; Blarel, Reference Blarel2025). Our study builds on previous research focused on specific historical instances and issue areas where domestic politics and foreign policy interact in India. Among many, Sasikumar and Verniers (Reference Sasikumar and Verniers2013) study the US–India nuclear deal, Raghavan (Reference Raghavan2010) highlights domestic pressures on Nehru before the 1962 war with China, Hymans (Reference Hymans2006) ties domestic nationalist projects to nuclear proliferation, Gaikwad and Suryanarayan (Reference Gaikwad and Suryanarayan2019) show that caste hierarchy shapes views of globalization, Blarel and van Willigen (Reference Blarel and Van Willigen2021) explore how public opinion is manifested through federalism, Ogden (Reference Ogden2014) and Hall (Reference Hall2019) study the impact of Hindu nationalism on foreign policy, Plagemann and Destradi (Reference Plagemann and Destradi2019) link populism to shifts in the making of India’s foreign policy, Hintson and Vaishnav (Reference Hintson and Vaishnav2023) show the effect of casualties in an India–Pakistan crisis on voteshare for the incumbent party, and Narang and Staniland (Reference 80Narang and Staniland2018) argue that “accountability environments” vary across governments and issues in India.
Despite clear interest in how domestic politics affect India’s foreign policy, there is more limited research on the role of public opinion. Some studies use elite surveys (Cortright and Mattoo, Reference Cortright and Mattoo1996; Ganguly et al., Reference Ganguly, Hellwig and Thompson2016), which are incredibly valuable, but may not reflect attitudes held by the general public. Prefiguring the trends we identify further, the most influential public opinion studies (Kapur, Reference Kapur2009, Reference Kasara and Suryanarayan2015; Clary et al., Reference Clary, Lalwani, Siddiqui and Sircar2022) find striking differences in response rates across different socioeconomic strata. Most major public opinion surveys recently conducted in India (such as a series from the Centre for the Study of Developing Societies) include few foreign policy questions, though there are important exceptions in recent years, which we draw upon in our analyses.Footnote 2
Can Indian Public Opinion toward Foreign Affairs Shape Politics and Foreign Policy?
Previous research has been valuable, but has not established a clear or unambiguous link between public views and policy outcomes. While it is unlikely that public opinion exerts a major influence on foreign policy all the time, we suggest that public opinion can – under particular political configurations – help to shape both domestic political competition and policy decision-making.
To begin with, our empirical analysis in the following text shows that there is a meaningful structure of attitudes within the “foreign policy public” that does not appear to be purely top-down or dominated by elite cues. These attitudes create a latent possibility for political mobilization around foreign policy issues, even if such mobilization is not the usual pattern in Indian politics (nor, to be clear, in most countries most of the time).
Two effects can then emerge. Even in situations in which the government pursues a policy at odds with latent public opinion, concerns about overstepping public opinion and triggering a political response may impose some “outer bounds” on the government’s decisions. The Modi government pursued a China policy at odds with public opinion during the 2010s without seeming to suffer electoral costs, showing a gap between policy and public views. However, this policy did not compromise on the border dispute or pursue particularly deep or ambitious forms of cooperation. It seems plausible – though hardly certain – that certain policies are not pursued because they would be seen as politically risky at home: There may be “dogs that don’t bark” because of these anticipated domestic political costs. The China issue was not very salient, but dramatic moves that moved beyond the core domestic consensus about an acceptable border settlement very plausibly could have triggered political mobilization, as we saw in the run-up to the 1962 war with China. We discuss these dynamics more in Section 6 as we look forward to possible future trajectories.
Furthermore, the political salience of foreign affairs is a variable, not a constant (Narang and Staniland, Reference 80Narang and Staniland2018), meaning that sometimes foreign policy in fact does become electorally relevant. Evidence suggests that sometimes foreign affairs are linked to political behavior in India. Most recently, Ladwig (Reference Ladwig2025) examines parliamentarians’ questions, finding that “foreign security policy is not the policy area of utmost importance to Indian politicians, but nor is it neglected” (4); there is consistent interest in foreign security policy, even if it is also not the most important. Interestingly, this is especially true of MPs facing electoral challenges: “Marginal MPs ask more questions about defense and external affairs than their more electorally secure colleagues” (4), which suggests that there may be some relationship to political competition.
Importantly, there are also prominent historical cases in which public opinion and political mobilization were mobilized around (non-Pakistan) foreign policy concerns. The most striking was the pressure on Nehru to stand firm on the border dispute with China from 1959 to 1962, expressed through a variety of mechanisms, including parliamentary criticism, intraparty pressure, and press editorials. We also saw the Communist Party of India split in 1964 in large part over how to react to the conflict with China, Mrs. Gandhi mobilizing the “foreign hand” as an election strategy in the late 1960s and 1970s, domestic battles over the US–India civil nuclear deal in 2008 (including parties leaving the ruling coalition), and Indian National Congress criticism of Modi over his handling of the Galwan crisis in and after 2020.
We certainly do not claim a straightforward line between public opinion and political outcomes (including actual foreign policy) in any of these cases, but they all clearly involved either the open mobilization of foreign policy by politicians or disagreements around foreign policy that divided parties and/or were deployed by oppositions against sitting governments. These are moments in which public opinion, at minimum, appears to have shaped politicians’ rhetoric and behavior toward foreign policy. This means that, in addition to the basic scholarly value of providing systematic data on this topic, there is potential political importance that flows from better understanding the structure of Indian public opinion toward the major powers.
A Brief Overview of Indian Foreign Policy
Some historical background on Indian politics and foreign policy will help contextualize the survey data we discuss in the sections to come. At independence in 1947, India quickly became embroiled in a war, beginning a long-running militarized rivalry with Pakistan over Kashmir. Relations with the People’s Republic of China were initially reasonably friendly, and Indian Prime Minister Jawaharlal Nehru hoped that the two countries could together form a nonaligned bloc distinct from the US–Soviet Cold War competition. Yet by the late 1950s, India–China tensions had emerged over the delimitation of their border. Nehru, leading the dominant Indian National Congress (INC), faced public and parliamentary pressure not to back down in the face of Chinese coercion after border clashes in 1959. India–China disagreements escalated over the next three years, culminating in an Indian defeat in the 1962 India–China war.
The rivalries with Pakistan and China both shaped India’s general foreign policy orientation. On the one hand, Pakistan’s tilt toward the United States and active American support for the Pakistani military (as part of its Cold War containment strategy) made India deeply leery of the US and UK. Nehru’s pursuit of nonalignment had many sources, but one of them was an effort to avoid the entanglements of the Cold War and to find leverage against Western interventions in South Asia. On the other, defeat by China led India to look to the US (as well as the Soviet Union) for arms and political backing.
As the 1960s progressed, however, India became increasingly at odds with the US around Vietnam, Pakistan, and aid. Indira Gandhi, now leading the INC, started to pursue a more leftist domestic agenda while successfully fending off internal political challenges. In 1971, the US supported Pakistan even as it engaged in large-scale human rights abuses in East Pakistan. The year 1971 saw India sign a treaty with the USSR, defeat Pakistan in a conventional war (creating an independent Bangladesh out of the former East Pakistan), and become further estranged from the US.
This estrangement continued over the 1970s, since the American rapprochement with China now left India more exposed, with China on good terms with Pakistan and now the US. Fortunately for India, the turmoil and retrenchment in China of the late 1960s and the 1970s pulled China back from its more ambitious foreign policy efforts; its recovery from this period of chaos was focused on internal economic development. The border dispute continued, but at a much lower level. The USSR continued to be a reliable partner for India on the international stage. Mrs. Gandhi became largely consumed with internal politics, including the imposition of the authoritarian emergency from 1975 to 1977.
The 1980s saw Mrs. Gandhi return to power after a brief interregnum from 1977 to 1980. She was assassinated in 1984 and her son Rajiv Gandhi took power. India began pursuing a tentative exploration of closer ties with the US and nascent moves toward globalization. The 1989–1999 period marked a major change in the contours of both internal and external Indian politics and policy. In 1989, the era of Congress dominance came to an end – some flavor of coalition government would become the modal form of rule from Delhi until 2014 (Ruparelia, Reference Ruparelia2015). This radically shifted the domestic context, generating very complex patterns of coalition making and breaking that complicated efforts to reward or punish foreign policy choices (Narang and Staniland, Reference 80Narang and Staniland2018). Second, the collapse of the Soviet Union and an Indian economic crisis unsettled the standard assumptions of Indian foreign policy. Economic liberalization, including substantial opening to the global economy, accelerated. Third, a set of insurgencies began or escalated, including Pakistani-supported militancy in Kashmir that triggered a set of crises with Pakistan from 1989 through, most recently, 2025. Finally, India tested nuclear weapons in 1998 (followed closely by Pakistan).
The 1990s were a period of extraordinary change and tumult in Indian politics. In terms of major power politics, the US and India pursued a reengagement, Russia remained a useful partner but was largely consumed by its internal transformation with the end of the USSR, and China was not yet “back” in the region. In the 2000s, Indian growth accelerated and tension with Pakistan over terrorist attacks reemerged. Manmohan Singh and the Congress led coalition governments from 2004 to 2014, following BJP-led governments of Atal Bihari Vajpayee from 1998 to 2004.
In 2014, Narendra Modi and the BJP won a major victory, followed by reelection in 2019 and 2024. Modi’s time as prime minister is characterized by several new trends related to foreign policy. First, international affairs and India’s place in the world are increasingly central to Modi and the BJP’s campaigning and general branding. Second, increases in literacy, social media access, and news consumption have spread foreign affairs information more broadly than before. Third, China is back in South Asia in a substantial way, including major economic and political influence in Pakistan, Nepal, Bangladesh, Sri Lanka, and Maldives. As India has risen on the global stage, it has faced growing regional challenges due to this influence. Concern over China has been further accelerated by a more aggressive Chinese strategy along the disputed border – including clashes in 2017 and, especially, 2020 – and provision of high-end aircraft and missile systems to Pakistan, which used Chinese fighter jets in dogfights with the Indian Air Force during the 2025 crisis. China’s regional power and approach to the border dispute have increased China–India rivalry and made the PRC a more prominent issue in Indian foreign policy.
Fourth, India has moved closer to the US, Japan, and Australia (the Quad) and sought to generate more presence in Southeast Asia. Ties with Russia have also remained reasonably robust, despite US and European pressure and concern after the Russian invasion of Ukraine in 2022. India is now pursuing “multi-alignment” rather than firmly embracing any camp in world politics. Modi has made foreign policy more central in domestic political discourse (Vaishnav and Mallory, Reference Vaishnav and Mallory2024), harkening back to the 1970s when Mrs. Gandhi deployed both her victory over Pakistan and suspicions of the United States in domestic politics (McGarr, Reference McGarr2024).
The Plan of the Element
In Section 2, we outline the survey data we are using, their strengths and weaknesses, and provide a broad comparative overview of key trends in views of the US, Russia/USSR, and China. Section 3 begins with a wide-ranging summary of Indian views of China since the late 1950s, ranging from historical data during the Cold War to the most recent polls during and after the 2020 Galwan border clashes. It explores domestic determinants of these views, like the impact of partisanship, education, and region, and then studies a set of specific border crises to explore how quickly attitudes change in reaction to events.
In Section 4, we next turn to Indian opinion toward the United States and specific American foreign policies. The data show dramatic swings in Indian sentiment toward the US that broadly track major geopolitical trends, but that in some cases seem to precede actual policy shifts by India. We explore key correlates of these views, assessing similarities and differences with the China evidence in Section 3. Section 5 delves into a relationship that is understudied outside India, exploring how the Indian public has viewed Russia/USSR both during and after the Cold War. We find a trend of favorability that persists into the present, even as Western opinion toward Russia has become increasingly negative. The Indian public, as well as Indian foreign policy in general, can simultaneously hold pro-Russian and pro-American views, a finding that is crucial for understanding how India is likely to navigate an era of renewed major power competition and may hold insights for other “swing” states as well.
The concluding Section 6 identifies key research questions that arise from this study. It highlights new forms of survey research that can generate more representative samples on a greater number of key questions and advocates for more work that can explore when public opinion acts as a constraint in the Indian context. It then turns to policy implications. We expect continuing public backing for a strong relationship with Russia at the same time as a good relationship with the United States. There is substantial room for Indian political leaders to maneuver on policy toward both countries. Constraints are higher on policy toward China, however. While there is certainly space for a rapprochement or de-escalation, deeper concessions about the disputed boundary seem politically implausible given the depth of distrust toward China.
2 New Insights from Old Data
From 1953 until 1999, the United States Information Agency was an important face of the United States to foreign publics around the world (Kunczik, Reference Kunczik2016). Whether or not they knew the acronym, people around the world knew the USIA’s work. They recognized names like the Fulbright program, visited one of the 160 USIA libraries in over 100 countries, or listened to radio broadcasts from stations like Radio Free Europe, Radio Free Asia, and the Voice of America (USIA, 1994). Starting in earnest during the Kennedy administration, the USIA had another mission: A “systematic effort to measure world sentiment about the U.S. and major international issues” (Haefele, Reference Haefele2001, p. 65). The systematic effort persisted slightly past the dissolution of the USIA in 1999, ultimately producing well over 1,000 polls of public opinion in over 100 countries.Footnote 3
USIA polls covered India sixty times from 1959 until 2001. The surveys, conducted through a local contractor called the Indian Institute of Public Opinion (IIPO),Footnote 4 provide an unparalleled historical view of (urban) Indian’s attitudes about the wider world. The sampling and design, which we describe in more detail below, would not pass muster among social scientists in 2026, but the studies are nonetheless remarkable for their consistency and coverage. In an era where few researchers systematically measured Indian citizens’ foreign policy attitudes, USIA/IIPO polls measured feelings toward the United States but also the Soviet Union/Russia and China from 1,000 Indian citizens once or twice a year through most of the Cold War.
Datasets from thirty-nine USIA/IIPO polls between 1975 and 2001, plus top-line figures from twenty-one earlier polls for which complete data are not available, comprise our primary source of historical data for measuring Indians’ attitudes about the world during the twentieth century. If treated carefully, with respect for the limitations of the nonrepresentative sample they studied, we believe this historical public opinion data is a useful (and surprisingly underused) source for understanding change and continuity in Indian attitudes.
After the USIA/IIPO poll series sunsets in 2001, we turn to two modern scientific poll series to track Indian public opinion in the twenty-first century. Between data from the Gallup World Poll series and Pew Global Attitudes series, Indian attitudes about foreign policy are measured at least annually between 2006 and 2018. These surveys have important advantages in sampling and design over the IIPO polls, but they are less consistent than the vintage datasets in terms of question wording and inclusion. Given the various differences in method and wording, we primarily compare within these series (especially IIPO due to its consistency in wording and method) rather than making fine-grained comparisons across them.
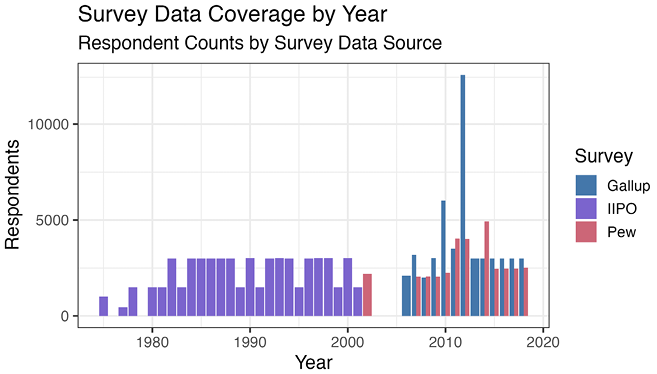
Our combined pool of data from USIA/IIPO, Gallup, and Pew measures Indian attitudes about foreign policy seventy-nine times across fifty-nine years. For fifty-eight of those surveys, stretching back to 1975, we can analyze respondent-level datasets comprising over 140,000 total responses and draw conclusions about the correlates of foreign policy attitudes (see Figure 1). To our knowledge, this is the largest and most wide-ranging collection of data assembled for political science research on Indian foreign policy attitudes. We supplement it with top-line results from more recent surveys, including by Pew, the Observer Research Foundation, and the Centre for Policy Research/CVoter.
Survey data coverage over time, from Pew, Gallup, and US Information Agency/Indian Institute of Public Opinion polls. Bars represent aggregate annual respondent counts, sometimes spread across multiple surveys throughout a year. The figure includes only those surveys for which respondent-level data were obtainable. Through the Element, we also refer to “topline” figures from an additional decade-plus of USIA/IIPO studies for which datasets appear lost.

In the rest of this section, we introduce the contents and the sampling of the survey data sources in more detail. We highlight strengths and weaknesses in both the historical USIA/IIPO data and the modern Pew and Gallup polls. We conclude the section by arguing that after accounting for the (considerable) weaknesses of historical survey sampling, the data are still useful. We analyze the correlates of response to foreign policy questions in the modern surveys (who responds “Don’t Know” to foreign affairs questions in the Gallup World Poll?) and find that the characteristics most predictive of voicing a foreign policy opinion in the 2000s and 2010s, like higher education and higher socioeconomic status, are similar to the major sampling biases in the Cold War era data and similar to the correlates of response identified in the broader public opinion literature (Berinsky, Reference Berinsky2009). While this finding should reduce concerns about comparing historical and modern opinion surveys in the subsequent sections, it also has substantial normative implications. In India, as in other contexts, discussions of public opinion about foreign policy are really discussions about the opinions of nonrandom and relatively advantaged subset of India’s citizens that we will refer to as the “foreign policy public.”
The USIA/IIPO International Images Polls
There are examples of high-quality public opinion research stretching back decades in postindependence India. Consistent, longitudinal studies suited to measuring opinion change over time are harder to come by, and the most prominent examples that exist (like the highly regarded National Election Studies conducted every five years by Lokniti) feature very few questions about foreign policy. Nearly biannual “International Images” polls from the IIPO, funded by the US Information Agency (USIA), are an important exception to the rule – our research endeavor in this Element is possible thanks to the Cold War foreign policy preoccupations of the United States (Kunczik, Reference Kunczik2016).Footnote 5
These Cold War era surveys, continuing through November 2001, consistently include three straightforward items that we use to track over-time trends and address some empirical puzzles about how the Indian public has viewed foreign countries. First, every survey asks respondents for their attitudes about the United States and the Soviet Union (later Russia), using the same question: “Please give me your opinion of the countries listed on this card. First, take the United States. Would you rank the United States as very good, good, neither good nor bad, bad, or very bad? How about the USSR?” These simple questions implicitly ask respondents to summarize policy opinions, personal or cultural affinity, recent news, and so on, into a single dimension of approval or disapproval. Most surveys also measure attitudes about the People’s Republic of China using the same question. As we discuss later, the fact that responses to these questions track major historical developments, in aggregate, suggests that the simple questions are effectively eliciting summaries of respondents’ recent considerations about a country (Zaller, Reference Zaller1992).
Because we are interested in the evolution of attitudes over time and in understanding how the Indian public has historically related to countries that are hugely consequential in the world system, we focus our analyses on these questions. We would be remiss not to mention for future researchers, though, that IIPO polls often, but less consistently, include other interesting questions measuring respondents’ attitudes toward other countries, from Pakistan and Bangladesh to Japan and France, and about specific international issues like nuclear proliferation, nonalignment, and the United Nations.
While IIPO surveys provide unparalleled historical breadth and consistency across time, analyzing them presents real challenges. The main issue is the construction of the survey sample, which is very clearly a product of its era. The IIPO surveys we analyze all exclusively target four major metropolitan cities in India: Delhi, Mumbai, Kolkata, and Chennai.Footnote 6 A typical survey wave comprises only 1,000 to 1,500 respondents, split evenly across the four cities. These respondents are not the average democratic citizen, especially in the 1960s–1970s when under a quarter of Indians were city dwellers (World Bank Group, 2023).
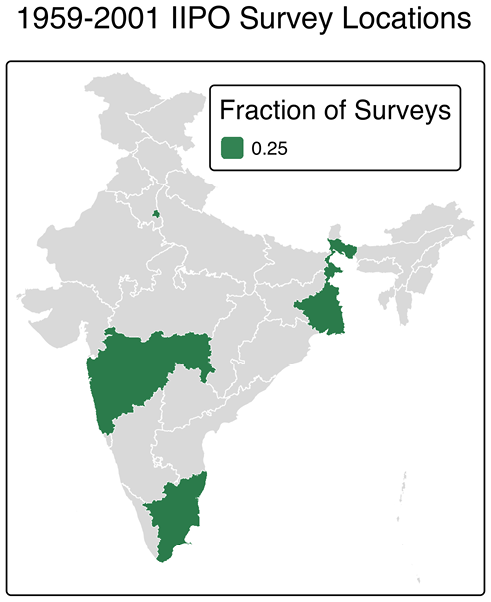
Excluding rural respondents is a genuine limitation of historical data, but there is reason to believe the surveys are at least not capturing something strange about Mumbai, Delhi, Kolkata, and Chennai specifically. A limited number of IIPO surveys from the 1960s (before respondent-level data is available) include more nationally-diverse urban samples, the results of which give reason to be confident that the four-city polls reasonably approximate urban opinion broadly speaking. The report from an August 1966 survey covering all state capitals notes that results from the poll show “the metropolitan cities here currently reflect urban opinion in large cities” (Indian Institute of Public Opinion, 1966). Figure 2 represents the geographic breadth (or narrowness) of the IIPO surveys.
IIPO survey locations shaded by present-day states. All IIPO surveys we analyze use a rough 25% quota in each of four metropolitan areas: Delhi, Mumbai (in Maharashtra), Chennai (in Tamil Nadu), and Kolkata (in West Bengal). The resulting geographic distribution is not nationally representative.
Within each metro area, the recruitment strategy resembles what we would now call a “convenience” sample. The resulting samples are disproportionately literate and well-educated, even for metropolitan cities. As we discuss further, this means the IIPO samples are tilted toward people who are most likely to voice foreign policy opinions.
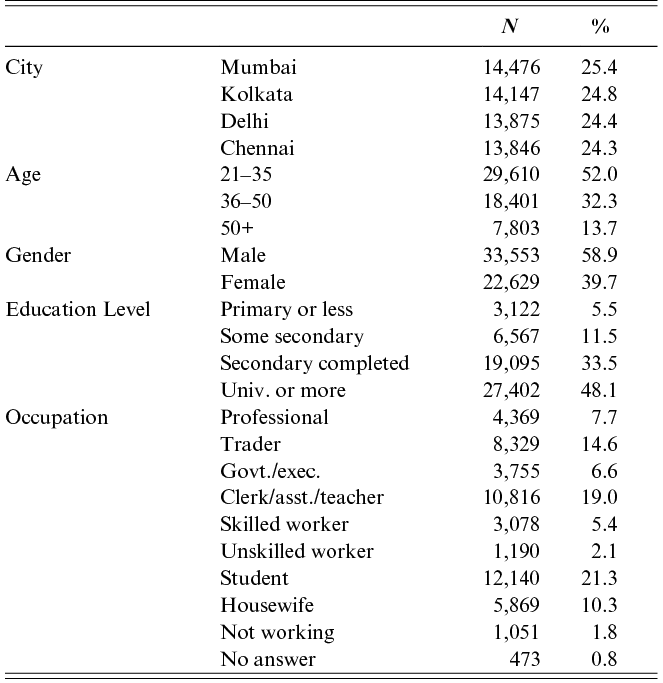
Table 1 presents summary statistics for the compendium of IIPO surveys that we analyze at the respondent level in the subsequent sections (i.e., survey waves starting in 1975). The tables show that in addition to being urban, we should also envision the typical IIPO survey sample as relatively young (half of the respondents are under 35, but the median age in India in the 1970s was under 20 (Chandra Sekhar et al., Reference Chandra Sekhar, Chari, Singh, Dutta, Koppad, Srivastava and Sabharwal1972)), slightly more representative of men than women, very highly educated, and unusually likely to be working in a trade, profession, or clerical role.

Table 1 Long description
“The table summarizes the demographic characteristics of survey respondents across five categories: city, age, gender, education level, and occupation. For each subcategory, the count (N) and percentage of the total sample are given. The total sample size can be inferred from the city breakdown, which sums to approximately 56,344 respondents.
By city: Mumbai (N = 14,476; 25.4%), Kolkata (N = 14,147; 24.8%), Delhi (N = 13,875; 24.4%), Chennai (N = 13,846; 24.3%).
By age: 21–35 (N = 29,610; 52.0%), 36–50 (N = 18,401; 32.3%), 50+ (N = 7,803; 13.7%).
By gender: Male (N = 33,553; 58.9%), Female (N = 22,629; 39.7%). Note: percentages do not sum to 100, suggesting a small share of non-response or other category not shown.
By education level: Primary or less (N = 3,122; 5.5%), Some secondary (N = 6,567; 11.5%), Secondary completed (N = 19,095; 33.5%), University or more (N = 27,402; 48.1%).
By occupation: Professional (N = 4,369; 7.7%), Trader (N = 8,329; 14.6%), Government/Executive (N = 3,755; 6.6%), Clerk/Assistant/Teacher (N = 10,816; 19.0%), Skilled worker (N = 3,078; 5.4%), Unskilled worker (N = 1,190; 2.1%), Student (N = 12,140; 21.3%), Housewife (N = 5,869; 10.3%), Not working (N = 1,051; 1.8%), No Answer (N = 473; 0.8%).
A supplementary statistics table for Table 1 gives summary statistics for three variables. Education has 1% missing values; the mean and median are both Secondary, the minimum is Illiterate, and the maximum is Post-Graduate. Income has 4% missing values; the mean is approximately Rs. 5,000/month, the minimum is less than Rs. 500, the median is Rs. 6,000–10,000, and the maximum is greater than Rs. 100,000. Age has no missing values; the mean is 36.7 years, the minimum is 18, the median is 35, and the maximum is 94.”
Twenty-First-Century Scientific Opinion Polling
Since the early 2000s, India has been regularly included in large-scale international survey series that measure foreign policy attitudes in dozens of countries. We use two series of polls, the Gallup World Poll and Pew Global Attitudes survey, which consistently include questions gauging respondents’ attitudes toward the United States, Russia, and China – albeit with different wording than the IIPO polls. Studies from Pew, fielded roughly every year in India from 2007 through 2018, measure attitudes with a question text that is highly consistent with the IIPO polls: “Please tell me if you have a very favorable, somewhat favorable, somewhat unfavorable, or very unfavorable opinion of [COUNTRY]” (Stokes, Manevich, and Chwe, Reference Stokes, Manevich and Chwe2017).
Gallup’s World Poll, fielded at least annually in India from 2006 until 2018, instead asks respondents’ opinions of the leadership of different countries: “Do you approve or disapprove of the job performance of the leadership of [COUNTRY]?” (English, Reference English2010). Despite different wording, we treat the questions from Pew and Gallup as conceptually similar but do not compare the data from the different surveys to each other directly. Data from Pew supports this choice; Stokes, Manevich, and Chwe (Reference Stokes, Manevich and Chwe2017) show that, in a particular year where the Pew Global Attitudes survey asked both questions, Indians’ general attitudes toward the US/China are similar to opinions of the country’s leadership.
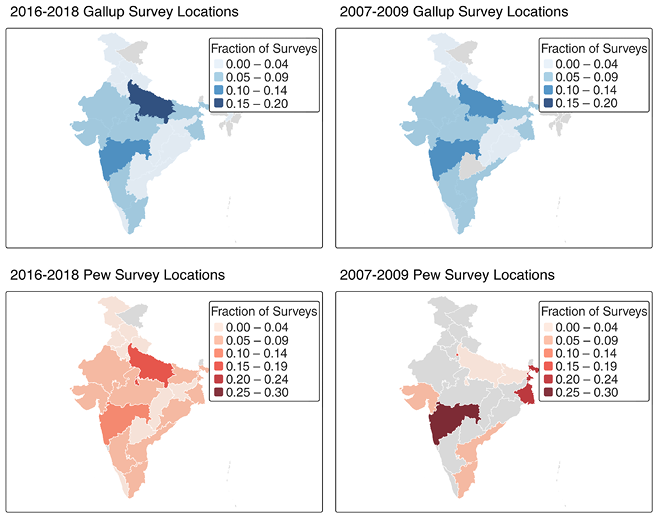
Pew and Gallup both use modern survey methods to recruit samples that more closely approximate national representation.Footnote 7 Figure 3 shows the geographic reach of the Pew and Gallup surveys in the 2007–2009 and 2016–2018 windows. The later surveys (in the left panels of Figure 3) roughly resemble a population density map of India, with the greatest numbers of respondents coming from the four most populous states of Uttar Pradesh, Maharashtra, Bihar, and West Bengal. The same is roughly true of Gallup surveys in the 2000s. Pew surveys in the 2000s are more like an “expanded” version of the IIPO sample distribution shown in Figure 2, concentrating the survey in two states in each major region of India. We note briefly in later sections that this difference in geographic sample might explain why the Pew and Gallup measures of foreign policy attitudes do not move together in the 2000s, but do cohere in the 2010s.
Geographic distribution of survey responses to the 2007–2009 and 2016–2018 Pew Global Attitudes and Gallup World Poll surveys. Maps are shaded by the proportion of total respondents in each survey that hail from a given state. The “missing” states in the 2007–2009 Gallup surveys, for reference, are in India’s less-populous Northeast, plus Telangana in the south (which did not exist until 2014) and the union territory of Ladakh in the far north, which was not created until 2019.
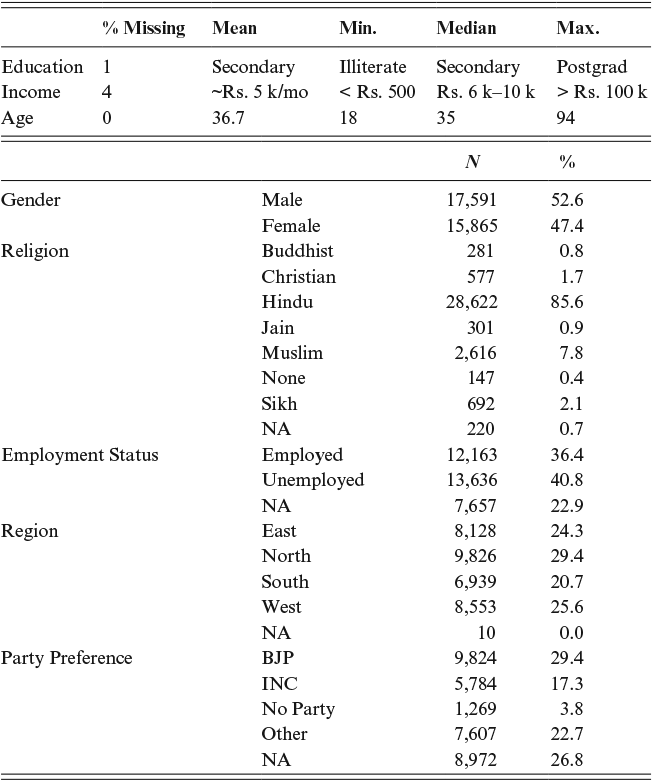
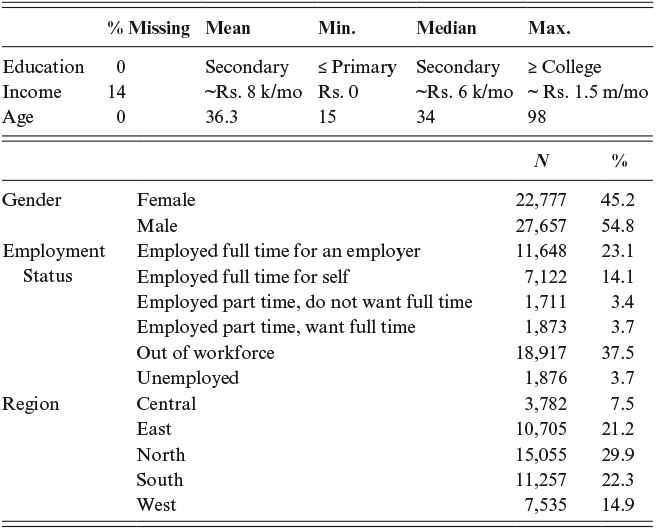
The modern scientific surveys from Pew and Gallup are a much better demographic representation of India than the twentieth-century IIPO surveys. Tables 2 and 3 show summary statistics for the Pew and Gallup polls, respectively, each pooled over all waves we analyze in the subsequent sections. The Pew surveys, compared to the 2011 Census of India, modestly overrepresents Hindus and underrepresents Muslims and is more or less nationally representative in terms of gender. Respondents skew slightly older and more educated than the median Indian citizen, and labor force participation (unemployed includes students, retired, etc.) is lower than the national rate. The Gallup surveys are similar in most respects, though, crucially, they do not contain information about respondents’ religion or political preferences.

Table 2 Long description
“The table summarizes the demographic characteristics of survey respondents across five categories: gender, religion, employment status, region, and party preference. For each subcategory, the count (N) and percentage of the total sample are given. The total sample size is approximately 33,456, as inferred from the gender breakdown.
By gender: Male (N = 17,591; 52.6%), Female (N = 15,865; 47.4%).
By religion: Buddhist (N = 281; 0.8%), Christian (N = 577; 1.7%), Hindu (N = 28,622; 85.6%), Jain (N = 301; 0.9%), Muslim (N = 2,616; 7.8%), None (N = 147; 0.4%), Sikh (N = 692; 2.1%), Not Available (N = 220; 0.7%).
By employment status: Employed (N = 12,163; 36.4%), Unemployed (N = 13,636; 40.8%), Not Available (N = 7,657; 22.9%).
By region: East (N = 8,128; 24.3%), North (N = 9,826; 29.4%), South (N = 6,939; 20.7%), West (N = 8,553; 25.6%), Not Available (N = 10; 0.0%).
By party preference: BJP (N = 9,824; 29.4%), INC (N = 5,784; 17.3%), No Party (N = 1,269; 3.8%), Other (N = 7,607; 22.7%), Not Available (N = 8,972; 26.8%).
A supplementary statistics table for Table 2 gives summary statistics for three variables. Education has no missing values; the mean and median are both Secondary, the minimum is Primary or less, and the maximum is College or more. Income has 14% missing values; the mean is approximately Rs. 8,000/month, the minimum is Rs. 0, the median is approximately Rs. 6,000/month, and the maximum is approximately Rs. 1,500,000/month. Age has no missing values; the mean is 36.3 years, the minimum is 15, the median is 34, and the maximum is 98.”

Table 3 Long description
“The table summarizes the demographic characteristics of survey respondents across three categories: gender, employment status, and region. For each subcategory, the count (N) and percentage of the total sample are given. The total sample size is approximately 50,434, as inferred from the gender breakdown.
By gender: Female (N = 22,777; 45.2%), Male (N = 27,657; 54.8%).
By employment status: Employed full time for an employer (N = 11,648; 23.1%), Employed full time for self (N = 7,122; 14.1%), Employed part time and not seeking full time (N = 1,711; 3.4%), Employed part time and seeking full time (N = 1,873; 3.7%), Out of workforce (N = 18,917; 37.5%), Unemployed (N = 1,876; 3.7%).
By region: Central (N = 3,782; 7.5%), East (N = 10,705; 21.2%), North (N = 15,055; 29.9%), South (N = 11,257; 22.3%), West (N = 7,535; 14.9%).”
Indian Public Opinion Over Time
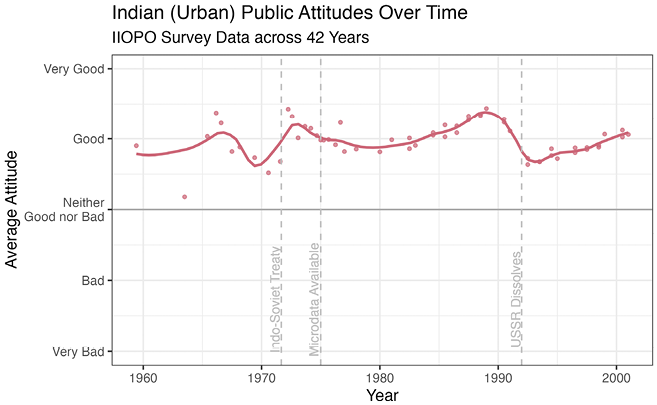
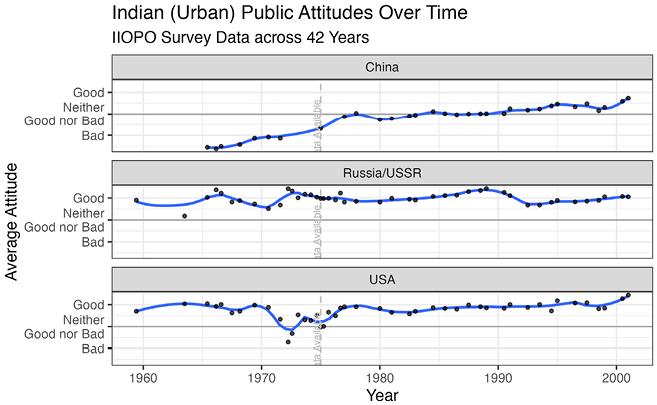
A first look at the trends in public opinion toward China, the United States, and Russia reveals broad findings that form the basis for our analysis in Sections 3–5. Examining average attitudes toward the United States, China, and the Soviet Union/Russia across IIPO data from 1959 to 2001, a few clear trends emerge in Figure 4. The Indian public felt negatively toward China for most of the late twentieth century – definitively so after the disastrous 1962 border war – and average attitudes only climb meaningfully above neutral in the late 1990s. Indian attitudes toward the USSR are consistently positive, dipping modestly and temporarily only after the collapse of the Soviet Union and after the 1965 war against Pakistan. Though the United States and the Soviet Union were of course major rivals during the Cold War, the Indian public maintained consistently positive feelings toward both major powers for decades. The dramatic drop in Indian public opinion toward the United States in the early 1970s is easily attributable. American actions around the 1971 India–Pakistan war over Bangladeshi independence, especially Nixon’s deployment of the USS Enterprise carrier strike group into the Bay of Bengal, were interpreted as a major affront in India. Clearly, the hurt was not permanent, as attitudes toward the United States in the 1980s and 1990s were very positive. As we will show further, however, this did not preclude major disagreements over specific foreign policy issues.
Average attitudes toward China, the USSR, and the United States in Indian Institute of Public Opinion surveys across forty-two years. Each point in the figure represents the “average” response for a single survey wave, across options ranging from “very bad” (1) to “very good” (5). The dashed vertical line indicates the first date for which respondent-level data (vs. topline averages) are available.
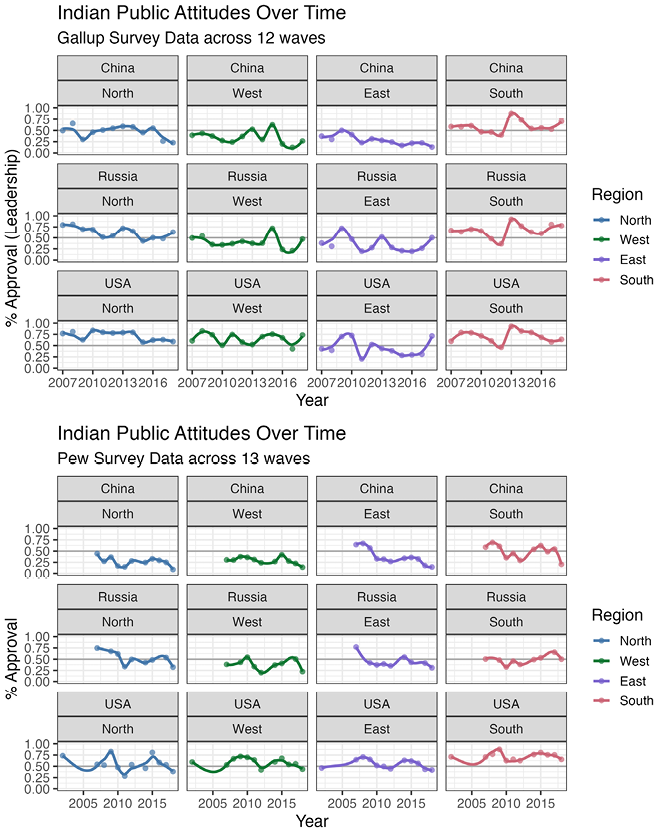
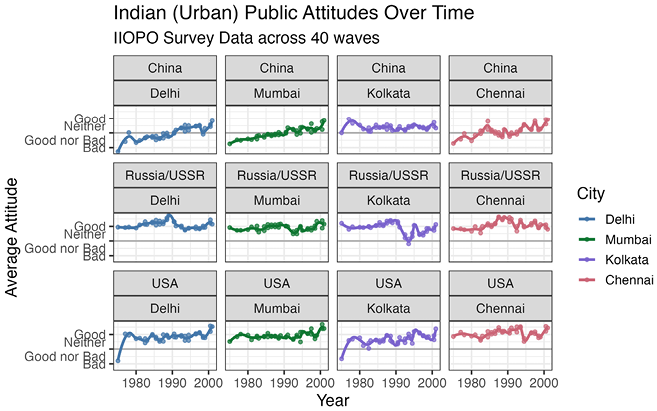
Overall trends in attitudes toward major powers mask substantial variation within India. Figure 5 shows the same polling data as Figure 4 (starting in 1975 when respondent-level punch card data are available) but breaks down average attitudes across the four cities polled by IIPO – Delhi in the North, Mumbai in the West, Kolkata in the East, and Chennai in the South. As we will discuss more in subsequent sections, the difference between the regions goes far beyond longitude and latitude. The economies, dominant political parties and issues, local languages, and even level of identification with the Indian republic vary across India in the twentieth century and today. As we detail more in the next sections, regional differences that appear in Figure 5 are not simply attributable to compositional differences in the populations of different parts of India and may hint toward the role that foreign policy issues will play in domestic electoral competition in the coming years.
Indian attitudes toward the United States, China, and Soviet Union/Russia from IIPO surveys, disaggregated by region.
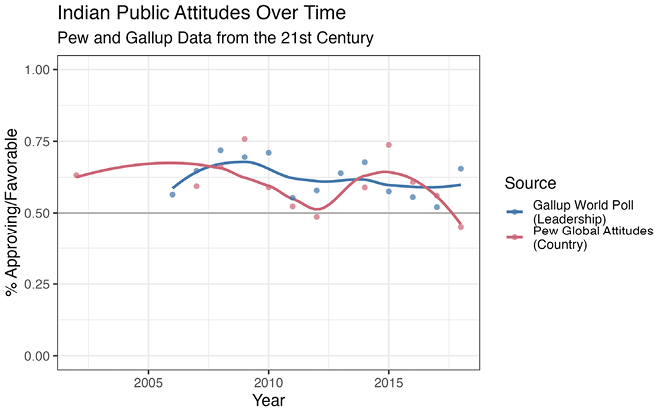
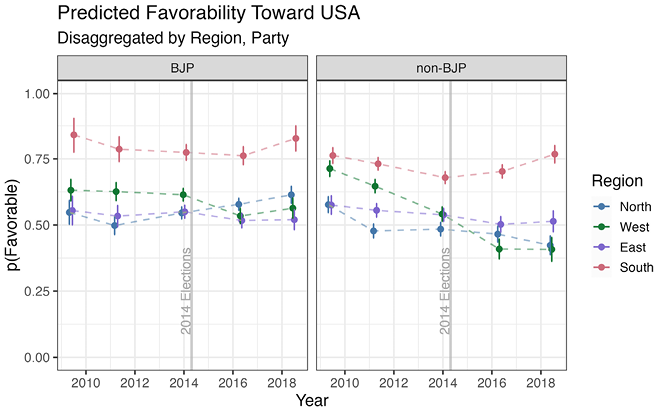
Differences across region and time persist into the twenty-first century. Figure 6 shows trends over time from the Gallup World Poll and Pew Global Attitudes surveys. While the average opinions in the two surveys are not always the same – perhaps owing to differences in question wording and sampling frames discussed earlier – similar trends appear in each data source. Skepticism about China, which was abating in the 1990s, reappears in force in the 2000s and 2010s. Though there are still pronounced regional differences that we explore in Section 3, average attitudes toward China and its leadership are distinctly sour by the 2010s. Russia seems to fare slightly less well in the twenty-first century than the twentieth century, but on average Indians are still broadly favorable toward the country that remains an important strategic partner and supplier of military hardware (Tamkin, Reference 82Tamkin2020). Approval of the United States, likewise, is not as uniformly high as it was in the later IIPO polls, but is still strongly positive, with notable spikes after major diplomatic accomplishments like the US–India civil nuclear agreement signed in 2005.
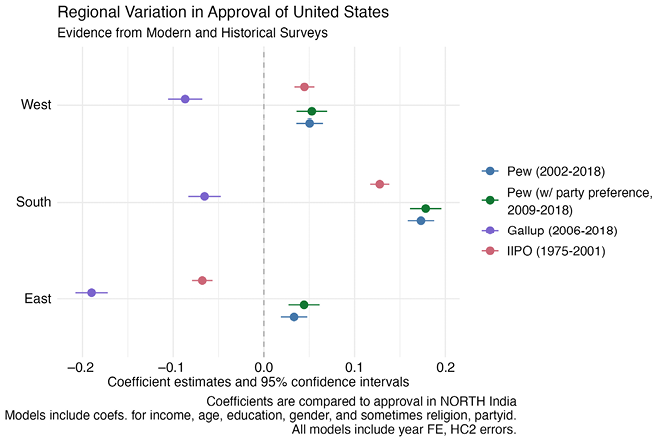
Regional breakdown of attitudes toward the United States, China, and Russia in the twenty-first century, from Pew and Gallup polling data.

Surprisingly, regional differences in attitudes that appear in the Cold War persist into the twenty-first century.Footnote 8 We explore these (and other) dynamics more in subsequent sections, but simple by-region summaries suggest that approval of each of the three major powers we study varies across regions, with especially persistent differences between the North (the Hindi belt) and other regions of the country.
Who Responds? Understanding India’s Foreign Policy Public
Public opinion data from tens of thousands of respondents in surveys spanning seven decades helps us uncover new insights about change, continuity, and structure in the Indian public’s attitudes about world affairs. As we will argue in the rest of the Element, the opinions that Indian citizens express about major foreign powers like China (Section 3), the United States (Section 4), and Russia (Section 5) are, in aggregate, coherent, broadly responsive to major stimuli, and may impose constraints on the way that democratic governments in India conduct foreign policy. As a crucial preface and caveat to those arguments, though, it is important to take stock of whose opinions contribute to aggregate Indian public opinion about world affairs.
Research in American politics suggests that aggregate public opinion about putatively “difficult” issue areas, like foreign affairs (Carmines and Stimson, Reference Carmines and Stimson1980), reflects the attitudes of a subset of individuals who are not representative of the broader democratic public in terms of demographic characteristics (Gilens, Reference Gilens2005), or the content of their attitudes (Berinsky, Reference Berinsky2004). Evidence from India, too, suggests that there is a distinct “foreign policy public” whose characteristics are not representative of the electorate or the country at large. We analyze responses from the twenty-first century Gallup World Poll (these being the modern surveys with the greatest number of foreign policy and world affairs questions) to develop a model of India’s “foreign policy public”; that is, the individuals who express an opinion about world affairs when asked. In India, as in the United States, aggregate public opinion on foreign policy is driven by a comparatively advantaged segment of society that is systematically more male, more educated, and more urban than the national average.
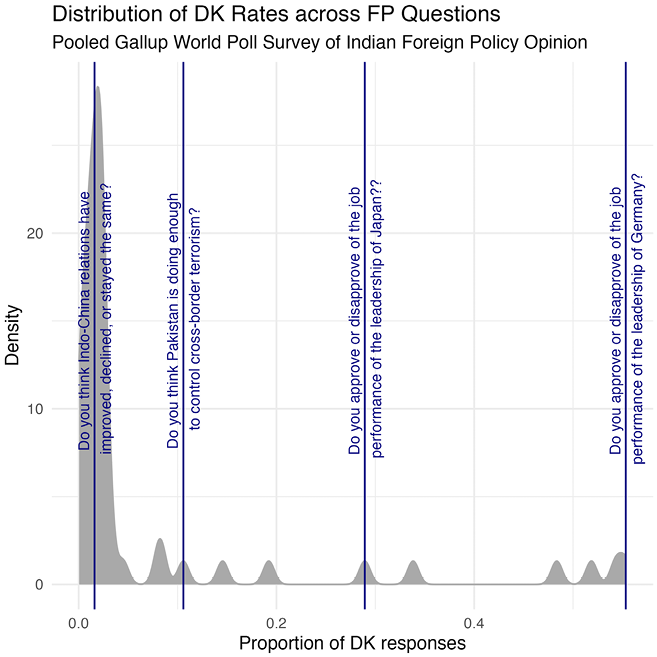
We measure survey respondents’ opinion expression by counting the number of foreign policy questions that they decline to answer over the course of the Gallup survey.Footnote 9 The rate at which respondents answer different foreign policy questions varies widely. Figure 7 shows that while many foreign policy questions are answered by most or all respondents, some questions are skipped more than half the time.
Response rates across different foreign policy questions in the Gallup World Poll (2006–2018). The grey mass represents a density plot of questions, with the horizontal axis indicating the rate at which a particular question is refused or skipped. Vertical lines indicate example questions at different proportions of refusal.

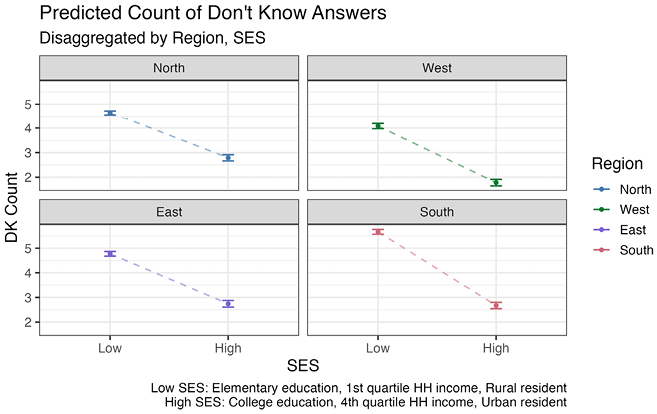
Using a count of skipped questions as an indicator of opinion expression, we build a linear model to characterize India’s “foreign policy public,” or the individuals whose attitudes and opinions we primarily examine in the rest of the Element. Data from 43,000 respondents to the Gallup World Poll suggests that the rate of “Don’t Know” responses or question refusals is lower, all else equal, among respondents who are urban residents, male, highly educated, and somewhat younger. The difference in response rates across respondents with different socioeconomic status is stark. Figure 8 shows the predicted count of “Don’t Know” responses for low and high socioeconomic status respondents in each of the four major geographic regions of India – we disaggregate by region because regional differences are an important part of the structure of foreign policy opinions discussed in Section 3–5. Results suggest that “high” status respondents (we define this as individuals who are college-educated, urban residents with top quartile annual incomes relative to all survey respondents) refuse an average of 1.78 to 2.78 questions out of a possible twenty-seven “Don’t Knows” depending on region. “Low” status respondents, in comparison, refuse an average of 4.08 to 5.66 questions depending on region (we define low status as individuals who have an elementary education or less and are rural residents with bottom quartile annual incomes).
Predicted count of don’t know responses from a model of question refusal in the 2006–2018 Gallup World Polls. Predicted counts are estimated based on an ordinary least squares regression model that includes education, gender, income, urbanicity, age, employment status, and region as predictors. The model includes fixed effects for survey wave, and Huber-White standard errors. Full model results are available in the online appendices.

These results match findings from the US-focused research on opinion formation and expression previously cited. In the rest of the Element, readers should interpret “public opinion” with this subset of the Indian public in mind, because their opinions are much more likely to be reflected in the aggregate opinion of the foreign policy public. For some important questions like approval of China’s leadership, a minority of respondents express attitudes; for many years in the late 2000s and early 2010s, over half of respondents in the Gallup World Poll decline to share an opinion about the leadership of China.
At first glance, it makes sense to see this level of nonresponse as evidence for the importance of elites (or elite cueing) in shaping public opinion on foreign policy topics. As we will show in subsequent sections, though, there are multiple instances in polling data where the tenor of public opinion is, in fact, counter to the preferences of the ruling government at the time. In Section 3, for instance, we show evidence that persistently negative opinions about China were in tension with recurrent efforts by Narendra Modi’s BJP government to move past a major border crisis in 2017 and reestablish a conciliatory posture toward China. Perhaps it is more likely that the segments of the public who might depend most on cueing from elites to express their opinions and engage in politics are simply not engaging at all. These correlates of opinion expression raise important questions about the nature of democratic accountability in India’s foreign policy (Narang and Staniland, Reference 80Narang and Staniland2018), which we discuss further in Section 6.
Conclusion
In the next three sections, we use data from IIPO, Pew, and Gallup to understand the ebb and flow of Indian public opinion toward three major states in the international system: China, the United States, and the Soviet Union/Russia. We supplement these core sources as necessary with more recent surveys not included in our main analyses. Across foreign policies motivated by nonalignment in the Cold War (Ganguly, Reference Ganguly2017) and a new “multialignment” approach in the twenty-first century (Hall, Reference Hall2019; Tellis, Reference Tellis2021), India has never had the luxury of ignoring any of these three states. Using an unprecedented collection of data from underappreciated historical opinion surveys and contemporary scientific polling, we show that public opinion toward foreign policy has been restricted (as in other countries) to a particular subset of the public, but within that public has broadly followed major geopolitical trends and relationships. As we conclude in Section 6, public opinion may even comprise a soft constraint on the ability of India’s leaders to pursue foreign policies of their choice, influencing how much political space elites have to shift policies toward the major powers.
3 India and China: Decades of Distrust
India’s relationship with China came into grim focus in the spring of 2020 as a long-simmering border dispute turned deadly for the first time in decades. Armed clashes in the Himalayas have occurred regularly throughout India and China’s long and complex history, but high casualty counts and long duration in the 2020–2024 Ladakh crisis pushed the countries’ rocky history – from friendship in the 1950s to war in the 1960s, growing economic ties in the Cold War, followed by growing tensions in the twenty-fist century – back into the headlines. Tension between China and India is nominally about territorial disputes in relatively forbidding and inhospitable territory, but any military conflict between two nuclear-armed states raises the possibility of dangerous escalation with broad implications for global security (Blackwill and Tellis, Reference Blackwill and Tellis2019; Madan, Reference Madan2020).
In the 2020s, China is both India’s largest trading partner and its primary security threat (International Crisis Group, 2023). Despite the enduring importance of China in India’s foreign policy, we still have a relatively limited view of how the Indian public thinks about the consequential relationship between the two countries. In this section, we use data from IIPO, Pew, and Gallup polls, supplemented by top-line results from several other surveys, to better understand how the Indian public views their country’s major geopolitical rival. First, we examine the patterns that characterize aggregate public opinion over time: What events do or do not cause average attitudes toward China to change? Then we ask what shapes individual attitudes and account for differences of opinion within the Indian foreign policy public at a given time.
We find several important patterns in public opinion toward China that have consequences for scholarly understanding of foreign policy attitudes in India, but also for analysts trying to understand elites’ constraints and opportunities in crafting India’s China policy. First, as with the United States (Section 4) and Russia (Section 5), we find evidence that Indian attitudes toward China are, in aggregate, reasonably coherent and responsive to politics going all the way back to the 1950s. Perceptions of China track the general state of the India–China relationship over time, sometimes even showing divergence from the attitudes and policy postures championed by powerful political figures like India’s first Prime Minister Jawaharlal Nehru and its present multi-term Prime Minister Narendra Modi.
Second, however, we also show that public opinion is not infinitely sensitive to strategic developments, even among the subset of the Indian public who voice foreign policy opinions. Comparing surveys before and after historical clashes at the China–India border – episodes that share many features with the more-intense Galwan clashes in 2020 – we show that few if any spurred changes in aggregate opinion, even though experts at the time were worried at the time about the potential of those crises to escalate. The foreign policy public updates its views, but not immediately.
Third, our analysis identifies a consistent set of factors that correlate with individual-level foreign policy opinions across time. We find that the most enduring and consequential cleavage in Indian attitudes about China has been regional. While there is no guarantee this will hold in the years to come, it is important evidence that the domestic cleavages shaping public opinion can look quite different than what scholars focused on the US or UK might expect.Footnote 10
How India’s Public Views China
Scholars of India still debate whether issue opinions about domestic politics are “coherent” in the sense that individuals hold consistent issue opinions over time and relate those opinions to support for politicians/parties with compatible ideologies (Chhibber and Verma, Reference Chhibber and Verma2018; pace Chandra, Reference Chandra2004). While we cannot look for ideological coherence to the classic standard that Converse (Reference Converse and Apter1964) defines, we can show suggestive evidence that attitudes toward China are broadly responsive to macro-political changes in India–China relations.Footnote 11
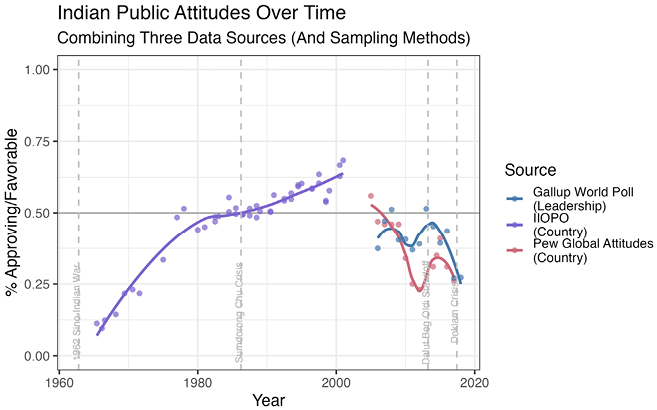
Change over time suggests that the Indian public’s attitudes toward China fit the mold of what Jentleson (Reference Jentleson1992) calls “pretty prudent.” On average, Indian respondents express more positive attitudes toward China when bilateral relations are more benign or cooperative, and more negative attitudes when the relationship is more contentious. This intuitive finding is important because it shows that the public – at least those responding to surveys – responds to political developments. Figure 9 shows the arc of attitudes from IIPO polls in the twentieth century to Pew and Gallup surveys in the 2000s and 2010s.
Average Indian attitudes toward China from the 1960s to 2018. Data come from surveys by IIPO (in yellow), Pew (red), and Gallup (blue). In order to facilitate comparison across different question wordings (reproduced in the figure notes), individual points and best-fit curves represent the proportion of complete responses in a given survey that express approval/favorability instead of disapproval/unfavorability. Vertical dashed lines mark the timing of major border clashes.

The International Images series from IIPO did not regularly ask about China prior to the 1962 war. A series of one-off poll questions, however, shows Indian attitudes souring quickly in the early 1960s. In 1957, an overwhelming majority of respondents supported admitting the People’s Republic of China to the United Nations and, among the half of respondents who were willing or able to voice an opinion – 52% responded “Don’t Know” – over 80% expressed favorable attitudes about Chinese premier Zhou Enlai (Indian Institute of Public Opinion, 1957, p. 38). By 1962, with the escalating India–China border crisis at the center of national attention (Raghavan, Reference Raghavan2010), opinions toward China were in a tailspin. In an all-urban area poll, 78.7% of respondents in an all-urban area poll answered that the border dispute had changed their opinions of China for the worse – about two thirds of this group said they had a “good” opinion of China before the crisis – and nonresponse rates were uncommonly low at 12.8% (Indian Institute of Public Opinion, 1963, pp. 46–7).Footnote 12
After the month-long war in October-November 1962, opinions of China changed dramatically. A January 1963 survey report notes a “truly dramatic story … the image of China has suffered a sharp deterioration” (Indian Institute of Public Opinion, 1963, p. 12). China’s image among Indian survey respondents recovered very little in the next years. In 1965, the year that IIPO began to regularly include the same question wording about China, “Don’t know” rates were an unusually low 9%, and the reported attitudes were nearly unanimous. Virtually no Indian respondents reported a “very good” opinion of China, and only 1% reported a “good” opinion. Most respondents reported either a “bad” opinion (28%) or a “very bad” opinion (57%).Footnote 13
As India–China tensions decreased starting in the late 1960s, opinions of China improved. In 1978, “good” and “very good” opinions even outnumbered “bad” and “very bad” opinions for the first time since before the war. Average opinions of China remained above neutral in most surveys through the rest of the twentieth century, though they never soared as high as views of the United States or the Soviet Union/Russia. Improving views of China across the later Cold War correlate with the emergence of a majority (77%) supporting normalization of China–India relations by 1978, though 50% of those in support wanted to see normalization conditional on resolving the border dispute.
India’s metropolitan, educated public was broadly aware of the ebb and flow of India–China ties through the Cold War. Attitudes toward China were starkly negative in periods of intense conflict and slowly warmed as the bilateral relationship improved and stabilized. Attitudes toward China also correlate, broadly speaking, with attitudes about China-relevant policies in the 1960s and 1970s. Indians’ support for the development of nuclear weapons – a policy relevant to China, not Pakistan, prior to the 1980s–1990s – is fairly high in a 1970 survey with 75 percent of respondents in Delhi reporting that India should pursue nuclear weapons even at the cost of a “drastic cut in development expenditure.” Prefiguring regional trends we discuss later, however, respondents in other parts of the country were far less favorable toward the proposed guns-for-butter trade (India Institute of Public Opinion, 1971).
In the twenty-first century, polls with more nationally representative samples showed opinions of China worsening again. Across nearly annual Gallup and Pew surveys between 2006 and 2018, only three individual surveys show average approval/favorability slightly above neutral, with average opinions clearly declining across the 2000s and 2010s. Souring overall attitudes correlate with a number of specific geopolitical concerns. Over half of respondents in the Pew surveys in 2012 and 2017, for instance, identify China’s growing economic power as a bad thing for India; respondents in the 2017 survey reported concern about China’s growing military power in similar proportions (Wike et al., Reference Wike, Horowitz, Simmons, Poushter, Barker, Stokes, Bell and Mueller Gross2012; Stokes, Manevich, and Chwe, Reference Stokes, Manevich and Chwe2017). A one-off poll by Australia’s Lowy Institute in 2013 likewise found that 73% of Indian respondents call the possibility of war with China a “big threat,” on par with the threat of Kashmir separatism (72%), Naxalites (71%), and not much lower than the threat of Pakistan (77%).
The Indian public in the twenty-fist century remains deeply skeptical of China. Brief improvements (visible in Figure 9) aside, Indian attitudes in the late 2010s had returned to levels from the early 1970s – ten years after China defeated India in war.Footnote 14 The decline in public approval of China runs explicitly counter to the intentions of national political leaders. Between 2014 and 2020, the Modi government worked hard to maintain a positive, cordial relationship with China, holding high-profile summits with Chinese leader Xi Jinping even in the aftermath of border disputes in 2013 and 2017. Efforts at rapprochement after the 2020 Galwan crisis have likewise failed to improve public opinion:Footnote 15 a Pew survey in the spring of 2025 continued to show only 21% approval of China among Indian respondents (compared to 54% for the US) (Silver et al., Reference Silver, Clancy, Schulman, Miner and Huang2025).
It is unlikely that elite cues are driving negative attitudes. In 2018, Indian voters were split in their approval of Modi’s handling of the China issue even though opposition political parties were (surprisingly) muted in their criticism (Lokniti, 2018). Indeed, after the border dispute escalated in 2020, elites’ more confrontational stance toward China actually converged with the preexisting mood of the public, which, according to recent one-off surveys, has continued to be negative (Clary et al., Reference Clary, Lalwani, Siddiqui and Sircar2022; Pew, Reference Silver, Clancy, Schulman, Miner and Huang2025).
India’s government and political elites, to be sure, still have latitude to shape the public narrative around the India–China relationship. As we discuss further, there are limits to how attentive even the “pretty prudent” public has been over time. Though many Indian voters have opinions about international affairs, no international issue other than terrorism and emigration appears in the list of the top ten issues that 2018 Pew respondents say are a “very big problem” in India (Devlin, Reference Devlin2019). All the same, Indians’ skepticism of China seems well consolidated, potentially forcing leaders to consider whether or not they are willing to pay a domestic political price to adopt a more conciliatory posture toward China. This will be an enduring challenge for Indian policymakers, who may have reasons to try to calm tensions with China in a world in which they doubt an American commitment to containing the PRC.
Border Disputes Fall Below the Radar
The India–China relationship since the 1962 war has been punctuated by irregular armed clashes along disputed border segments in the Himalayas. The brawl at Galwan in 2020, which killed twenty Indian soldiers and a still-disputed number of Chinese soldiers (S. Singh, Kaushik, and Singh Chhina, Reference Singh, Kaushik and Chhina2020), was unusually deadly, but fit a pattern of tense and dangerous clashes between Indian and Chinese patrols. Though the clashes themselves are relatively limited, experts, political leaders, and commentators believe they have dangerous potential for escalation into broader violence between two nuclear-armed foes. Repeated, public, acute, but ultimately small changes in the state of the political relationship between India and China provide an opportunity (unavailable with the India–Russia or India–US relationship) to investigate the lower bounds of public attention to foreign policy issues.
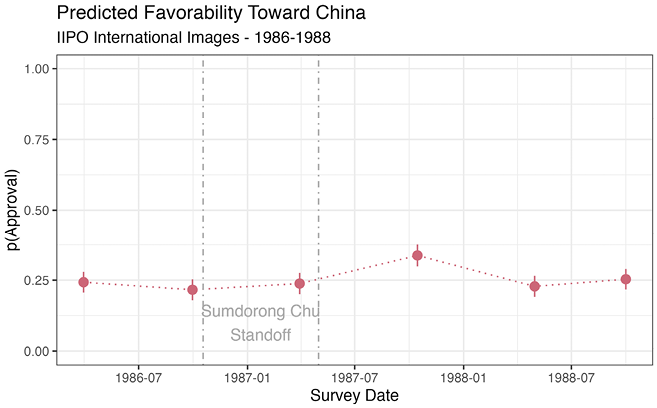
Evidence suggests that public attitudes shift relatively little around border clashes in 1986–1987, 2013, and 2017, as dangerous as they may have been. In the first border crisis at Sumdorong Chu, a standoff between the PLA and the Indian army lasted through the winter of 1986 before a diplomatic resolution the following spring. Though no casualties were recorded during the standoff, strategic leaders, political elites, and journalists at times considered the situation to be dangerous and delicate (Pardesi, Reference Pardesi2019). Public opinion reflects virtually none of this concern. Figure 10 shows the predicted probabilities of expressing a positive attitude toward China (i.e., responding “good” or “very good” rather than responding negatively or declining to respond) in the IIPO surveys. Results are not consistent with the idea that the Sumdorong Chu standoff caused the average respondent to negatively update their opinion of China. If the crisis had any effect at all on attitudes, it was a small but significant increase in positive opinions around the diplomatic resolution of the crisis in summer 1987 after the Indian foreign minister visiting Beijing in May and a significant military-to-military engagement in August.
Predicted probability of reporting a “good” or “very good” opinion of China in IIPO surveys from 1986 to 1988. Predicted probabilities for each survey wave are estimated holding a number of demographic covariates (religion, region, age, education, income, and gender) constant. The start and end points of the Sumdorong Chu crisis are marked by dashed vertical lines.
Even though the Sumdorong Chu crisis was severe in the eyes of politicians and diplomats, it probably escaped the attention of even highly attentive individuals because it simply did not stand out as a political issue in media coverage at the time. The Times of India, India’s English-language paper of record, mentioned the crisis in twenty-nine articles across 1986–1987 (730 editions). The phrase “Sumdorong Chu” appears on the front page only five times in two years.Footnote 16 By contrast, the then-escalating insurgency in Punjab was mentioned in at least 460 Times of India articles, and the Brasstacks crisis of 1986–1987 dominated news attention perhaps more broadly than either. Though the border crisis might have been overshadowed by these large security issues in any circumstance, another mechanism that might account for the light media coverage of the border crisis, and subsequent lack of public awareness, is the government’s effort to control the flow of public information about Sumdorong Chu. Whether the government has been less aggressive or simply less successful in the internet age, information about recent border crises has been more available.
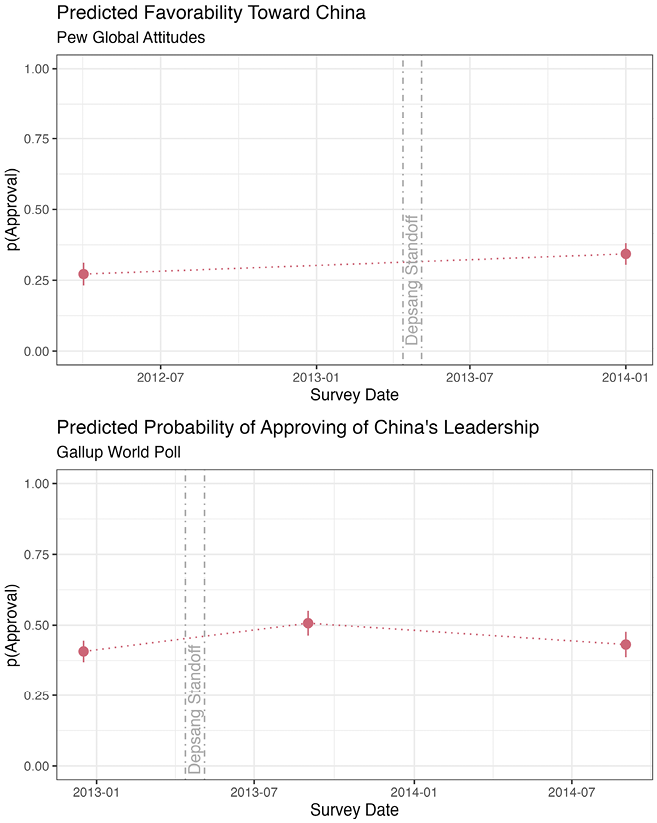
Comparing two additional border crises in the 2010s reinforces the notion that public attention likely hinges on the extent and nature of media coverage. Against a backdrop of overall declining positive opinions toward China through the 2010s, a small 2013 crisis at the Depsang Plain and a larger 2017 crisis at Doklam do relatively little to perturb attitudes. Figure 11 shows predicted probabilities of reporting a positive opinion of China before and after the 2013 Depsang standoff, which was not a major national story.Footnote 17 Though neither poll series has data from immediately before or after the standoff, we can conclude that the standoff does not precipitate a major change in overall public opinion in the medium term.
Predicted probability of reporting “approval” of China or China’s leadership in Pew and Gallup surveys between 2012 and 2014. Predicted probabilities for each survey wave are estimated holding a number of demographic covariates (region, age, education, income, and gender) constant. The start and end points of the Depsang crisis are marked by dashed vertical lines.

The 2017 Doklam crisis was larger than either the Depsang or Sumdorong Chu standoffs in terms of the size of India and China’s mobilizations and lasted longer before a stand-down was negotiated. It also took place on territory that had never (and still has never) been claimed by India. In June 2017, PLA troops began extending road construction into a territory disputed between China and Bhutan. India dispatched troops to stop the road construction, which was drawing very near to Indian territory (not disputed by China or Bhutan). Heightened tensions between Indian and Chinese troops at Doklam also led to a brawl in the Western sector of the border (near the later site of the 2020 Galwan fatalities) with injuries on both sides.
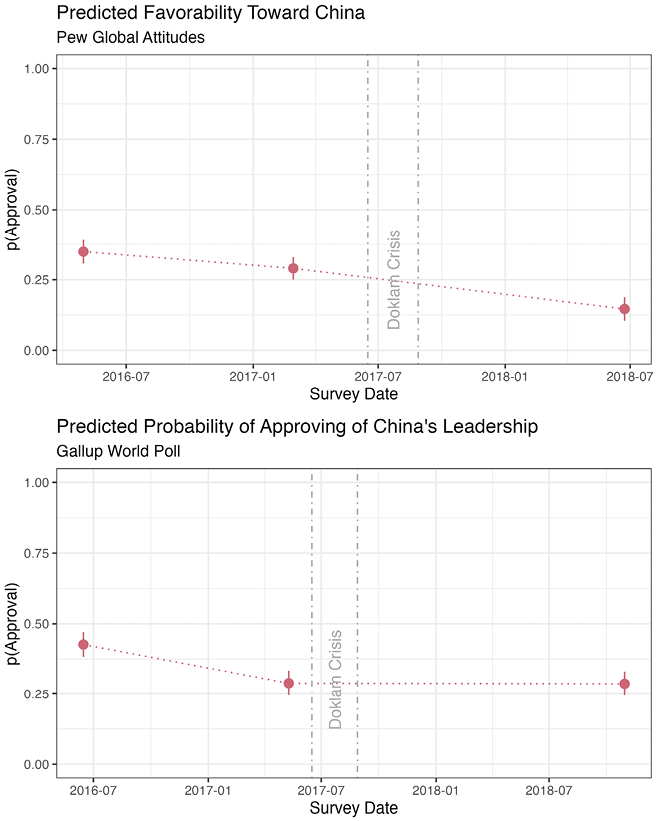
Survey data from Pew and Gallup polls before and after the Doklam crisis (Figure 12) do not strongly support the idea that the Doklam crisis caused a discontinuous shift in opinions toward China. Evidence from the Pew Global Attitudes surveys shows a pre versus post Doklam shift in 2017–2018 essentially on par with the decline between 2016 and 2017, suggesting that attitudes were souring with or without the Doklam crisis. Gallup’s survey question on approval of China’s leadership shows no significant change before versus after the crisis.
Predicted probability of reporting “approval” of China or China’s leadership in Pew and Gallup surveys between 2016 and 2018. Predicted probabilities for each survey wave are estimated holding a number of demographic covariates (region, age, education, income, and gender) constant. The start and end points of the Doklam crisis are marked by dashed vertical lines.

The Doklam crisis is, in many ways, the “best case” for observing an effect on public opinion because it was a qualitatively larger media event than either of the previous crises. Not only were Indian troops injured in the standoff, but the potential strategic costs of “losing” the confrontation – on Bhutanese soil – were portrayed in the media as being very high. Whereas the 1986–1987 Sumdorong Chu crisis was mentioned about once every four weeks in the Times of India over the course of two years, the Doklam crisis was mentioned 387 times in 2017 alone – more than once per print edition in a paper with an estimated 2017 circulation of 4.3 million copies per day and a substantial online presence (PGRI, 2018). Even in this easy case, there is not substantial evidence that the public is using border dispute events to update their impressions.
Border disputes are one of the public’s most direct opportunities to gather evidence about China and India’s relationship. Compared to the normal fare of official visits, communiques, and policy rollouts, militarized disputes are salient foreign policy events that create easy opportunities for the public to update their opinions. The fact that disputes and crises do not seem to “move the needle” of Indian attitudes toward China demonstrates the limits of public attentiveness and investment in foreign policy issues, even if aggregate opinions seem to be moving in response to broader trends in the relationship over time. The Galwan crisis of 2020–2024 may prove an exception because of its remarkable duration and the fatalities suffered by Indian forces in 2020, but we should not expect less-dramatic events to move the needle much at the level of mass opinion.
Region, Not Partisanship Is Key to the Structure of Individual Attitudes
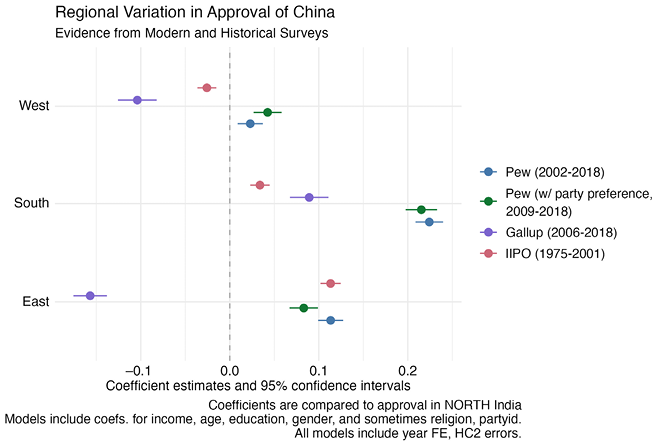
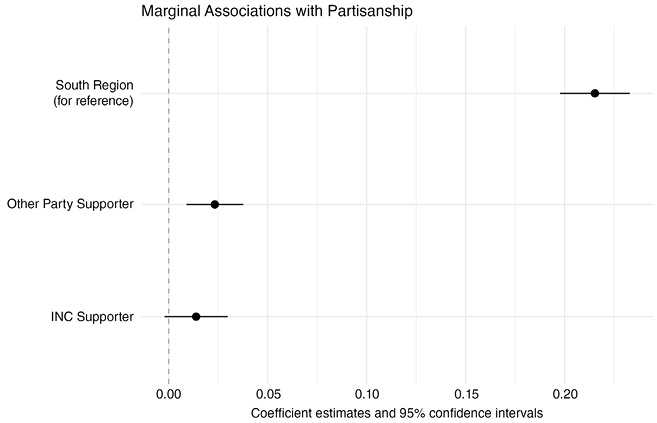
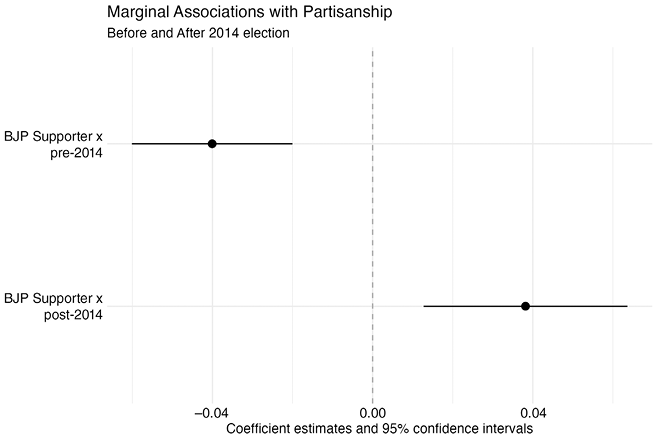
At any given time, there is variation in Indian respondents’ opinions about China, or any other country or issue. We find a few consistent factors that structure individual opinions about China across the multi-decade span of our data coverage. One factor, region, is a consistent and robust attitude predictor across time in India, but has received relatively little attention in existing international relations literature about the structure of foreign policy attitudes. Another factor that is a major focus of the existing literature, partisanship, is largely irrelevant to the structure of attitudes toward China in the 2010s.
Going back to the 1970s, region of residence is a robust and substantively important correlate of individual attitudes toward China. Our analyses show that the differences are not a result of compositional differences in the population of different regions, but instead reflect something about regional politics, culture, or perhaps threat exposure that causes a substantial difference in average opinion. In a representative year from the IIPO data (1980, for instance), there is a 12 percentage point spread in approval between the region where respondents are most negative about China (South, 12%) and the region where respondents are most positive about China (West, 26%).
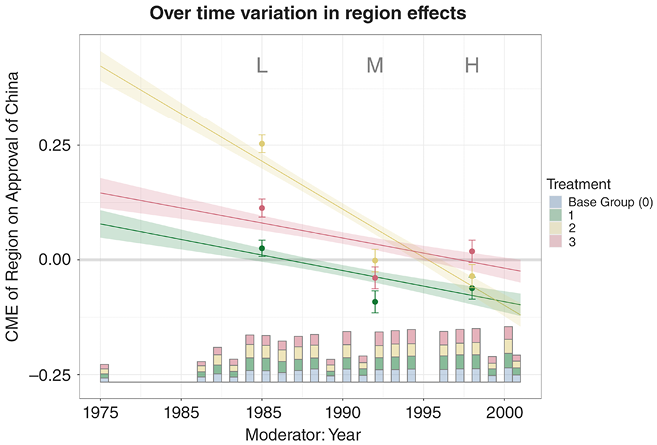
Cross-regional differences also evolve over time: Figure 13 shows approval of China in the South (Chennai), West (Mumbai), and East (Kolkata) compared against the North (Delhi, the capital) as a baseline, allowing regional differences to vary as a linear function of the year of the survey (Hainmueller et al., Reference Hainmueller, Mummolo, Xu and Liu2022). The interaction plot supports the interpretation that regional differences are significant and substantial at most points in the 1970s–1990, but also that the relative attitudes in different regions shift.
A plot of the marginal effect of region on approval of China, in which the effect varies as a function of survey year, estimated using the Interflex procedure (Hainmueller et al., Reference Hainmueller, Mummolo, Xu and Liu2022). Colored lines and standard error shading show the estimated linear relationship between survey year and region effect for each region, using the North as a reference. Colored point estimates and standard error bars show binned estimates for the oldest, middle, and newest surveys.

Regional differences persist in surveys from the 2000s and 2010s, but the regions’ relative positioning on China changes. Figure 14 shows the region coefficients from various models of China attitudes that adjust for demographics (and in some cases political party preference). In every instance, regions are significantly different from one another, and some estimated differences are substantial – ten or more percentage points. The most consistent differences are between India’s North and South.Footnote 18 In the 2000s and 2010s especially, Southern Indians were systematically more favorable toward China than Indians in the North. Other regional differences are also substantial, but do not point in consistent directions across the Pew and Gallup surveys. We think this comes down to differences in sampling (see Section 2).
Region coefficients from regression models predicting respondents’ attitudes about China. All coefficients are compared to China’s approval in the omitted region, North India.

Persistent regional differences in attitudes toward China are potentially important for understanding Indian attitudes toward China and require further study. Human development and economic development outcomes, which are widely cited to explain myriad regional differences in India (Sachs, Bajpai, and Ramiah, Reference 81Sachs, Bajpai and Ramiah2002; Kohli, Reference Kohli2012), are not an obvious culprit in this case, because accounting for some key human development outcomes at the individual level (i.e., income and educational attainment) does not attrit the result.
One explanation that fits the facts is more prosaic. India’s regions are differentially exposed to the downside risks of the India–China rivalry (and differentially poised to reap the economic benefits of a strong, stable bilateral relationship). There is meaningful variation across India in how “present” a security threat from China is. Major population centers in the South like Bengaluru and Chennai are nearly 2,000 km from the border with China – slightly beyond range for many of China’s medium-range ballistic missiles (Missile Defense Project, 2021). Delhi in the North, and Kolkata in the East, conversely are within 400–600 km of the sites of active border disputes.
Another potential explanation is striking regional differences in the importance that Indians place on subnational versus national identity. South Indians have, for decades, been more likely than North Indians to prioritize regional or ethnic identity over identification with the Indian nation (Singh, Reference Singh2015), which might make the rocky India–China relationship loom less large in their evaluations of China. In any case, the persistent association between region and foreign policy attitudes that we identify here certainly warrants further research.
It is also important to note that ideological affinity toward China, that is, support for communism, is more popular in some regions of India than others. More positive attitudes toward China might result from this difference: Communist state governments have been elected in Kerala, and communism is also relatively popular in Karnataka and Tamil Nadu.Footnote 19 More work in the future is needed to determine the precise causes of this consistent pattern, but there are a number of plausible explanations to consider.
If the association between region and attitudes is surprisingly robust in India, the association between partisanship and foreign policy attitudes is surprisingly complicated. Questions about partisanship, unfortunately, only consistently appear in Pew Global Attitudes data from the late 2000s through the 2010s. The associations between partisanship and approval of China are insubstantial (Figure 15). Compared to BJP supporters as the baseline, opinions about China among supporters of the INC (the party in power at the federal level from 2004 to 2014) are not distinguishable despite a pretty precisely estimated effect. Supporters of “other” parties, including smaller national parties and India’s myriad regional parties, are significantly more likely to express approval of China, but the size of the difference is miniscule (two percentage points, p = 0.007) compared to the effects of region discussed earlier.
Associations between partisanship and support for China in a model using survey responses from the Pew Global Attitudes surveys. The baseline category for partisanship is support for the BJP. Models adjust for a range of demographic factors and include year fixed effects and HC2 heteroskedasticity robust standard errors. The region coefficient for the Southern region is included to show relative sizes.

Though INC and BJP supporters are not distinguishable in their support for China overall, looking at separate political periods in the twenty-first century and bringing region back in complicates the story. First, the attitudes of partisans shift depending on whether or not their party is in power. Interacting party ID and governing party, that is, allowing the effect of BJP partisanship to vary depending on whether the respondent is answering before or after the BJP victory in the 2014 election, suggests that supporters of a party in power are very slightly more favorable toward China (Figure 16). Under the INC government from 2010 to 2014, BJP supporters were significantly but modestly (4 percentage points, p = 0.01) less likely than supporters of INC and other parties to “approve” of China. After the BJP victory in the 2014 general elections, the association almost perfectly flipped, with BJP supporters 3.8 percentage points (p = 0.013) more likely to approve of China than supporters of other parties, including the Congress.
Association between partisanship and approval of China, allowing the BJP/attitude association to vary depending on whether a BJP government is (post-2014) or is not (pre-2014) in power at the federal level. Models, fit using Pew data, control for the same range of covariates as described earlier.

The marginal effects of partisanship and region are pushing in opposite directions (Figure 17). BJP supporters, all else equal, are more likely to approve of China after 2014, but the association is mostly driven by small changes among non-BJP supporters in the North and West. Opinions among BJP supporters in the BJP’s core regions (North and West India) are fairly constant across the 2010s, and BJP supporters in the East and South are decreasingly favorable toward China over time – more or less in line with supporters of other parties.
Predicted probability of “approval” of China disaggregated by party and region across the 2010s. Predicted probabilities are calculated from a model that adjusts for demographic composition of groups.
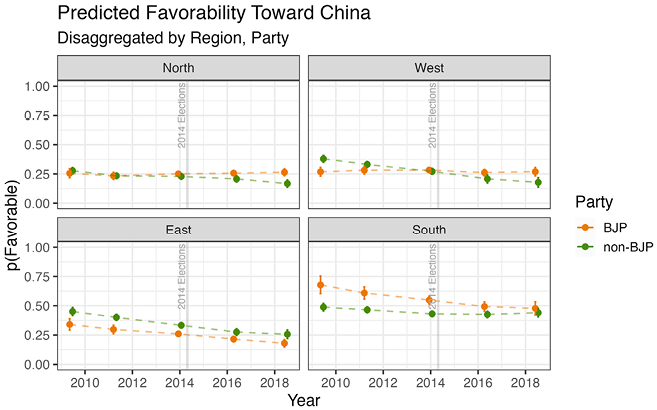
The partisan difference we observe after 2014 looks, from this perspective, mainly like a consequence of declining opinions of China among non-BJP supporters in Northern and Western India. As we emphasized earlier, by 2018 attitudes toward China vary far more across region, among supporters of the same party, than they do across parties. Ultimately the associations between partisanship and important foreign policy attitudes in India seem to be somewhat inconsistent and not enduringly substantial. This certainly could change in the years to come, and shifts in this relationship warrant close attention.
From Attitudes to Policy
How should we make sense of the unusual relationship between partisanship, region, and attitudes toward China? First, we can conclude that partisan identity in India is not a major axis for structuring attitudes about international affairs in the way it increasingly is in the United States (Druckman, Peterson, and Slothuus, Reference Druckman, Peterson and Slothuus2013; Agadjanian, Reference Agadjanian2021) and other politically polarized democracies (Nelson and Steinberg, Reference Nelson and Steinberg2018). Second, understanding the interplay of region and partisanship in the structure of individual attitudes toward China – on top of the observation that the Indian foreign policy public appears broadly prudent from looking at trends over time – gives us some clues about how politicians in India can and will navigate competition and crises in the future.
One striking finding from Pew data in the 2010s is that the timing of declining public favorability toward China, even among BJP supporters, potentially belies the idea that national leaders like Narendra Modi can easily lead or shape public attitudes. Declining public favorability toward China in the 2000s and 2010s predates border crises in 2013 and 2017 and, more notably, also predates a change in the Indian government’s public messaging toward China, which did not become more assertive until the 2020 crisis. Media and political elites are surely important conduits for information that can shape public attitudes, but we should not assume that they are spoon-feeding opinions to the attentive segment of India’s public. Modi is often portrayed as uniquely charismatic (Sircar, Reference Sircar2020) and some analysts contend that he has turned foreign policy issues into electoral benefit for the BJP (Misra, Reference Misra2019) but the evidence we present here does not show that he can easily shift Indian attitudes toward China. This finding adds some nuance to the common portrayal of Modi as effectively transforming foreign policy flashpoints into political advantage.
Another finding that appears across all three major data sources is the enduring importance of region in accounting for individual attitudes toward China. We are only able to speculate about why there is so much regional variation in attitudes about China, but we can say with some confidence that the variation is not simply covering for demographic and human development differences between India’s regions.
In subsequent sections we repeat many of these same analyses to understand Indians’ attitudes toward the United States and the USSR/Russia. We will see that the Indian public’s attitudes, compared to China, are consistently more positive, both during the Cold War, and even in the later years of America’s unipolar moment. China occupies a distinctively negative place in Indian assessments of the world’s major powers.
4 The United States and India: A Tumultuous History
The India–United States relationship has become central to both countries’ foreign policies as they deal with the rise of China, mutual needs for economic growth, and ever-deepening people-to-people connections (though 2025 and 2026 see unexpected turbulence with unclear long-term consequences).
In the early Cold War, however, American policymakers saw India as both an arena for competition with the Soviet Union, and then a partner to be supported against China around the 1962 war. American efforts to maintain good ties with both India and Cold War ally Pakistan foundered badly. Pakistan, along with disagreements over the Vietnam War and economic aid, undermined US–India ties in the 1960s. The nadir of the relationship was American support for Pakistani repression of the Awami League in East Pakistan in 1971. India ended up invading East Pakistan and creating Bangladesh in the face of American diplomatic hostility. The Sino-American rapprochement further amplified distrust in Delhi toward the United States, making the 1970s a period of relatively chilly relations. The Indian left, which was prominent from the late 1960s to mid 1970s, was deeply suspicious of America; in turn, US policymakers found the Indian government difficult to deal with and were often unwilling to face the challenges that the US relationship with Pakistan created.
In the 1980s, Indira and then Rajiv Gandhi began exploring possibilities for a more productive relationship. In the 1990s those tendencies accelerated. Following India’s economic liberalization process in the early 1990s and then the nuclear weapons test of 1998, India and the US began to engage much more comprehensively. Part of this agenda was driven by new opportunities for Indian involvement in the global economy (including American investments in India), and part of it was a response to the specter of a rising China. The US–India civil nuclear deal of 2008 was an important moment in consolidating a closer partnership. Since 2008, the US and India have pursued a number of initiatives, ranging from technology cooperation to maritime security. Yet at the same time, there are important divergences in views of Russia, the specific nature of economic cooperation and openness, immigration, and Iran. This blend of harmony and difference is a defining characteristic of India–US relations in the twenty-first century.
In this section, we explore how the Indian public has seen the United States across nearly seven decades. We find that there is a fairly deep historical reservoir of positive feeling toward the US. While there surely was – and remains – skepticism of, and in some cases active hostility toward, specific US foreign policy priorities and goals, the mass public has consistently harbored fairly positive attitudes toward the United States in general. This contrasts with the framing of India as deeply anti-American during much of the Cold War, which would make the embrace of the US since the 1990s seem like a greater surprise than perhaps it was.
Instead, while the turn toward greater cooperation with the US marked an important change in policy, it did not occur in the face of strong anti-American public attitudes, even if segments of the bureaucracy and political elite were (and remain) skeptical of alignment with the United States. This interesting disjuncture continues into 2025 – there has been extensive discussion of Indian policymakers’ displeasure with American policy toward Bangladesh and the Trump administration’s discourse around trade and the India–Pakistan conflict of 2025, but survey data showed substantial positive opinion toward the US among the Indian public.Footnote 20 It remains to be seen whether Trump’s approach to India in 2025 and beyond will sour Indian attitudes toward the United States, or whether they will be seen as representative of Trump’s idiosyncrasies rather than the US in general.
Second, as with views of China, changes over time in attitudes toward the United States largely track major shifts in geopolitics, suggesting the nonrepresentative foreign policy public is aware of “big picture” international affairs. The key exception to broadly favorable views of the US was the period around the 1971 war, when American opposition to Indian policy was highly public, salient, and profoundly disliked. Public approval plummeted in ways that are consistent with a foreign policy public that was broadly aware of international politics. The public may not be consistently voting on foreign policy, but it is engaged and aware enough to provide both incentives for and checks on Indian political leaders.
Third, as with findings toward China and Russia, we do not see a consistent partisan difference in views of the United States. We discuss some reasons why this might be the case: First, both left and right in India have separate reasons for suspicion toward the US and American foreign policy does not seamlessly align with any Indian domestic political faction. Second, the central battles in Indian politics, both now and in the past, have limited overlap with major power competitions or policies abroad. In Section 6, we draw out some implications of this finding, namely that foreigners should not overestimate their importance in Indian domestic politics. Even the often-polarizing United States has a generally muted role to play in the political competitions that determine who rules India.
Indian Views of the United States Over Time
We begin by establishing views of the United States in the IIPO, Pew, and Gallup data. There are important caveats to keep in mind about the older data and its comparability to the newer surveys, but we are struck by the consistency and coherence of general patterns despite these limitations. Jentleson’s “pretty prudent public” (1992) appears again. Figure 18 summarizes the IIPO survey’s data on views of the United States in general.
Views of the United States in Indian Institute of Public Opinion
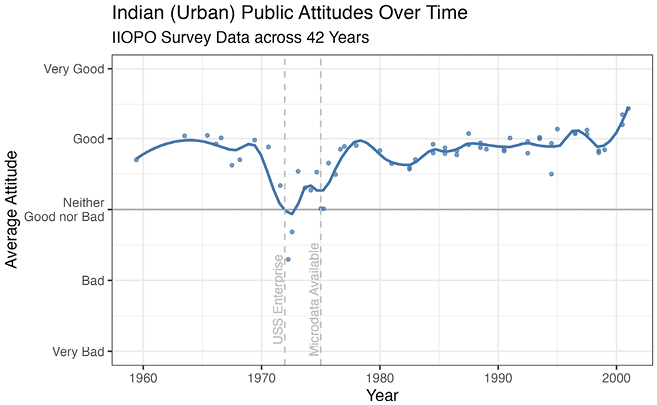
Indian respondents express overall positive sentiment toward the US, but with important variation over time. The dramatic collapse in the 1970s is driven by American backing for Pakistan in the run up to and during the 1971 India–Pakistan war. The US was aligned with Pakistan as a Cold War partner and as a crucial conduit to China during the Nixon administration’s efforts to reach a rapprochement with Beijing (Raghavan, Reference Raghavan2013; Bass, Reference Bass2013). This led Washington to back Pakistani repression of the Awami League in East Pakistan, which had won the 1970 election but was blocked from taking power by the Pakistani military and West Pakistani elites. The crackdown on the Awami League in early 1971 led to a bloody internal war with large-scale Pakistani atrocities. India began supporting Bengali insurgents; after Pakistani airstrikes, India launched a massive ground invasion of East Pakistan in December 1971 that defeated Pakistani forces and laid the basis for the creation of Bangladesh. Throughout this period, Nixon and Henry Kissinger were fiercely hostile to Indian policies and made public signals of this hostility, most notoriously including moving the USS Enterprise aircraft carrier battle group into the Bay of Bengal.Footnote 21
Indian public opinion reflects this breakdown in Indo-American relations, followed by a quick rebound over the 1970s: indeed, as soon as 1973, IIPO reported a “remarkable recovery”Footnote 22 in views of the United States after the nadir of 1971. We also see a notable uptick at the end of the 1990s and the early 2000s, as US–India relations were becoming closer, as evidenced by President Bill Clinton’s historic trip to India in early 2000. Both of these shifts make sense given events and the general tenor of India–America relations.
Figure 19 shows for the period between 2006 and 2018 similarly favorable opinion of the United States, with some tailing off after 2016. Gallup (in blue) asks respondents for their views of the leadership of the United States, while Pew (in red) asks the broader question of favorability toward the US. As Section 2 showed, these trends are similar to views of Russia and far more favorable than toward China. The United States is one of several plausible partners in the eyes of the Indian public. It is a useful state with which to do business in India’s quest to build a pivotal position at the center of an increasingly multipolar world order. In 2025, Pew confirmed ongoing general favorability toward the United States.Footnote 23
Views of the United States in Pew and Gallup polls

We can see the “pretty prudent public” even before the International Images series begins. In a 1956 survey that asked about the sources of attitudes toward the United States and Soviet Union, respondents pointed to the American policies toward Kashmir, Goa, and alliance with Pakistan as reasons for their opinion toward the US.Footnote 24 These are informed attitudes given the geopolitical context of the day, representing the key points of friction in the US–India relationship in the 1950s (and beyond).
The attitudes expressed by the wealthy, urban foreign policy public are, on average, reasonable reactions to external conditions showing consistency and structure. Our claim is not that these attitudes were driving outcomes like vote choice or partisan identification, but it is plausible that they provided a greater level of constraint on Indian leaders than a purely top-down, elite-centric approach would suggest: Foreign policy constraints are certainly “malleable” (Hyde and Saunders, Reference Hyde and Saunders2020) given the higher priority of domestic issues, but not infinitely so, and especially not in contexts like the 1971 war or America’s Pakistan policy that are highly visible and salient (Narang and Staniland, Reference 80Narang and Staniland2018).
Nuanced Attitudes
Alongside overall favorability, respondents repeatedly expressed serious disagreement with individual American foreign policies. We need to be careful to disentangle the two: there have been, and continue to be, deep strands of Indian skepticism toward specific American foreign policies that coexist with favorable general attitudes. An overemphasis on the former without taking into account the latter would underpredict the willingness of the public to support a shift in policy toward the US. But overplaying top-line favorability of the US would lead us to expect more policy convergence than we actually observe, given fundamental differences on particular, but very important, topics.
Indians have been broadly positive toward the United States, but do not always see their interests as aligned with Americans. Sometimes overall attitudes move in sync with perceptions of interest alignment, like in 1965, when 56% felt that US and India’s “basic interests” were very much or fairly in agreement compared to 12% saying they were rather or very different,Footnote 25 or in 1971 when there were clear negative signals in both overall favorability and assessment of India–US policy alignment. The 1971 survey led IIPO to assess that “the conclusion seems inescapable that the image of the United States has suffered more grievously than ever before,”Footnote 26 and also that “mutuality of interests” evaluation had dropped from 56% very/fairly aligned and 12% rather/very different in 1965 to 46% very/fairly aligned and 40% rather/very different.
In other periods, however, we see divergence between overall favorability and specific issue assessments. This is not necessarily evidence of inconsistency or lack of coherence: It is possible to both have a positive attitude toward a country and disagree with specific aspects of its foreign policies. IIPO data provide several examples of this dynamic. In 1960, the survey found that respondents were very satisfied with US–India relations and felt that ties would only get stronger under Kennedy – while also reporting that they hoped for adjustments in foreign policy (with a focus on greater aid for industrialization of the underdeveloped countries) and that US foreign policy toward the USSR was too hard-line.Footnote 27 Interestingly, the Kennedy administration’s focus on providing economic aid and military support to India did not seem to buy a major “bump” in US favorability – this may be because the US got involved in a (doomed) effort to push for a Kashmir settlement in 1963 that could have counteracted any positive effects of this American aid.Footnote 28
In March 1968, respondents were asked about whether they felt the US was sincerely trying to initiate peace talks in Vietnam; 39% said yes, 32% no, and 29% had no opinion, while the plurality of respondents also felt that the US should pull out of South Vietnam rather than continuing to fight on.Footnote 29 Indians were not in favor of US policy, yet many also thought the US was sincerely trying to find a peace. In that same survey, respondents overwhelmingly offered a positive view of the US (14% very good, 42% good, 23% neither, 7% bad, 1% very bad, and 13% no response).
Similarly, in 1984, an overwhelming 70.9% of respondents identified American arms sales to Pakistan as “the greatest threat” to India – while in the exact same survey, 71.2% offered a very good or good opinion of the United States.Footnote 30 In 1982, IIPO surveys found that respondents overwhelmingly disapproved of US increases in military strength in the Indian Ocean, finding them threatening,Footnote 31 and also had strongly net positive views of the United States in general.Footnote 32
Beyond Pakistan and the Soviet Union, there have been several other policy areas marked by consistent disagreement. First, Indian respondents regularly disagree with US nuclear nonproliferation policies. In 1982, respondents identified two key issues as most problematic for US–India relations: first, US support for Pakistan, and second, American reluctance to supply nuclear fuel for the Tarapur plant.Footnote 33 The Middle East has been a second area of divergence. For instance, in July 1967, IIPO did a major survey of Indian views of the recent Middle Eastern crisis, including assessments of the role played by the USA: 22% approved, 43% disapproved, and 31% couldn’t say. The disapproval level was notably lower when asked about the Soviet role in the conflict.Footnote 34 In 1981, a question about the US building up its military posture in the Indian Ocean in reaction to the Iranian Revolution and Soviet Afghanistan intervention showed strong disapproval from respondents: 13.2% strongly or somewhat approved, 16.7% somewhat disapproved, and a remarkable 46.7% strongly disapproved; Don’t Know responses were a relatively low 17.7%.Footnote 35 An even higher proportion strongly disapproved of the US decision to provide weapons to Pakistan.
During the Cold War, respondents also were skeptical of Indian values being similar to either American or Soviet values – in 1983, IIPO summarizes a question about values as showing “India considers herself as being substantially different both from the United States and the Soviet Union, and the proportions are very much the same.”Footnote 36
In recent years, unlike during the Cold War, there is substantial evidence that Indian respondents see greater convergence of interests alongside clear enduring disagreements. Views of Russia and the Middle East continue to be divergent: as Section 5 shows, Indian respondents have had quite positive views of Russia, while Indians in 2006 were overwhelmingly glad to have not joined the US invasion of Iraq.Footnote 37 At the same time, there has been a broader shift in assessments of US openness to Indian interests. The nuclear issue has subsided as a source of tension since the civil nuclear deal of 2008, and American distancing from Pakistan since roughly 2010 has consolidated a US “tilt” toward India in South Asia. In a 2023 survey, Pew reported that the plurality of the Indian public believed the United States was growing stronger (49%) and more influential (49%), that the US takes into account the interests of countries like theirs (72%), and that the US contributes to peace and stability around the world (70%). All of these were higher than the median of the other twenty-two countries in the Pew survey. By contrast, China was seen the most negatively in India of the twenty-three sampled countries, with 67% of respondents unfavorable.Footnote 38
This is not an outlier poll. In 2014, Pew also found strong pro-American sentiment, including a plurality viewing America as a partner (36%) compared to enemy (16%) or neither (16%).Footnote 39 The Observer Research Foundation’s 2021 survey of Indian youth also identified the United States as the most trusted external power (77% trust completely or somewhat) and most likely external state to become one of India’s leading partner; a majority also expressed a desire to side with the United States over China if tensions continue to rise and agreed with the move to strengthen the Quad.Footnote 40 These attitudes are compatible with the trajectory of US–India relations. There are of course very important divergences between the two countries, but public opinion is tracking in parallel with actual developments (with the open question of what the tensions of the second Trump administration do to Indian views of the United States).
Finally, we see fascinating evidence of American influence even during periods of limited bilateral cooperation. In 1969, IIPO reported on Indians’ views of American influence on India. Even in this pre-globalization era, 52% of respondents reported a very great or great deal of American influence on Indian life, with 28% responding moderate and only 12% responding small or very small, and 8% not responding.Footnote 41 The UK and Soviet Union both rated notably lower in their extent. US influence was rated as more beneficial by 50% found the US influence more beneficial and 29% more harmful, with 21% not knowing or refusing to answer. The United States was present in the minds of respondents despite this being a period of both tension and comparatively muted social and economic interaction. In the 1960’s survey about the election of John F. Kennedy, nearly 80 percent of respondents correctly identified his party – while this was a disproportionately urban and literate sample, it is notable how aware Indians have been of the United States even in periods when we might expect greater distance.Footnote 42 In 1968, 78 percent of respondents reported knowledge of Lyndon Johnson’s decision not to stand for reelection.Footnote 43
As information and people have flowed more openly across borders in recent decades, Indian respondents have unsurprisingly been able to offer reasonably careful assessments of the United States. In a 2023 Pew study, when asked about various aspects of the United States. Indian respondents viewed American universities the most favorably and American entertainment the most negatively.Footnote 44
The findings thus far show a nuanced and comprehensible structure of attitudes toward the United States among India’s foreign policy public. Shifts in public opinion broadly track events in international affairs and reflect some degree of awareness of international affairs. While we have noted throughout this manuscript that respondents are a biased subset of the entire population, this subset’s attitudes make sense given the objective trends in US–India relations and Indian foreign policy. The Indian public is likely to focus its attention and voting decisions on domestic issues, but its attitudes can nevertheless provide space for or constraints on foreign policymaking. We return to the implications of this “pretty prudent public” finding later.
What Explains Variation in Views of the United States?
We could imagine a wide variety of attributes driving attitudes toward the United States, from economic class to partisan identification. As in our analysis of China, however, we are struck by the consistent importance of region, even when controlling for a wide set of other characteristics. By contrast, partisanship is simply not a major driver of foreign policy attitudes in the data we have analyzed. As we discuss in Section 6, this may change in future as Modi and the BJP increasingly use foreign policy on the campaign trail (Vaishnav and Mallory, Reference Vaishnav and Mallory2024). It is possible that partisanship or other ideological factors may increasingly align with foreign policy views as a result of campaigning, so we are cautious in assessing implications.
Figure 20 presents analysis of the correlates of approval of the United States across the various surveys we use in this project. We see notable differences across region, using North India as the comparison region. As discussed in Section 2, Gallup uses a different sample of major states, which may explain why Gallup findings diverge from Pew and IIPO.
Regional variation in approval of the United States

In all three, however, region appears as a significant correlate of favorability. This is consistent across all of our analyses and surveys. Obviously, more research on the regional dimension is necessary, and we can only speculate about underlying drivers of this cleavage: This appears to be robust to a wide variety of covariates that we might think region would be proxying for. We also note that South India generally has more positive responses across the board, so there may be important nuances in how respondents approach surveys across regions.
The “Missing” Partisan Cleavages
Partisanship has not been an important determinant of Indian views of the United States in the twenty-first century. Even as foreign policy has grown more central to the BJP’s campaigning style (Vaishnav and Mallory, Reference Vaishnav and Mallory2024), there are not clear differences in how parties articulate their foreign policy views or in how partisans view these issues. The 2024 campaign, for instance, did not seem to polarize the population into different views of China or the United States. Figure 21 uses the survey data from Pew before and after the 2014 election to compare BJP and non-BJP supporters’ attitudes toward the US. There is little evidence of partisan differences.
Favorability of US by Region and Party

While some on the Indian right have argued for suspicion of the United States (especially of the Democratic Party) because of its perceived hostility to Narendra Modi and the Hindu nationalist movement, the data we analyze does not suggest that there has been a major partisan divergence in attitudes toward the United States as of the late 2010s. This could be because parts of the left are also America-skeptical, attenuating any partisan imbalance. More likely, we suspect that the activists and intellectuals who articulate anti-American views on both ends of the spectrum are simply not representative of mass public opinion on this issue: The consistently high favorability of the United States does not suggest that both left and right are united in opposition to the US.
There are a few plausible explanations for this partisan convergence: US foreign policy has been broadly supportive of India for decades, people-to-people ties have grown with increasing Indian emigration to the US, American firms have sought to invest in India, and young Indians express very high levels of support for the United States as a strategic partner.Footnote 45 This does not mean that Indian respondents support all aspects of American foreign policy (far from it), but views of the US have not become a politicized division between parties. In the 2024 general election, which saw Modi win a third term but the opposition do surprisingly well, the US was not a political wedge issue in any major way. The days of Mrs. Gandhi denouncing American interference as a sinister “foreign hand” are largely over at the level of mass politics, even though it may persist among particular elite and political groupings.
This also means that general trends in Indian foreign policy toward the United States may not depend much on which party is in power. The center-left INC was a key player in advancing US–India ties between 2004 and 2014 and there are no current indications that it would radically backtrack if it took power in the future. A 2024 Pew poll comparing confidence in Joe Biden and Donald Trump showed major differences in views of the two politicians in most countries, with the majority showing greater confidence in Biden than Trump. In India, by contrast, they were viewed as largely indistinguishable: 42% expressed confidence in Trump to do the right thing in global affairs compared to 44% for Biden.Footnote 46 Our sense is that this reflects a general inclination to work with US leaders when they are willing to provide benefits to India. US internal politics seem to resonate little with Indian domestic political cleavages.
America, India, and the Domestic Politics of Foreign Policy
India has had a tumultuous relationship with the United States since independence. America’s alignment with Pakistan and rapprochement with China put enormous pressure on India, which looked to the Soviet Union and its own domestic resources to navigate the Cold War. Since the end of the Cold War, India has grown dramatically and has succeeded in carving out a more prominent place in the international system. In part, it has accomplished this by building a deeper strategic and geoeconomic relationship with the United States, which sees India as a partner to manage China’s rise.
The views of India’s public have largely tracked this trajectory. The foreign policy public has held generally pro-American sentiments, excepting a massive dip around the 1971 war. At the same time, it is essential to also note that favorability is not the same as approval of specific American foreign policies, whether toward Vietnam or Pakistan or Russia. We find a nuanced set of attitudes toward the United States, mixing general favorability with deep disagreements around specific issues. This helps make sense of how easy it has been for Indian leaders to deepen their relationship with the US without triggering domestic political backlash: A reservoir of general pro-American sentiment already existed, and when foreign policies began converging, there was little constituency for sustained resistance (outside of a rapidly collapsing far left). Public opinion has been a permissive condition for shifting policies toward a tighter alignment with the US.
India has both been home to anti- and pro-American sentiment, often simultaneously. This suggests that there is firm domestic-political grounding for continuing Indian cooperation with the United States in the years to come. At the same time, the public is likely to seriously disapprove of specific American policies, creating some constraints on Indian leaders as they choose the specific topics on which to cooperate with the US. If American policies shift away from being favorable to India, perhaps driven by a rapprochement with China or reengagement with Pakistan, we would expect a return to the more nuanced and uneven views that characterized Indian attitudes during the Cold War; this is where the Trump administration’s embrace of Pakistan and levying of high tariffs on India could badly undermine America’s position among the Indian public.
As with our research on both China and Russia, we do not find deep partisan, class, or other domestic cleavages driving variation in individual responses. Instead, we see region appear as a consistently important predictor of attitudes toward the US, but with different directions depending on the poll. At minimum, this shows a different set of relationships between foreign policy and internal politics than IR scholars often assume. Classic left-right distinctions have always fit uneasily with Indian politicsFootnote 47 and foreign policy may be another area in which scholars need to loosen their assumptions about how domestic politics play out.
India’s distinctive position in the international system has contributed to a complex set of public views of foreign policy options that both show India’s ability to occupy a pivotal position and areas of potential division and tension that could undermine this position. Within our own study, we see both substantial convergence between the Indian public and US policy with regard to China (Section 3) but a substantial divergence between the two in views of Russia, to which we now turn.
5 India and Russia’s Long Partnership
While Russia has reemerged in the last decade as a serious rival to the United States and Europe, its relationship with India is radically different going back to its existence as the Soviet Union.Footnote 48 India is a democracy and Russia/USSR has been almost continuously an autocracy, but this difference in regime type has not stopped the Indian public from viewing Russia in broadly favorable terms both before and after the end of the Soviet Union. As with views of the United States, these attitudes do not break down along left-right lines. During the Cold War, even right-leaning, anti-communist parties were much more consistently concerned with China than with the USSR. Since the end of the Cold War, Indian parties of all ideological persuasions have sought to maintain good relations with Russia. This does not mean that Indian policy is locked into tight alignment with Russia: As we saw in the previous section, India has moved much closer to the United States in recent years and its public is quite sympathetic to the US. But it does mean that India and its public are not looking to throw their lot in with the US and “the West” against Russia and other autocracies.
India’s relationship with Russia is by far the least eventful relationship of the three we analyze in this Element. China and the United States have both had substantial disagreements with India, with China also fighting a major war and engaging in several serious border skirmishes. Both countries have at times become domestic political issues, whether in the crackdown on suspected sympathizers of China among India’s Communists in the 1960s or the debates about the civil nuclear deal with the US in the 2000s. Russia/USSR, by contrast, provided aid and outreach in the 1950s and 1960, signed a treaty of peace, friendship, and cooperation with India in 1971 (and supported India in its crisis and war with Pakistan that year), has consistently voted supportively of India in the United Nations, and has long been a crucial supplier of military equipment to India. It avoids comment on India’s internal affairs and since invading Ukraine in 2022 and suffering from sanctions, has also facilitated oil sales to India at good prices.
For scholars of international relations, Indian’s views of Russia are an important reminder that democratic publics in the global South can see things quite differently than those embedded in the America-led Western security order. India’s public’s views of Russia and the USSR reflect a radically different geopolitical position and domestic history: The USSR was never seen as a major external threat to India, the internal threat of Leninist communism was less severe than in many other states, and Soviet/Russian policies have provided clear material advantages for India. Given the centrality of India to American strategy in Asia, a more nuanced understanding of its public’s views toward America’s rivals is particularly essential.
In this section, we describe trends in general favorability over time, explore more nuanced questions about perceptions of Russia/USSR, and then delve into disaggregated analyses to explore variation in individual responses, before concluding with implications of our findings.
Indian Views of Russia/USSR Over Time
As with the analysis of views of the United States, survey data indicates that India’s foreign policy public holds, on average, fairly informed and reasonable opinions about the Soviet Union/Russia. Figure 22 summarizes the IIPO survey’s data on views of the Soviet Union/Russia over the course of the Cold War.
Views of Russia/USSR in Indian Institute of Public Opinion surveys.

Trends over time tell a simple, though important, story: consistent and high approval of Russia/USSR. There are not the wild swings we see in views of the US in the early 1970s nor the extremely negative attitudes respondents have of China. We do see some variation across time for which it is worth speculating about the causes. In the late 1960s, the USSR was seen as reaching out to Pakistan as well as India, which might have affected a mild decrease in approval: IIPO assessed that the drop in approval of the Soviet Union in this period was due to its “flirting with the policy of equidistance between India and Pakistan.”Footnote 49 But after the signing of the Treaty of Peace, Friendship, and Cooperation between India and the USSR in August 1971, followed by firm Soviet backing for India in its war with Pakistan, we see views jump back up, remaining high until the collapse of the USSR. We explore this post-Cold War period after first exploring the Cold War.
What can be learned of the substance of views toward the USSR/Russia during the period under study? A 1956 survey – before the IIPO International Images series began – highlighted Soviet positions on Goa and Kashmir as important to forming respondents’ views of the USSR.Footnote 50 The USSR had adopted a broadly pro-Indian position on Kashmir, seeing Pakistan as part of the US-led bloc, while it also supported Indian claims on Goa as part of a Soviet strategy of backing anti-imperialist positions in world affairs. IIPO assessed that “the entire pro-Russian sentiment in this matter can be accounted for in terms of Goa and Kashmir” beyond some low-level pro-communist feeling in Kolkata. This is the inverse of attitudes toward the United States on the same issues, in addition to negative views of the US around its support for Pakistan. In 1956, respondents had a reasonably accurate sense of the relative political positioning of the US and USSR on topics central to Indian foreign policy.
These attitudes do not indicate an ideologically pro-Soviet public looking to align with the USSR. In a March–April 1957 survey question in seven states about whether India should join pro-communist alliances, anti-communist alliances, or neither,Footnote 51 the overwhelming plurality of respondents either answered that they did not know (46%) or neither (39%); positive support for any kind of alliances, including with the USSR, was very low. In 1960, respondents expected capitalism and communism to survive by 1980 in roughly equal percentages: the Indian population did not lean toward communism as a political project.Footnote 52
Similarly, on questions about superpower aid in 1977, IIPO assessed that
Realism and cynicism seem to dominate the replies to the reasons for aid from the Superpowers. Only fourteen per cent feel that the U.S.A. provides aid on humanitarian grounds and only thirteen per cent share the view that the U.S.S.R.’s aid is based on humanitarian grounds. Fifty-two per cent feel the U.S.A. gives aid in its own self-interest and forty-six per cent have this opinion of the U.S.S.R. Nearly a quarter of all respondents however hold the view that aid is given on both grounds of humanitarianism and self-interest.Footnote 53
IIPO noted that an increase in popularity of the United States, “does not imply any devaluation of the Soviet Union in the Indian people’s estimation,” with support for the USSR based on its “timely assistance whenever this country faced a crisis.”Footnote 54 While there were certainly leftist currents within Indian politics, these survey results combined with the extremely limited national reach of Communist parties make clear that pro-Soviet sentiment should not be read as an ideological endorsement of or deep sympathy toward Soviet Communism as a political system.
Instead, public attitudes broadly tracked trends in events and geopolitics. There was faith in the early 1960s that the USSR would win the Cold War – urban respondents believed the Soviets were winning 23.5% to 5.4% in 1961, due to a major lead in missile technology.Footnote 55 Yet in the same survey, respondents strongly felt that the US and West were doing as much as they could to help underdeveloped countries with economic aid.Footnote 56 Rather than a binary trade-off, respondents often expressed positive views of the USSR at the same time as they did about the US and Western countries. The trends changed in response to developments: In 1966, Indian respondents rated the US and USSR about equal in scientific development,Footnote 57 but by late 1969 (with the survey taken after the Apollo 11 moon landing), Indians overwhelmingly chose the United States as the country most likely to lead in the field of science.Footnote 58 Respondents were not blindly or dogmatically pro-Soviet, recognizing the limits of the USSR in international competition and showing little interest in adopting its domestic system.
As the Cold War progressed, Indian respondents continued to explain favorable views toward the USSR with reference to tangible policies. The Tashkent Conference of January 1966, following the 1965 India–Pakistan war, pushed positive assessment of the Soviet Union incredibly high. Interestingly, in the same surveys, as noted in Section 4, views of the United States also remained quite positive: In 1968, IIPO reported that America’s “position vis-à-vis the Soviet Union remains unchanged”:Footnote 59 Indian respondents once again do not seem to have perceived a zero-sum choice between the two. There was something of a dip in the late 1960s, which the IIPO attributed to Soviet outreach to Pakistan; the surveys also suggest a growing Indian public perception of the US pulling ahead in both the space race and the military balance and an improvement in Indian views of the US as seeking to avoid major war.Footnote 60
The 1980s provide fascinating evidence of how India’s foreign policy public viewed the USSR (and its competition with the US) during a period of resurgent Cold War tension, just before the end of the Cold War set the stage for shifts in India’s foreign policy approach. Opinion toward the US dipped a bit by 1981, after it had become clear that the US was reengaging with Pakistan to push back on the Soviet invasion of Afghanistan. This opened space for the USSR to return to being the most-favored nation in IIPO’s International Images survey.Footnote 61 As we saw in Section 4, Indians strongly disapproved of the United States selling weapons to Pakistan. The Soviet intervention in Afghanistan was not seen as similarly threatening to Indian interests: in 1980, IIPO reported that “the armed intervention in Afghanistan seems to have left little adverse impact on the Soviet image in this country.”Footnote 62 In this survey, a majority of Indian respondents felt that Indian interests were “very much” or “somewhat” in agreement with those of the Soviet Union.Footnote 63
In April 1980, IIPO reported on specific questions about the Soviet intervention.Footnote 64 Its finding did not reflect blind pro-Soviet sentiment: more respondents felt that the Soviet intervention was intended to “take over the control of the Afghan government” than accepting the Soviet rationale that it was “to help the legitimate government handle rebellious groups supported from outside”; this sentiment was especially pronounced among more educated respondents. There was a cross-cutting generational effect, in which older respondents were more likely than younger to accept the Soviet justification, perhaps reflecting attitudes forged at different historical periods. More respondents also felt that the US was the most powerful country in the world, with 49% answering the US compared to 38% choosing the USSR.
This skepticism of the Soviet rationale and understanding of greater US power suggest that respondents were not simply following Soviet propaganda nor full of ideological zeal. Instead, we see evidence of calculation about interests: when asked in the survey which countries would come to India’s defense if its security was threatened, the USSR was the overwhelming favorite, with 66.3% selecting it, followed very distantly by the USA (14.5%). When asked what India should do about Afghanistan, the dominant responses were “No Special Action” (45.5%) and “Strengthen our military defence” (25.1%), rather than openly supporting the Soviet intervention (10.9%) or taking measures in opposition to it (such as boycotting the Moscow Olympics or halting trade with the USSR; 4.8% and 3.3%, respectively). These attitudes were also particularly strongly held among more-educated respondents; IIPO notes this apparent “paradox”: “it is the ‘aggressor’ in Afghanistan who, in popular perception, is regarded as the protector of the security of this country.”Footnote 65 Respondents also rejected cooperating with the US in response to the intervention.
This is a reasonable, clear-eyed configuration of attitudes – much of the public was skeptical of the Soviet intervention’s motives and thought the US was the stronger country, but viewed the Soviet Union as a more reliable ally for India. The Indian public thus favored doing nothing publicly and/or building up India’s own military strength, rather than either backing or opposing the Soviet action. In 1981, the importance of the India–USSR relationship to respondents is clear: when asked how important good ties to the USSR is, 73.8% responded that it was Very Important, compared to only 49% answering the same about the US.Footnote 66
The lack of a strong set of ideological or policy commitments to the content of the Afghan conflict is also apparent in 1982, when respondents who were aware of the conflict were largely split between preferring the Afghan government (28.7%), the resistance forces (25.8%), not caring either way (21.9%), and not having an opinion (23.7%).Footnote 67 The Soviet intervention, however, was not seen as very threatening one way or another, with only 2% of respondents in 1984 identifying it as the single greatest threat to India and 13% identifying as any kind of threat to India.Footnote 68 By 1986, there was overwhelming disapproval of the Soviet military presence, and at the same time a strong desire to strengthen relations with the USSR.Footnote 69 The evidence is quite clear that Indians did not especially like the Soviet intervention or want India to support it, but viewed the military presence as relatively unthreatening, while the USSR was seen as a crucial ally. Indian respondents were not blindly pro-Soviet or unaware of broader power realities, but found the USSR a more consistently friendly political power despite its limits and mistakes.
In the post-Cold War world, Russia has had a less central position in Indian public opinion or foreign policy than it did during the Cold War. As we saw in the previous section, India–US ties have grown dramatically and public sentiment has largely been supportive of that change, even if there continue to be serious areas of policy divergence. Economic and social flows between the two countries are extensive and growing, and there is much greater cultural knowledge in India about the US than about Russia (for many reasons, from diaspora ties and colonial history to American pop culture, the number of Indians who speak Russian is incomparably smaller than the number who speak English).
Nevertheless, Russia has retained strong favorability (Figure 23) and a perception of overlapping interests among the Indian public. There was a meaningful dip in the early 1990s, perhaps reflecting the chaos and weakness of the faltering Soviet and then Russian state after the USSR’s dissolution. However, this rebounded fairly clearly by the late 1990s in the IIPO data and has remained relatively positive in the modern survey data. This relationship is in some ways less messy than that with the United States: while the cultural and social connectedness is much lower, so too are Russian interests in human rights or democracy – issues that make the US appear meddling and hypocritical. Crucially, India has materially benefited from Russian support, whether military sales, access to affordable oil, or diplomatic backing at the United Nations.
Views of Russia in Pew and Gallup polls
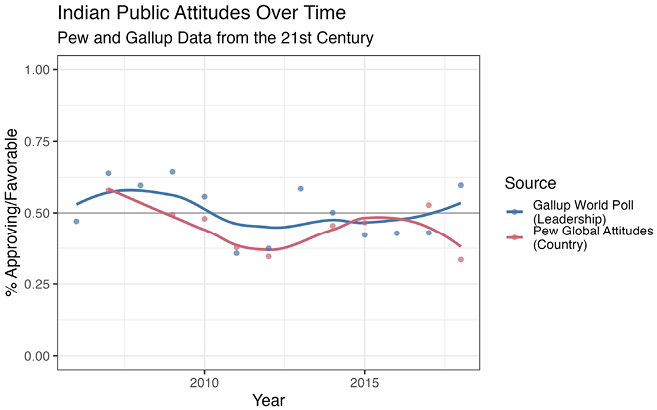
In both 2007 and 2014, Pew found strongly favorable views of Russia among Indian respondents.Footnote 70 In 2014, these views were mildly less favorable than those toward the United States (45% favorable/23% unfavorable regarding Russia, 56% favorable/15% unfavorable regarding the US), but still clearly very pro-Russian. As during the Cold War, this suggests that there does not seem to be a zero-sum approach to Russia and the United States in the public mind. More recently, the Observer Research Foundation found in its 2023 survey of young urban Indians that “the US, followed by Russia, Australia and Japan, are seen as India’s favored partners in the coming decade. This reflects an understanding of India’s historical partnerships (Russia) while simultaneously acknowledging the growth in the country’s contemporary relations, with all three Quad partners being included in the list of India’s most likely future partners.”Footnote 71
The Ukraine war has not shaken this basic structure of attitudes. Pew found in 2023 that:
Russia is likewise seen favorably in India. In fact, India is the only country surveyed where a majority has a favorable view of the country – including 23% of Indians who see Russia very favorably – and is one of two countries where ratings for Russia have become more favorable in recent years. Of the 11 countries where Russian energy was a particularly salient issue, India was also one of three countries where a majority prioritized maintaining access to Russian oil and gas over being tough with Russia on Ukraine. Indian imports of Russian oil recently reached new highs, and India has repeatedly abstained from voting on Russia’s invasion of Ukraine.Footnote 72
Indians do not necessarily want to take Russia’s side on its invasion of Ukraine: ORF’s youth survey found that “majority of the urban youth (80 percent) agreed that India should remain neutral in the Russia-Ukraine war, and 82 percent said India should look beyond Russia for defence partnerships” (ORF, Reference Pant, Shivamurthy, Shekhawat and Deo2023, 13). Instead, the Ukraine conflict seems to be seen similarly to the Afghanistan intervention – not desirable or actively backed, but not sufficient to severely degrade the importance of the broader relationship. Just as Indians can express broadly pro-US sentiment while disagreeing with specific US foreign policies, so too they can feel positively toward Russia even while being uncomfortable with some Russian actions.
As with our findings toward the United States and China, the Indian foreign policy public – keeping in mind important caveats about the class- and education-biased nature of its composition – holds attitudes toward Russia that make sense given Russian policies toward India. This case is in some ways the simplest and most straightforward: Russia and India have few sources of tension compared to the United States or especially China, and their relations are dominated by state-to-state ties in contrast to the huge people-to-people flows that now characterize Indians’ relationship with the US. Indian respondents showed little evidence of supporting the Russian wars in Afghanistan and Ukraine, but neither did they see these as sufficiently problematic to sway their overall views. The surveys also do not show Indians feeling a need to reduce their favorability of Russia due to having positive views of the United States. The kind of multi-alignment that India seeks is reflected in (or reflective of) Indian public opinion: India using its positive relationships with powers that are themselves adversarial to one another as a source of power in the international system.
What Explains Variation in Views of Russia?
We next turn to more fine-grained analysis of the correlates of favorability toward Russia. As in other sections, we find a strong regional effect but limited partisan cleavage. North and South India show notably different results – across very different surveys, samples, and time periods – than the east and west. We do not have a Russia-specific intuition about these differences and, as in some other cases, suspect there may be broader regional or cultural differences – including regionally varying interest in communism, which would support favorable views of the USSR – in how respondents answer survey questions. As with other results, however, there is clearly something going on at the regional level that directs our attention to better understanding how Indian regions vary in their attitudes toward foreign countries (Figure 24).
Regional variation in approval of Russia
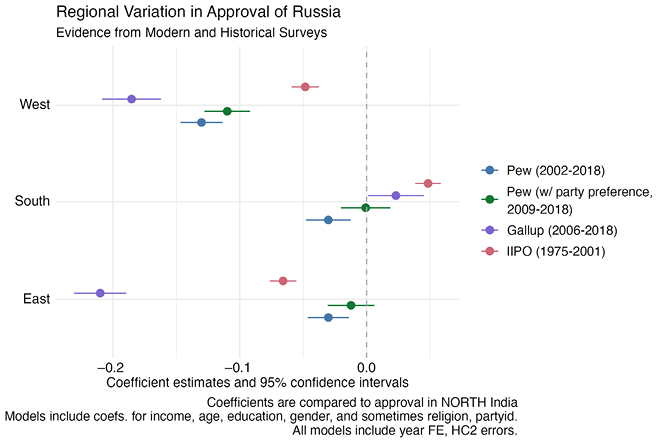
Figure 25 shows the partisan breakdown in views of Russia, and emphasizes that Russia is not an issue on which parties take different stands, highlight prominently in their campaigning, or seek to polarize voters. Unlike in the United States in the Trump era (or during the Cold War), Russia simply does not figure as a meaningful topic around which to competitively mobilize political coalitions. This is a striking reminder of how much the same state can vary in its political salience and meaning across countries, even those with similar regime types that are aligned on other topics.
Favorability of Russia by region and party
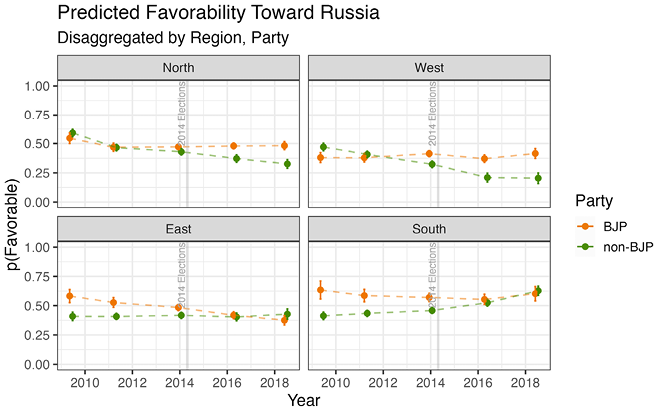
India, Russia, and the Politics of Multipolarity
The evidence in this section clearly shows that the Indian public has held a consistently positive view of the USSR/Russia over the last six decades. The generally autocratic nature of the USSR/Russia’s domestic political system has mattered less than its support for Indian diplomatic positions, willingness to sell reasonably priced military supplies, and lack of interest in lecturing India on values or regime politics. The “pretty prudent” Indian public’s opinions reflect this geopolitical configuration. While cultural and social ties with Russia are far weaker than with the US, Russia provides different, complementary benefits that Indians find valuable and hard to replace. Russia’s future position is not assured, however, especially if it is seen as largely responding to Chinese direction or cannot continue to provide benefits to India. Nevertheless, Russia has an accumulated reservoir of goodwill with deep historical roots. Western criticisms of India over its stance toward Russia after Russia’s invasion of Ukraine in 2022 were met with hostility by Indian foreign policy elites, and the survey evidence we provide suggests that criticisms likely also fell on fallow ground among the public.
This does not mean that the public has approved of all of Russia’s foreign policy choices. We see fascinating evidence in the IIPO data from the 1980s of ambivalence about or opposition to the Soviet intervention in Afghanistan. Recent data on the Ukraine–Russia war reflects similar attitudes – neither a condemnation of the Russian action nor a desire to have India support it. India’s foreign policy public holds nuanced views when it comes to disentangling Russia’s general value to India from its specific foreign policy choices.
This nuance is also apparent in how Indians think about Russia and the United States – both are seen as valuable partners in the pursuit of a multipolar order that gives India a prominent place at the global table while managing China’s rise. There is not a zero-sum attitude toward Russia and the US today, nor was there such an attitude during the Cold War. India’s comfort with multipolarity is clearly reflected in how its public thinks about these two countries; while they see each other as rivals, Indians seek to maintain good terms with both, rather than having to choose. This is a crucial reminder to Western scholars and analysts that the frames through which they approach international relations – such as the clash of democracy versus autocracy – may be very different than the perceptions of others in the international system. Comfort with multipolarity is not simply a matter of elite strategy, but can also be found in decades of public opinion data.
External analysts of Indian foreign policy need to internalize this difference. While Western (and Chinese) policymakers and foreign policy intellectuals sometimes view US–Russia and US–China competition as binaries, India does not adopt the same Manichean lens for Russia. In other parts of Asia, the same is true of US–China competition. At both the elite and mass levels in India, there is a history of and a preference for managing relationships with multiple global powers rather than seeing these relationships as intrinsically zero-sum.
6 Implications for Research and Policy
Foreign policy scholars have long held mild disinterest in Indian public opinion, based on the assumption that Indian voters themselves were mildly disinterested in world affairs.Footnote 73 The concerns of India’s mass public were thought to be focused on food prices, labor markets, caste politics, or language, not the country’s relationship to distant powers or its status in international institutions. Surely there have been (and still are) many Indian citizens whose political energies are consumed by pressing domestic concerns, but a meaningful portion of India’s public has been forming coherent attitudes about international issues stretching back into the earliest decades of India’s independence.
At a moment when India is both rising and facing hard choices about how to navigate the international system, the historical patterns that we identify in the who, what, and why of Indian public attitudes about major powers over multiple decades can offer clues about the interplay between foreign policy and domestic politics in the future. We have shown that the foreign policy attitudes that persist among the Indian public today have roots in pivotal historical events stretching back to the 1960s and 1970s. They appear to respond more to macro-level changes in the external environment than they do to the messaging and political priorities of even highly popular domestic politicians, though of course both are at work. There is substantial space in public attitudes for a flexible, multi-alignment foreign policy that seeks to balance ties with the US and Russia, but less openness to China, even when political elites are trying to improve ties with the PRC.
What Structures Indians’ Opinions About the World?
We have also explored the forces structuring opinions at the individual level. First, expressing foreign policy opinions in India, as we have stressed repeatedly, is the purview of a large, growing, but nonrandom subset of the population, systematically more advantaged in terms of access to education and material resources. While evidence does not support a view that Indian citizens entirely ignore world affairs in lieu of more local concerns, it is important to remember that many people are unheard on foreign policy topics, and their views might systematically differ from those that do respond to survey questions (Berinsky, Reference Berinsky2004). India is like other democracies in this regard.
Second, we find that the structure of opinions is quite different in India compared to other countries where most research on foreign policy opinions has taken place. The relationship between partisan identity and foreign policy attitudes in India, for instance, is hard to detect even though partisan identification in India has grown strong in recent years (Barthwal and Jensenius, Reference Barthwal and Jensenius2024). Literature from polarized democracies like the United States suggests that foreign policy attitudes are subject to the same “sorting” that is creating broader ideological coherence among co-partisans (Baldassarri and Gelman, Reference Baldassarri and Gelman2008; Fiorina and Abrams, Reference Fiorina and Abrams2008), but evidence from India shows hardly any difference in attitudes toward major powers between those who support the Bharatiya Janata Party (BJP) that has governed since 2014, and those that do not.Footnote 74 Partisan divisions may occur on other foreign affairs issues, but do not appear, in our data at least, to map onto differing views of other major states.Footnote 75 Indians’ warm feelings toward Russia and the United States, as well as skepticism of China, are unifying attitudes across a partisan divide. In the United States, by contrast, the same Pew Global Attitudes survey series we analyze finds a twenty percentage point gap in the rate at which Democrats and Republicans express “approval” of China. Even as foreign policy is entering the arena of domestic electoral competition in India, we have yet to see evidence that attitudes toward major powers are an issue that divides out-partisans.
In lieu of partisanship, differences in foreign policy attitudes among the Indian public correlate strongly with region. Across time and regardless of the major power in question, the attitudes of Indians in the North, South, East, and West of the country are usually statistically distinguishable from one another after adjusting for differences that correlate with region, like development indicators and partisanship. While regional difference is a robust correlate of foreign policy attitudes from the 1960s into the 2010s, it is not a factor that appears much in the existing literature focused on other countries like Israel, the United Kingdom, or the United States.
There are several plausible explanations for the consistent (and often large) regional differences we describe throughout this Element. One possibility is that, unlike in the United States where all foreign policy threats are remote, or Israel, which is so geographically small that no area is dramatically more remote from a particular foreign power compared to any other, regional differences in India reflect a logical response to different levels of “exposure” to an issue like the border crisis with China. Regional differences might also reflect political culture in some cases. States where communist parties are more historically viable could drive higher approval of the USSR and China, though, it is worth noting that the presence of communist party support better explains opinions in South India than in the east, where communist parties have also been popular. It is also possible that South India has a distinct political culture (notwithstanding obvious differences across states in the south) that we are picking up, though more rigorous research is necessary to explore whether this is true.Footnote 76 The importance of region, in other words, is surprising vis-à-vis the political science literature, but not necessarily surprising vis-à-vis the severity of regional distinctiveness in modern India.
Third, and much in line with the lack of partisan structure to foreign policy attitudes, there are hints of evidence that Indian public opinion about major, familiar powers like the United States, Russia, and China is more complicated than a cue-taking or follow-the-leader exercise often described in older American politics literature (summarized in Holsti (Reference 78Holsti1992)). In episodes described in Section 3, we see two instances where Indian mass opinion about China is at odds with the policy preferences of massively popular and long-serving prime ministers Jawaharlal Nehru and Narendra Modi, and it is the prime ministers who changed tack in the direction of the public. It would be too bold to say that Nehru and Modi became tougher on China because they were constrained by public sentiment, but we can say that even Modi-level popularity does not automatically imply that the BJP has the ability to automatically harness security issues to its electoral advantage (Hintson and Vaishnav, Reference Hintson and Vaishnav2023; pace Sircar, Reference Sircar2020).
While there is no doubt that foreign security policy can be fused with domestic politics, it is not as straightforward as a politician playing the “foreign policy card” and expecting results – there must be meaningful and receptive public sentiment to activate in the first place. As we discuss more below, these episodes tentatively suggest that public opinion could create at least loose limits on the foreign policy decisions of India’s political leaders. Much more empirical work needs to be done to nail down the relationship between elite messaging and public opinion about foreign powers; the evidence we analyze suggests that the relationship could be consequential for domestic electoral politics.
These differences suggest that the forces structuring Indians’ attitudes toward major powers like the United States, Russia, and China differ substantially from the factors that structure attitudes about the world in Western democracies. These dynamics are certainly subject to future change, especially if India’s major political parties make more of an effort to differentiate their stances toward countries like the United States and China. Future study of issues like regional difference and the surprising irrelevance of partisan identification will add more to our picture of how Indians’ opinions are structured today and in the future.
A crucial area for ongoing work will be better understanding the relationship between elite attitudes and mass attitudes. Recent elite surveys are valuable, but it can be very challenging to get samples that can be directly compared to representative mass surveys. Finding new ways to explore elite attitudes will be crucial to identify the existence and nature of elite-mass gaps in opinion. Archival research and interviews can provide greater specificity about the conditions under which political leaders feel constraints from the public in their foreign policy – we simply lack much systematic historical or interview data on when elites feel heat from the public, though there are certainly case examples that can be pointed to, such as Nehru on the China border dispute from 1959 to 1962.
There is also space for future research that improves upon our analysis in other dimensions. The correlations we have explored in this analysis could be probed with experimental techniques, admittedly with the caution that the most readily available respondents in online panels would better reflect the educated urban samples of the twentieth-century IIPO surveys than the modern, nationally representative samples used by Pew and Gallup (Boas, Christenson, and Glick, Reference Boas, Christenson and Glick2018).
Another fruitful direction would be conducting more subgroup analysis – which we forgo because small survey samples limit the power of such analyses. For instance, one of the paradoxes we uncover in Section 2 is that the probability of expressing a foreign policy opinion increases based on some of the same factors that decrease a person’s probability of turning out to vote in India. Men, people with higher socioeconomic status, and those with more formal education are more likely to respond to questions about their attitudes toward China, Russia, and the United States, but women, residents of rural (typically poorer) areas, and people with less formal education are in fact the groups that vote at the highest rates (Kasara and Suryanarayan, Reference Kasara and Suryanarayan2015). More research focused on the foreign policy attitudes of these high-turnout groups would sharpen our understanding of the actual potential for public opinion to create meaningful accountability on foreign policy issues.
Consequences for the Conduct of Foreign Policy
What can we say about the implications of our findings for India’s foreign policy choices in the years to come? Because many Indian voters hold straightforward attitudes about major powers, which are coherent and reasonably consistent at the mass level, the foreign policy public may sometimes be able to act as at least a loose constraint on the policy visions of Indian government leaders (Narang and Staniland, Reference 80Narang and Staniland2018; Hyde and Saunders, Reference Hyde and Saunders2020).
As we noted in Section 1, however, this is not to say that we expect that significant numbers of voters in Indian elections are making their choices based primarily on attitudes about foreign affairs. Even in 2024, after Narendra Modi’s National Democratic Alliance campaign made foreign policy toward Pakistan an important piece of its platform, there is not robust evidence that vote choices turned on assessments of how Modi had responded to Pakistan-backed terror attacks during his first decade in office.
Rather, we suspect that background attitudes about major powers like Russia, China, and the United States may play a role, at least under some circumstances, in determining whether a particular policy will attrit or accrue political capital and goodwill at the margin. Creating distance from Russia would likely be unpopular since many Indians still hold positive views of Russia and Vladimir Putin even as they might hold more mixed or negative views of Russian actions like the invasion of Ukraine (Gubbala, Reference Gubbala, Fagan and Hunag2023). Conversely, in an environment where fewer than one in five Indian survey respondents trust China even “a little” (Centre for Policy Research and CVoter, 2022), there may be limits to the depth of rapprochement with China that New Delhi considers for fear of triggering public backlash: a tactical reengagement would be one thing, but a deep realignment would be another.
The particular constellation of Indian attitudes toward major powers that we find across decades of survey data – and which persists as recently as major polls in spring 2025 – creates a “path of least resistance” for foreign policy elites who want to avoid the costs of policies that are out of step with public sentiment. India’s foreign policy generally holds very positive attitudes toward the United States, and most Indians do not have warm views toward China. At first glance, this seems like it has straightforward implications. Indeed, when the Observer Research Foundation surveyed a sample of young, urban Indians in 2023, they found that nearly half of respondents preferred that India “cooperate with the U.S.” if US–China tensions escalate.Footnote 77 Most of the rest of respondents hoped for India to remain neutral; only 4 percent wanted India to cooperate with China (Pant et al., Reference Pant, Shivamurthy, Shekhawat and Deo2024). However, in the same survey, respondents evinced very different views about India’s role in tensions between Russia and the US plus Western Europe. Just over half of respondents advocated remaining neutral, while slightly more respondents favored cooperating with Russia (21%) versus cooperating with the West (17%).
As we have argued throughout this Element, these recent survey results are not very surprising when placed in a historical context stretching back to the Cold War. While the India–USSR relationship was historically much stronger than India’s bilateral relationship with the United States, the foreign policy public has a tradition of consistently positive feelings toward both countries. Public opinion supports the new foreign policy paradigm that external affairs minister S. Jaishankar has termed “multi-alignment” (Upadhyay, Reference Upadhyay2022), though it may be difficult to execute in practice. The type of multi-alignment that public opinion seems to support could, in a plausible future, see India aiming to remain neutral toward Russia–Europe/US competition, while simultaneously trying to cooperate with the United States in Asia. Strategic elites in India clearly understand that pursuing multi-alignment requires delicate diplomacy (Tellis, Reference Tellis2021), and the foreign policy public has little appetite for tradeoffs or “choosing sides” between countries that enjoy broad public approval.
Seeing Indians’ persistently high approval for Russia should encourage some reflection among the strategic community in the United States. There has been substantial interest in Washington, DC, for expanding cooperation with India, and plenty of signs that India’s elites and public welcome deeper ties. What India’s strategic elites are unlikely to welcome, whether for their own reasons or because of public opinion, is a suggestion that cooperation with the United States depends on cutting Russia loose. We are not the first to caution that engagement with India cannot succeed on a “with us or against us” basis, but identifying the roots of multi-alignment in long-standing public attitudes toward major powers further reinforces that Indian political leaders are unlikely to abandon Russia. In previous sections we compared attitudes of BJP and non-BJP supporters before and after the BJP came to power in 2014 and saw evidence of miniscule changes.Footnote 78 Accordingly, US observers should not hope (or worry) that the overall trajectory of India’s relations with major powers is subject to abrupt changes depending on who takes power in national elections.
Foreign Policy and Public Opinion in India’s Future
There are important open questions about whether and how public opinion toward foreign policy might matter in the years to come. There are reasons to expect it could matter substantially. As noted earlier, foreign policy is becoming a larger issue in India’s domestic electoral politics, motivated in part by Modi’s experience in 2019. After a cross-border terror attack struck an Indian paramilitary convoy in Kashmir two months before the 2019 polls, the Modi government’s retaliatory airstrikes caused a significant bump in the prime minister’s previously middling approval ratings at a critical time. Modi’s BJP went on to increase its parliamentary majority in the 2019 elections.
Now that India has returned to a period of coalition government – the BJP lost its parliamentary majority in the 2024 elections but still heads the governing coalition – it is conceivable that foreign policy becomes a wedge issue that both the governing coalition and the INC-led opposition use more often. If the major parties start to diverge more in the content of their foreign policy platforms – as of now, the disagreements are in the details – we might expect to see partisanship playing a more consistent role in shaping foreign policy attitudes.
We will also see if Donald Trump’s apparent turn against India (on immigration, trade, and Pakistan) during the summer of 2025 has a lasting impact on Indian public attitudes toward the United States, and whether these views either provide an opening to criticize Modi and the BJP or undermine public (and elite) appetites for cooperation with the United States across the political spectrum. It is possible that these American policies will be written off as particularities of Trump, and Modi will be seen as having done his best to deal with an unreliable partner. It is also conceivable that the present moment portends more enduringly negative consequences for Indian’s views of the United States. Scholars and survey researchers need to pay careful attention to investigating which trajectory takes hold in the years to come.
Even if parties do not use foreign policy as a wedge issue, voters may demand greater results from their governments. In 2026, India is at a foreign policy turning point. The country, long expected to become a “leading power” in Asia (Tellis, Reference Tellis2016), is in a material position to assume a larger role in the international order. It has surpassed China as the most populous country. Its economy is the fifth largest in the world and is the fastest growing major economy by a substantial margin. The assessments and expectations of Indian citizens are keeping pace with these material changes. A Pew Global Attitudes survey in 2023 found that 2/3 respondents in India agreed that the country’s “influence in the world in recent years has been getting stronger,” while only 13 percent thought India’s influence was declining (Gubbala, Reference Gubbala, Fagan and Hunag2023). A different poll the year before found that a plurality of Indian respondents (33%) viewed India as “the most influential country in Asia” (Centre for Policy Research and CVoter, 2022). Politicians’ performances on the global stage may be held to a higher standard as India assumes a more prominent global role.
We could also see a broadening of the foreign policy public. Attention to world affairs might proliferate – and, therefore, the contours of India’s foreign policy public might change – as Indians’ sense of national identity becomes more closely entwined with the country’s expanding role in global politics and as access to information, education, and media continues to grow. As the impact of climate change on India accelerates, questions of foreign policy may become central to everyday politics even among citizens with little other interest in the topic. The relationship between the Indian public and foreign affairs will continue to demand research attention in the years and decades to come.
Kai He
Griffith University
Kai He is Professor of International Relations at Griffith University, Australia. He has authored or co-authored six books and edited or co-edited six volumes. Among his notable works are Institutional Balancing in the Asia Pacific (Routledge, 2009), China’s Crisis Behavior: Political Survival and Foreign Policy (Cambridge, 2016), and After Hedging (Cambridge Elements in International Relations in 2023).
Steve Chan
University of Colorado Boulder
Steve Chan is College Professor of Distinction (Emeritus) at the University of Colorado Boulder. His publications include twenty-five books and about two hundred articles and chapters. His most recent book is Culture, Economic Growth, and Interstate Power Shift: Implications for Competition between China and the United States (Cambridge University Press, 2024).
Rumi Aoyama
Waseda University
Rumi Aoyama is Professor at the Graduate School of Asia-Pacific Studies at Waseda University, and director of Waseda Institute of Contemporary Chinese Studies. Her publications include thirteen books and more than one hundred and fifty articles and chapters. Her book, Contemporary China’s Foreign Policy [Gendai chuugoku no gaikou] was honored with the 24th Masayoshi Ohira Foundation Memorial Prize.
Advisory Board
Amitav Acharya, American University
Dewi Fortuna Anwar, National Research and Innovation Agency (BRIN), Indonesia
Mely Caballero-Anthony, Nanyang Technological University
Rosemary Foot, University of Oxford
Evelyn Goh, Australian National University
Deborah Larson, University of California, Los Angeles
T.V. Paul, McGill University
Yan Xuetong, Tsinghua University
About the Series
Elements in Indo-Pacific Security publishes original and authoritative works on diverse security topics, encompassing not only traditional issues of war and peace but also emerging concerns such as space competition and climate change. It also explores interactions among actors within this region and between them and others beyond it.