Series Preface
Urban Climate Change Research Network
Third Assessment Report on Climate Change and Cities (ARC3.3)
William Solecki (New York), Minal Pathak (Ahmedabad), Martha Barata (Rio de Janeiro), Aliyu Salisu Barau (Kano), Maria Dombrov (New York), and Cynthia Rosenzweig (New York)
Cities and the urbanization process itself are at a crossroads. While the world’s urban population continues to grow, cities are increasingly pressed by chronic and acute stresses like increasing inequity, polluted air and waters, limited governance, and financial capacities along with entrenched spasmodic crime and conflict – and nonetheless, global pandemics. Climate change has now exacerbated these problems and in many cases created new ones, at a time when cities are asked to be the bulwark of climate solutions.
The advent and application of new technologies and strategies associated with the internet, environmental sensing, multimodal transport, and new planning and design strategies portend a new golden age of sustainable cities. Some cities provide glimmers of this possible future, but persistent stresses and crises, along with climate change, push against progress. In the Urban Climate Change Research Network’s (UCCRN’s) Third Assessment Report on Climate Change and Cities (ARC3.3), we directly address these issues head-on and present state-of-the-art knowledge on how to bring all cities and their residents forward to a more sustainable future.
An absolute necessity now exists for all cities, both in the Global North and Global South, to aggressively work to fulfill their potential as leaders in climate change action. In the Global North, the task is for cities to address the emerging challenges from the changing climate and the exigencies of compliance with the United Nations (UN) Framework Convention on Climate Change Paris Agreement. For cities in the Global South, there is the double challenge of climate-resilient development, that is, meeting increasing demand for housing, energy, and infrastructure for burgeoning populations, while confronting simultaneous challenges of reducing greenhouse gas (GHG) emissions and adapting to a changing climate (UNEP & UN-Habitat, 2021). In all geographies, the implementation of transformative mitigation and adaptation in cities can be an instrument to generate livelihoods for those with lower purchasing power and can enhance capacity to better respond to shocks like future pandemics, energy supply chain spasms, and food security emergencies (UNDP, 2022).
Since its founding in 2007, UCCRN has conducted city-centered assessments. With over 2,000 scholars and experts from cities around the world, UCCRN is addressing the research agenda that was formulated at the Intergovernmental Panel on Climate Change (IPCC) and Cities Edmonton Conference (Prieur-Richard et al., Reference Prieur-Richard, Walsh, Craig, Melamed, Pathak, Connors, Bai, Barau, Bulkeley, Cleugh, Cohen, Colenbrander, Dodman, Dhakal, Dawson, Greenwalt, Kurian, Lee, Leonardsen and van Staden2018).Footnote 1 Key components of this research agenda include urban planning and design, green and blue infrastructure, equity, health, sustainable production and consumption, and finance. Over 300 UCCRN authors have now advanced this research agenda and other critical topics through ARC3.3, which consists of twelve peer-reviewed monographs to be published as Cambridge University Press Elements, both separately and together, throughout 2025 and 2026.
Benchmarked Learning
The ARC3.3 builds upon the preceding UCCRN Assessment Reports on Climate Change and Cities (ARC3), ARC3.1 (2011) and ARC3.2 (2018). The purpose of the ARC3 series is to provide the benchmarked knowledge base for cities as they affirm their essential responsibility as climate change leaders. The ARC3 series, with newly added ARC3.3 Elements, presents knowledge that builds on accumulated, shared experiences and thus advances and deepens with time.
In ARC3.1, cities were identified as key actors – “first responders” – in rising to the challenges posed by climate change (Rosenzweig et al., Reference Rosenzweig, Solecki, Hammer and Mehrotra2011). According to ARC3.1, “Cities around the world are highly vulnerable to climate change but have great potential to lead on both adaptation and mitigation efforts.”
In ARC3.2, this focus advanced into understanding how cities can achieve their potential by establishing a multifaceted pathway to transformation (Rosenzweig et al., Reference Rosenzweig, Solecki, Romero-Lankao, Mehrotra, Dhakal and Ali Ibrahim2018). It provided a roadmap for cities to fulfill their leadership potential in responding to climate change. According to ARC3.2, “As cities mitigate the causes of climate change and adapt to new climate conditions, profound changes will be required in urban energy, transportation, water use, land use, ecosystems, growth patterns, consumption, and lifestyles.”
Now, as the urgency of climate change is brought home daily, ARC3.3 offers the knowledge needed to speed up and scale up urban action on climate change. To accomplish this, the ARC3.3 presents practical methods and case study examples for accelerating change into rapid transformation in cities for cities.
UCCRN Assessment Process
The ARC3.3 authors either self-nominated or were nominated by a third-party and were selected by ARC3.3 Editorial Board through comprehensive vetting that prioritizes expertise, diversity, gender, and geographic balance. Each Author Team develops a robust assessment of an Element topic, using the latest literature, while also conducting new research. All Author Teams are responsible for conducting a stakeholder engagement session during the writing period, with the goal of ensuring relevance to a diverse group of urban decision-makers. During self-coined “Stakeholder Soundings,” authors present emerging major findings and key messages to stakeholders, including city leaders from the authors’ home cities, for their feedback. The UCCRN also coordinates a rigorous iterative peer-review process for each ARC3.3 Element that engages with both academic and practitioner experts, both in and out of the network.
The UCCRN’s Case Study Docking Station (CSDS) is a searchable database designed to facilitate peer-learning between and among cities, benchmark actions over time, and enable cross comparisons of city case studies. The CSDS includes over 230 expert reviewed case studies covering a range of topics such as climate change vulnerability, hazards and impacts, mitigation, and adaptation actions for sector-specific themes. The CSDS has a total of sixteen searchable variables.Footnote 2 For example, users can filter searches by climate zone, city population size, human development index, gross national income, mitigation versus adaptation, or directly type in keywords and city names. Of the 230 total case studies, the ARC3.3 authors have added 115 new ones, sharing insights, for example, on flood adaptation in Bridgetown, cloudburst planning in Copenhagen, and climate action financing in Durban.
Cities are vanguard sites for opportunities to enhance equity and inclusion. Equity and inclusion permeate ARC3.3 in every Element, as city experts delve into the multiple dimensions of climate change vulnerability: distributive (relating to differential vulnerability of groups and neighborhoods), contextual (relating to the root causes of vulnerability), and procedural (relating to participation in decision-making for climate change interventions) (Foster et al., Reference Foster, Leichenko, Nguyen, Blake, Kunreuther, Madajewicz, Petkova, Zimmerman, Corbin‐Mark, Yeampierre, Tovar, Herrera and Ravenborg2019). Elucidating ways to achieve climate justice for the most vulnerable urban groups and equal access to financial and technological resources for all cities underpins ARC3.3.
ARC3.3 Elements
Within twelve critical topics on climate change and cities, ARC3.3 synthesizes the latest scientific knowledge in the field while presenting new research findings and offering clear policy recommendations.Footnote 3
1. Learning from COVID-19 for Climate-Ready Urban Transformation
The COVID-19 pandemic has revealed gaps in city readiness for simultaneous responses to pandemics and climate change, particularly in the Global South. However, these concurrent challenges present opportunities to reformulate current urbanization patterns, economies, and the dynamics they enable. This Element focuses on understanding COVID-19’s impact on city systems related to mitigation and adaptation, and vice versa, in terms of warnings, lessons learned, and calls to action.
2. Justice for Resilient Development in Climate-Stressed Cities
To ensure climate-resilient urban development, climate responses – both adaptation and mitigation – must include the broader city context related to equity, informality, and justice. Responses to climatic events are conditioned by the informality of the existing social fabric, institutions, and activities, and by the inequitable distribution of impacts, decision-making, and outcomes. This Element discusses differential exposure to climate events, distributive, recognitional, procedural, and restorative justice in relation to climate impacts, adaptation, mitigation, and just urban transformation in cities.
3. Planning, Urban Design, and Architecture for Climate Action
Architects, urban designers, and planners are called on to bridge the domains of research and practice and evolve their agency and capacity by developing new methods and tools consistent across multiple spatial scales. These are required to ensure the convergence of effective outcomes across cities, regions, state/provinces, and global scales. This Element evaluates how the fields of architecture, landscape architecture, urban planning, and urban design climate change integrate mitigation and adaptation and presents a manifesto for urban transformation using science-informed design and planning.
4. Urban Climate Science: Knowledge Base for City Risk Assessments and Resilience
Cities alter the climate system both within their boundaries and nearby through interactions with impervious land surfaces, energy generation, and transportation systems. These processes that occur on urban scales are interacting with larger-scale climate change processes to exacerbate extreme events that impact urban dwellers. This Element provides temperature, precipitation, and sea level rise observations and projections for the cities engaged in ARC3.3 and assesses the latest research on urban heat and precipitation islands, compound extreme events, and indicators and monitoring, including the use of remote sensing in urban settings.
5. Governance, Enabling Policy Environments, and Just Transitions
The nature of governance, as a concatenation of social institutions and practices embedded at different scales, suggests the need for multilevel governance to address the complex challenges of climate change in cities. This Element sets forth governance structures for climate action across urban, provincial, national, and international levels, analyzes the urban focus of Nationally Determined Contributions, and assesses the potential for urban transitions and transformations.
6. Financing Climate Action
This Element documents the availability of, and access to, finance for mitigation and adaptation in urban areas. It evaluates the current international flows, national policies, and municipal utilization capacities across private and public sectors, and nongovernmental (NGOs) and community-based organizations (CBOs). Global financial capital is abundant but often flows to corporate investments and real estate development rather than into critical efforts to mitigate and adapt to climate change in cities. Political will and public pressure are crucial to effectively redirect these funds.
7. Infrastructure for a Net Zero and Resilient Future for Cities
Without infrastructure, cities could not exist. Infrastructure determines urban form, functions, economic development, people’s livelihoods, and well-being. Using transformative infrastructure, cities can achieve ambitious GHG emission reductions, build resilience to climate impacts, and ensure inclusive and diverse access to services. This Element explores infrastructure planning concepts like circularity, decentralization, and integration and emphasizes the need for equitable, resilient systems designed according to future climate projections.
8. Nature-Based Solutions: Enhancing Capacity to Respond to Shocks and Stresses
There is a growing acknowledgment that a disproportionate amount of attention and finance is invested in hard infrastructure to mitigate and adapt to climate change in cities. In contrast, soft infrastructure, that is, the use of natural features and processes, has been comparatively overlooked until recently. This Element assesses the ways that nature-based solutions (NbS) – such as reforestation, urban parks, street trees, sustainable urban drainage systems, and community gardens – can enhance the capacity of cities to reduce GHG emissions and enhance resilience to climate stresses.
9. Circular Economies for Cities
Circularity has the potential to transform cities and city systems in both the Global North and the Global South. Sustainable consumption and production, life cycle analysis, and supply and demand factors are increasingly coming into focus in cities. This Element discusses the linkages of circular economics to climate action planning, the water–energy–food system nexus, and just, local development.
10. Data and the Role of Technology
Over the past decade, changes in internet penetration and the development of new information and communication technologies have catalyzed an ecosystem of approaches that employ “big data” and “smart tools” to support adaptation and mitigation. Artificial intelligence and machine learning play a large role in this new technological ecosystem. This Element evaluates the opportunities and challenges for cities as they employ these new technologies and evaluate emerging tools for their utility in climate change responses.
11. Perception, Communication, and Behavior
This Element explores the latest research on how urban residents perceive climate change so that effectiveness of actions can be improved. An important corollary to this is the role that communication plays in how mitigation and adaptation actions are adopted by cities. In the event of a climate disaster, the way that cities communicate has a direct effect on residents’ perception of risks and subsequent behaviors such as evacuation or strategic relocation. The Element addresses how behaviors by urban inhabitants can be encouraged to change mobility patterns and energy use in order to reduce GHG emissions, while simultaneously helping citizens to prepare for increasing climate extremes.
12. Health and Well-Being
Climate change, especially increasing extreme events, are exacerbating the risks of mortality, disease, injury, and impacts on physical and mental health and well-being in many cities. Climate change also has indirect impacts on health through disruptions in food supply and water availability. This Element assesses the latest findings on all aspects of the intersection of health and climate change for urban residents – including how urban built form, such as the presence of natural spaces – influences health and well-being under changing climate conditions.
ARC3.3 Major Findings and Key Messages
Besides the basic assessment content, each Element includes a statement of Major Findings and Key Messages. The Major Findings includes statements of significant new knowledge that emerged through the assessment process; Key Messages include recommendations for new ways forward, with a specific focus on opportunities to speed up and scale up urban climate action.
Cross-Cutting Themes
Cities are complex social-ecological-technological systems. While ARC3.3 is composed of twelve separate Elements, together they comprise multiple synergies, interdependencies, and points of intersection. To address these connections, each Element addresses its own selection of relevant cross-cutting themes (CCTs) (Figure 1). Figure 1 illustrates how significant recurring themes appear within the Element and the interlinkages to related Elements. Cross-cutting themes encompass such processes as drivers of urban function, change, and management; governance of cities across municipal, state/provincial, national, and international levels; and the role of city-level models and data.
Cross-cutting themes (CCTs) associated with the overall ARC3.3 assessment (middle) and the first six Elements and their CCTs.
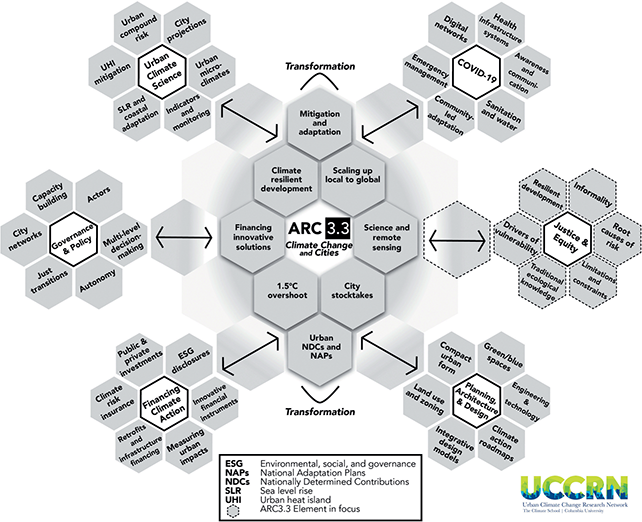
Since the fundamental contribution of the ARC3 series is to enable a learning process for urban climate action, CCTs across the ARC3.3 Elements aim to shed light on cause-and-effect relationships and elucidate effective entry points for interventions. This focused knowledge of urban social-ecological-technological systems can inform planners, implementers, and many other city actors as they undertake ways to translate the latest science into action in their own urban communities.
Foreword I – Sheela Patel, Founder Director, Society for the Promotion of Area Resource Centres (SPARC) Founder, Slum Dwellers InternationalGlobal Ambassador, Race to Resilience
The world turned urban over two decades ago, and over 55% of the global population now lives in large, medium, and small towns and cities, more so in southern countries and regions. Despite Sustainable Development Goal (SDG) 11, we have lost the critical point in decision-making, to address the challenges of today’s deficits to include informality and basic infrastructure through inclusive planning “norms.” This further creates an additional burden on those who live and work in cities as well as on those who migrate to cities due to extreme weather, destroyed habitats, and diminished livelihoods.
The challenge is to create a democratized knowledge base to identify the challenges that we face and to look at solutions we need universally that are inclusive, climate science-based, and accessible to all. Thus, the only way forward is to develop a process that will help all of us become much more resilient for the future. As cities around the world are experiencing increasing rates of informality, urban slums are facing the blunt force of climate change, frequently and intensely. Hundreds of millions of informal dwellers are grappling with the various challenges of unbearable heat, disastrous flooding, and damaging winds. Cities are also the location for climate migrants to seek refuge and are further densifying informal settlements. These communities are turning to locally led adaptation to make the necessary modifications with limited means and relief aid.
The ARC3.3’s Justice for Resilient Development in Climate-Stressed Cities Element provides vital information about the disproportionate impacts of climate events on marginalized urban populations and offers climate-resilient development strategies to address these pressing challenges. If we are to inclusively and justly come together, we would enhance the resilience of not just the cities’ most vulnerable and underserved groups, but also improve overall capabilities of cities. Informal settlements deserve equal access to clean water, proper sanitation, fair health care, quality education, and safe transportation. The people living in informal settlements deserve the right to be heard. We must interweave the needs and perspectives of the informal into our urban climate change solutions so that justice and equality can be at the core of the cities of tomorrow.
Foreword II – Eddie Bautista, Executive Director, New York City Environmental Justice Alliance Visiting Assistant Professor, Pratt Institute Graduate Center for Planning and the Environment
We’ve often heard the refrain “climate change will affect everyone, but its impacts won’t be evenly felt.” Nowhere is that observation more obvious, more quantifiable – yet more maddening – than in cities. The disparities of climate impacts in cities are observable and actionable.
Unfortunately, climate impact disparities in cities are insufficiently addressed by municipal governments – even by Global North cities like New York City. Here are a few examples of the climate environmental disparities in New York City.
Extreme heat disproportionately kills Black and Brown New Yorkers, with an estimated 370 New Yorkers dying annually because of heat-related or exacerbated illnesses. Heat-related mortality is expected to increase by 70% by 2050, with heat waves expected to triple.
Over half of public housing residents live in the most heat-vulnerable neighborhoods.
Communities of color have access to 33% less park space than residents in largely white neighborhoods – even though green infrastructure has proven cooling and air benefits.
In New York City, transportation represents 28% of GHG emissions. COVID-19 generated an explosion of e-commerce “last mile” delivery warehouses, attracting thousands of additional truck trips daily, significantly increasing air pollution in communities of color.
75% of the New York Metropolitan Transportation Authority’s twenty-eight bus depots are sited in communities of color. Yet despite these disproportionate traffic air burdens, Governor Hochul recently capriciously killed congestion pricing after years of planning.
Over 75% of New York City’s solid waste stream is trucked into a handful of communities of color.
A recent New York City Environmental Justice Alliance report revealed that hyperlocal air quality measurements in some communities of color showed levels of PM2.5 pollution up to eighteen-times greater and forty–nine-times greater than the nearest government-run monitors that report hourly values.
Of the four dimensions of urban climate justice presented in this Element (distributive, recognitional, procedural, and restorative), the most common and easily manipulated is procedural. For transformative urban climate justice to emerge, policymakers would be well served to read this Element and learn more comprehensive – and multidimensional – approaches.
Series Editors’ Introduction to Justice for Resilient Development in Climate-Stressed Cities
Justice for Resilient Development in Climate-Stressed Cities is the second Element in the Urban Climate Change Research Network’s (UCCRN’s) Third Assessment Report on Climate Change and Cities (ARC3.3).Footnote † It addresses the crucial and ubiquitous exigency of justice, informality, and equity in climate-stressed cities, a foundational component to the entire ARC3.3 assessment. The Element provides critical evidence for the highly unequal distribution of climate impacts, vulnerabilities, and risks within and across cities. Global maps show how cities located in low latitudes are more exposed to climate risks and impacts than in high latitudes, due to the presence of greater proportions of informal settlements as well as more frequent climate extremes.
The Justice Element incorporates important recommendations for improving adaptation and mitigation planning in cities by recognizing rights of vulnerable groups and enhancing justice for climate-resilient development in cities. For example, it calls for including climate justice in the monitoring and evaluation of adaptation. The Justice Element presents the state of just urban adaptation and mitigation and provides a roadmap for how cities can ensure equitable transitions and transformations, concluding with a discussion of future research and constraints. The Element provides concrete ways to achieve equitable and just urban transformations for climate-resilient development.
While many cities are successfully implementing measures to reduce emissions and enhance sustainability, there is an increasing awareness that these efforts may inadvertently exacerbate energy poverty and existing inequalities, especially given that the contribution of certain groups to greenhouse gas emissions is low. There is an increasing interest in equity dimensions of low carbon transitions and decarbonization as they influence development and informality, both positively and negatively.
To successfully scale up and speed up, urban transformational approaches should address the root causes of risk that engage with the drivers of vulnerability including an engagement with issues of power, justice, and agency. The Justice Element issues a call to action for cities to conceptualize the “just” in just urban transformations by embedding equity implications in all climate actions. These approaches need to endure over long time periods and bridge multiple spatial scales. For an initiative to be transformational and improve the conditions under which justice can be realized, it should be significant in depth, scale, and speed, that is, affect a significant number of residents, work across governance scales, use innovation, and be rapidly implementable. The goal is to catalyze a “domino effect” that links city transformations in any one city with many others. Urban transformations of societal development in urban areas are seen as more and more needed to move away from increased unsustainable and unjust practices that result in high emissions, heightened risks of climate change, and inequity.
Major Findings and Key Messages
Major Findings
1. Analysis of EM-DAT,Footnote 4 the International Disaster Database, reveals that riverine floods, extreme heat waves, and landslides are associated with most deaths due to environmental disasters (33%, 33%, and 22% of deaths, respectively) in cities. Fatalities due to heat waves and landslides are a particularly concern for urban justice. Heat risk in cities is exacerbated by the phenomenon called the Urban Heat Island (UHI) effect. However, it is important to assess hazards not only in terms of death, but also by way of other damage categories (e.g., impacts such as injured, homeless, or otherwise affected people, or monetary damage). Hazards that cause the largest number of impacted people in cities are cold waves and droughts (42% and 39% of all people, respectively) (Section 2.6).
2. On a global level, current climate impacts and risks across cities are distributed highly unequally. Cities located in low latitudes are more vulnerable to climate risks and impacts than in high latitudes, mainly due to the large proportion of informal settlements relative to the entire housing stock and the interaction with climate extremes. Differential access to infrastructure, services, and safe housing, particularly in cities in the Global South and within those in low-income communities, entail an increase in climate risks. Particularly hot areas coincide with large urban informal settlement populations in cities in West and Southwest Africa, the Gulf Coast and the Horn of Africa, the Middle East, and Central and South America. Populations in these cities are currently and in the near term at particular risk of impacts from heat and heat extremes (Sections 2.1, 2.2).
3. In the future, climate change is expected to exacerbate urban inequalities and injustices in as well as across cities, on both national and international levels, and mostly in cities of the Global South. Increasing climate extremes (e.g., heat waves, high precipitation events, and coastal storms) heighten risks in many cities; for example, more frequent heavy downpours are projected to intersect with risk of landslides in informal urban settlements. Including scenarios of future warming, increasing humidity and rapid population growth, most people at risk of deadly heat live in Subsaharan Africa and India. For Northern India and Pakistan, a high risk of death due to flooding is also projected. For West Africa, heat extremes are causes for concern. Overall, urban residents of West African cities and cities in Northern India and Pakistan face the largest risk of climate impacts in the future (Sections 2.2, 2.3, 2.4, 2.5, 2.6).
4. Within cities, human vulnerability intersects with hazardous locations and underserved areas and leads to specific populations with extremely heightened vulnerability (to increasing extreme heat, heavy downpours, and coastal flooding) such as women, single parents, and lonely elderly in low-income housing. Women living in urban informal settlements fall at the intersection of both social and economic inequality, which makes them one of the most exposed and vulnerable groups to climate risks. Sociocultural norms further restrict their access to (already) limited available resources. This is where distributive (in)justice, recognitional (in)justice, and procedural (in)justice overlap (Sections 1.1, 3).
5. Justice is increasingly considered in public adaptation planning and policy fora, mostly focused on distributive justice with particular attention to how climate change impacts are differentiated across social strata, economic assets, or geographical space. In addition, planning and policy documents are beginning to consider procedural justice (i.e., how civil society stakeholders are engaged in planning and implementation processes). The majority of cities where sufficient data of a representative sample are available fall short in focusing adaptation actions and measures on vulnerable populations and in aligning monitoring and evaluation systems to integrate the needs of the most vulnerable. When implemented, policy measures target reducing the impacts on economic assets instead of impacts on vulnerable populations. Furthermore, apart from a few progressive cities, recognitional and restorative justice are rarely addressed in adaptation processes (Section 4.2).
6. Planned relocation programs are being implemented in some cities, though relocation from exposed areas mainly takes place autonomously without support from the public authorities. Programs are often concentrated in more affluent areas. Planned relocation programs can compensate for climate impacts but can have justice implications. There is evidence that these programs often occur in economically more affluent neighborhoods, thus overlooking more vulnerable ones. Particularly in the Global South, cases of Lagos and Metro-Manila show that some relocation programs have been forced, resulting in great social costs to the residents, whose rights are often not considered. The societal costs of planned relocation can exceed relocation benefits, though these estimates are often drawn from econometric modeling rather than calculated costs (Sections 2.4, 4.2).
Key Messages
1. Adaptation and mitigation planning can cater to justice aspirations by recognizing the benefits and burdens of climate actions, increasing procedural justice of vulnerable groups, and including justice considerations in the monitoring and evaluation of adaptation. Adaptation planning predominantly accounts for distributive and procedural justice, meaning that some cities identify who is disproportionately affected by climate change impacts through vulnerability and risk assessments and pay attention to engagement of various stakeholders in adaptation planning. The other two dimensions of justice, recognitional and restorative, are less considered in city adaptation plans.
2. While many cities are successfully implementing measures to reduce emissions and enhance sustainability, there is an increasing awareness that these efforts may inadvertently exacerbate energy poverty and existing inequalities, especially given that the contribution of vulnerable social groups to emissions is low. Cities’ mitigation policies target electrification of mobility systems, promotion of solar power uptake for business and households, increased use of sustainable biomass and nature-based solutions (NbS). There is evidence that urban green spaces tend to disproportionately favor predominantly white and more affluent communities, resulting in highly stratified access within cities based on income, ethnoracial characteristics, gender, age, and (dis)abilities. Opportunities for equitable development of mitigation solutions need to expand to embrace vulnerability and informality by scaling up emerging technologies, pathways, and economic systems.
3. Transformations of societal development patterns are seen as needed to move away from unsustainable practices that result in high emissions and heightened risks of climate change. Scaling up transformations is critically important for climate-resilient development. However, to date, there is very little empirical documentation of justice implications of transformations. For an initiative to be transformational and to improve the conditions under which justice can be realized, it should be significant in depth, scale, and/or speed (i.e., affect a large number of people, should work across scales, and/or be implemented fast). Conceptualizing the “just” in just urban transformations means considering what equity implications transformations might have and in what ways transformation processes affect the rights of those involved, negatively or positively.
4. An empirical evidence gap exists regarding the justice implications from private-sector urban climate adaptation and mitigation. Overall, much of the documented adaptation and mitigation in urban areas is planned and implemented by the public sector, with much of the adaptation actions taken by individuals and the private sector remaining unaccounted for. This lack of empirical knowledge means that it is not certain how the burden and benefits of adaptation and mitigation are distributed in cities.
1 Framing Urban Justice with Equity, Informality, and Development in the Changing Climate
This ARC3.3 Element examines climate risks and responses in urban areas through the prisms of equity, justice, and informality for climate-resilient development. We recognize that the way in which climate risks emerge and are being responded to in cities are conditioned by the informality of existing social fabrics, institutions, and activities, and by the inequitable distribution of impacts, decision-making, and outcomes. To ensure climate-resilient development, climate responses by public and private urban institutions and individuals – both adaptation and mitigation – need to be viewed in the broader urban context through the prisms of informality and justice. Scholarship on equity, justice, and fairness related to climate change in cities and urban areas, including a focus on informality and development, is highly dynamic, with deepening awareness of their importance.
Climate risks are complex, that is, they consist of hazard, exposure, and vulnerability, as well as the climate change response (Simpson et al., Reference Simpson, Mach, Constable, Hess, Hogarth, Howden, Lawrence, Lempert, Muccione, Mackey, New, O’Neill, Otto, Pörtner, Reisinger, Roberts, Schmidt, Seneviratne, Strongin and Trisos2021) (see Figure 2). Hazards occur due to natural variation and anthropogenic climate change. Exposure is defined as the nature and degree to which a system is exposed to significant climatic variation. Vulnerability is the degree to which a system is susceptible to, or unable to cope with, adverse effects of climate change, including climate variability and extremes (IPCC, Reference Pörtner, Roberts, Tignor, Poloczanska, Mintenbeck, Alegría, Craig, Langsdorf, Löschke, Möller, Okem and Rama2022a). A response is any action taken in anticipation of current or future climate change, including adaptation and mitigation. Hazard, vulnerability, and exposure interact with responses, both mitigation and adaptation, that may lead to a change in risk with either negative or positive outcomes (Simpson et al., Reference Simpson, Mach, Constable, Hess, Hogarth, Howden, Lawrence, Lempert, Muccione, Mackey, New, O’Neill, Otto, Pörtner, Reisinger, Roberts, Schmidt, Seneviratne, Strongin and Trisos2021).
Placing justice, development, and informality in the context of climate risk, adaptation, and mitigation.
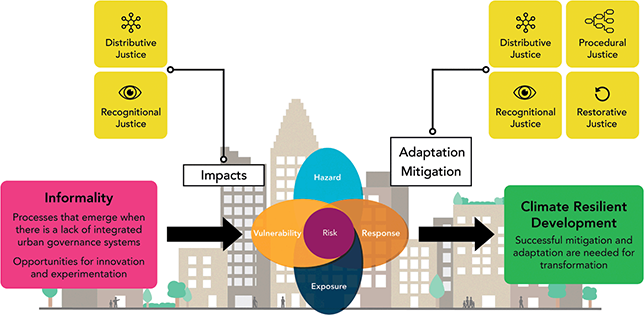
Exposure and vulnerability are features of the socioecological and sociocultural system and their dynamics through which climate change are distributed (Janssen et al., Reference Janssen, Anderies and Ostrom2007). The positive or negative outcomes of adaptation or mitigation responses are conditioned by a consideration of mainly four equity and justice dimensions (see Box 1). Here, equity, justice, and fairness are used interchangeably, although differences exist, but these differences are not consistently applied across the literature (Reckien et al., Reference Reckien, Lwasa, Satterthwaite, McEvoy, Creutzig, Montgomery, Schensul, Balk, Khan, Rosenzweig, Solecki, Romero-Lankao, Mehrotra, Dhakal and Ibrahim2018a). We also note that there is an extensive body of literature on justice and equity, which links to many political considerations. See ARC3.2., Chapter 6 on equity, environmental justice, and urban climate change for a more detailed discussion (Rosenzweig et al., Reference Rosenzweig, Solecki, Romero-Lankao, Mehrotra, Dhakal and Ali Ibrahim2018).
Informality has been a contested concept, used in many academic fields with different connotations. In terms of economic development, “[I]nformality’ is a term used to describe the collection of firms, workers and activities that operate outside the legal and regulatory system” (Loayza, Reference Loayza2016, p. 1). Further, it has either been viewed as pent-up economic potential or a hindrance to economic development (la Porta & Shleifer, Reference la Porta and Shleifer2014; Ulyssea, Reference Ulyssea2020). In the urban context, informality – in its wide range of features and levels – is often defined by what it is not – that is, in a spatial sense and in accordance with permit requirements, urbanization, and building codes (informal settlements and non-informal settlements), groups of people (labor), and governance (monitoring, naming, and intervening), as well as formal and informal practices (McFarlane, Reference McFarlane2012).
Multiple dimensions and factors that promote informality, namely inequality, physically shape the urban territory, resulting in segregated spaces in certain cases. A tendency exists to associate informality with marginality in a negative sense. However, informal urban areas are increasingly understood as a particular dynamic of urbanization with positive attributes, which still require robust efforts for effective inclusion in the official/governmental system of planning and governance (Alfaro d’Alençon et al., Reference Alfaro d’Alençon, Smith, Álvarez de Andrés, Cabrera, Fokdal, Lombard, Mazzolini, Michelutti, Moretto and Spire2018). The association with a condition of marginality can often have perverse consequences, particularly in the intersection with the distribution of power and decision-making processes (Alfaro d’Alençon et al., Reference Alfaro d’Alençon, Smith, Álvarez de Andrés, Cabrera, Fokdal, Lombard, Mazzolini, Michelutti, Moretto and Spire2018). Thus far, literature shows that the role of climate adaptation and mitigation in the upgrading of informal settlements has been ignored.
There are nevertheless cases in Latin America, for example, where adaptation and mitigation have contributed to security of land tenure, enabled relocation from exposed areas, improved land management practices, provided public spaces and energy efficient housing, and enhanced connectivity for those living in informal settlements (Collado & Wang, Reference Collado and Wang2020). While the issue of informal settlements has been gaining traction in recent years, more action by municipalities and governments must be taken to fully address this issue.
Here, we define informality as a characteristic of processes and systems that have emerged where there is inadequacy or lack of formal systems of urban governance, often, but not in all cases, creating opportunities for innovation and experimentation. Informality cuts across climate risk and development, conditioning the way in which climate risk emerges and how it can be responded to. Informality permeates all dimensions of the urban system, including physical infrastructure, institutional procedures, economy, housing, and land use in many cities across the globe. For example, informality in housing (i.e., populations living in urban informal settlements) is a widespread phenomenon, particularly in cities of low- and middle-income countries, characterized by lack of land tenure, lack of ownership, and access to basic infrastructure. Informality affects and shapes vulnerability (how vulnerable people are) and exposure (where vulnerable people live) and their ability to respond (conditioned by informal and formal institutions). However, informality can also be a positive force through which opportunities emerge for expanding possibilities for complementarity and leapfrogging the path dependencies in urban systems.
Development in this framework can be understood as the objective of responses leading whereby both adaptation and mitigation are needed to secure the achievement of the Sustainable Development Goals (SDGs) (Schipper et al., Reference Schipper, Revi, Preston, Carr, Eriksen, Fernandez-Carril, Glavovic, Hilmi, Ley, Mukerji, Muylaert de Araujo, Perez, Rose, Singh, Pörtner, Roberts, Tignor, Poloczanska, Mintenbeck, Alegría, Craig, Langsdorf, Möller, Okem and Rama2022). In this vein, both adaptation and mitigation need to be integrated into climate-resilient development processes.
Values of equity, justice, equality, engagement, common good, and sustainability come together as central elements of transformational adaptation and mitigation (Moser et al., Reference Moser, Aldunce, Rudnick, Rojas and Muñoz2019). Transformations of current societal development patterns are seen as increasingly needed to move away from continued unsustainability and GHG emissions toward a “positive trajectory where society acts rapidly to avoid deepening vulnerability, uncontrollable impacts and extensive, even existential losses” (Moser et al., Reference Moser, Aldunce, Rudnick, Rojas and Muñoz2019, p. 1).
In the following sections, this Element discusses dimensions for urban climate justice in detail and connects those to findings from ARC3.2 and other cross-cutting topics within the broader literature.
Section 2 reports on differential exposure, highlighting impacts and risks by hazard type (in and across cities), and urban and rural areas.
Section 3 focuses on differential vulnerability, synthesizing the evidence on drivers of vulnerability and intersectionality in cities.
Section 4 presents the state of adaptation and equity, development, and informality in cities, spotlighting urban adaptation planning and implementation and their implications for justice and equity in an urban world.
Section 5 explores similar aspects related to mitigation that is, mitigation planning and implementation in cities to date as well as their justice and equity implications.
Section 6 assesses relevant knowledge on equitable urban transitions and transformations, in which the Element provides recommendations for needed changes of the urban fabric, infrastructure, and processes of governance for a more equitable and just urban world and toward climate-resilient development.
Section 7 identifies existing constraints and pathways for future research.
The Conclusion highlights key findings regarding distributive, procedural, recognitional, and restorative justice in climate-stressed cities around the world.
1.1 Dimensions of Urban Climate Justice
This section introduces key terminology and a conceptual understanding of equity and justice dimensions in relation to climate change. Equity and justice in climate-stressed cities relate to at least four dimensions: distributive, recognitional, procedural, and restorative justice (see Box 1). Distributive justice refers to the distribution of impacts, risks, costs, and benefits of adaptation and mitigation in cities. If no social group faces an unjust burden of climate impacts, climate risks, costs, or unjust gain in benefits of urban adaptation and mitigation, it is termed distributive justice in cities. Recognitional justice means that all city dwellers ought to be recognized as worthy of being considered in impact and vulnerability studies and societal decision-making on adaptation and mitigation. Procedural justice is strongly connected to recognitional justice and indicates that all groups in society ought to be included in the adaptation and mitigation process with fair decision-making power. Recent work is bringing to the fore a way to use the response to climate risk, that is, mitigation or adaptation to restore past injustices and alleviate existing injustices in cities. This is called restorative justice.
|
|
|
|
1.2 Main Findings from ARC3.2 and Applications to ARC3.3
The previous Assessment Report on Climate Change and Cities (ARC3.2) Chapter 6 on Equity, Environmental Justice, and Urban Climate Change stressed how injustices in society mediate how people experience climate change impacts, but also their ability to mitigate emissions and adapt to impacts and risks (Reckien et al., Reference Reckien, Lwasa, Satterthwaite, McEvoy, Creutzig, Montgomery, Schensul, Balk, Khan, Rosenzweig, Solecki, Romero-Lankao, Mehrotra, Dhakal and Ibrahim2018a). As its main outcomes, ARC3.2 found that differential experiences and vulnerability to climate change in cities are driven by four factors: (1) differing levels of physical exposure determined by the location of residential/occupational areas; (2) urban development processes that lead to unequal and increasing risks, such as failure to provide access to critical infrastructure and services; (3) underlying social characteristics that influence resources and capacities for adaptation (in terms of people and institutions); and (4) institutional and governance shortcomings such as ineffective short-term planning, lack of flexible adaptive governance, and inadequate or token community engagement.
ARC3.2 concluded that urban climate policies would be more effective if they include equity and environmental justice as primary long-term goals. Equity cultivates human well-being, social capital, and sustainable social and economic urban development, all of which increase cities’ capacity to manage climate change. Access to land situated in nonvulnerable locations, security of tenure, and availability of basic services and risk-reducing infrastructure are particularly important.
ARC3.3 revisits these conclusions by assessing the most recent climate change literature on equity and environmental justice in cities, while adding the lens of informality. Justice for Resilient Development in Climate-Stressed Cities highlights the increasing opportunities for expansion of possibilities to complement or leapfrog path-dependencies as the strategic objective and combines development, adaptation, and mitigation in the notion of climate-resilient development.
1.3 Cross-Cutting Themes
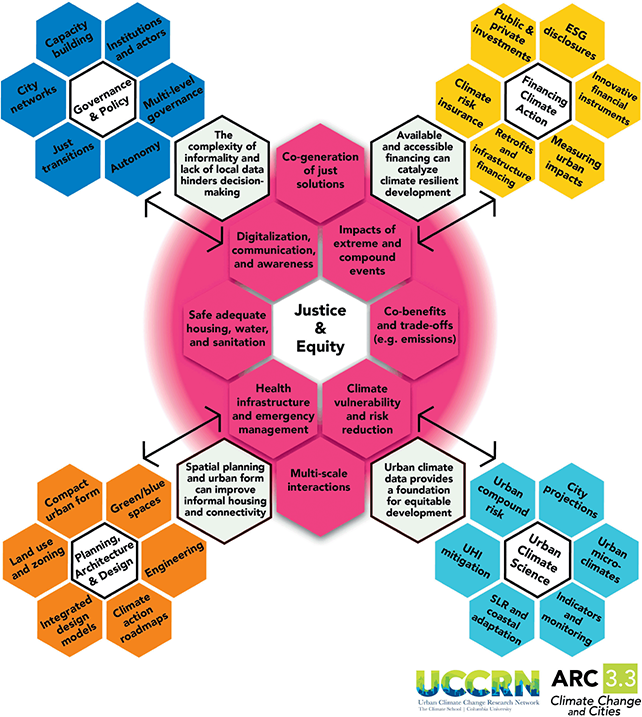
The Element thematically connects with several ARC3.3 Elements on multilevel governance, equitable access to finance, urban planning, and data and risk analyses (see Figure 3). Informality is often a characteristic of weak urban governance. Equitable access to finance can catalyze climate-resilient development. Urban climate data provide the foundation for equitable development, and urban planning can have a positive impact on connectivity and informal housing.
Cross-cutting themes indicate how Justice for Resilient Development in Climate-Stressed Cities interlinks with other ARC3.3 Elements. The four light gray boxes contain key connections.
2 Differential Exposure: Risks and Impacts by Hazard Type
A wealth of information is available on the differential exposure of urban residents and infrastructure to climate hazards (Dodman et al., Reference Dodman, Hayward, Pelling, Castán Broto, Chow, Chu, Dawson, Khirfan, McPhearson, Prakash, Zheng, Ziervogel, Pörtner, Roberts, Tignor, Poloczanska, Mintenbeck, Alegría, Craig, Langsdorf, Löschke, Möller, Okem and Rama2022). Cities are especially exposed to climate hazards as they are often located along rivers and on the coast as part of trade routes and because they rely on an aggregation of structures and populations (Smith & Lobo, Reference Smith and Lobo2019). The urban environment also influences the emergence and severity of impacts on human health, particularly those that are indirect and deferred (Jurgilevich et al., Reference Jurgilevich, Käyhkö, Räsänen, Pörsti, Lagström, Käyhkö and Juhola2023). Here, we assess exposure with a focus on the main hazards for cities: (1) temperature, heat, and heat waves; (2) precipitation and inland flooding; (3) sea level rise, including coastal flooding; (4) droughts; and (5) landslides.
We concentrate on the differential exposure between and within cities of different world regions and income status, that is, inter- and intra-urban differential exposure. Inter-urban exposure differs based on a city’s location, such as whether it is coastal versus inland; at a river or shoreline versus not; experiencing growth in hazardous conditions; and also on how its urban growth rate compares to cities around the globe. Intra-urban exposure is conditioned by the density of physical and social structures, the urban fabric (e.g., high-rise versus low-rise; the ratio of built to the unbuilt area; degree of impervious surfaces; infrastructure provision; building types/housing material/housing conditions); types of livelihoods people are engaged in (e.g., outdoor workers exposed to heat waves); and zonation status (i.e., informal versus formal classified settlements).
Climate risks and impacts in cities manifest through differential exposure and vulnerability, mostly related to distributive justice (Figure 2). However, distributive justice is influenced by recognitional and procedural justice exerted in the past. Central questions include: How is climate risk spatially distributed in cities; what is the differential exposure of people and places per hazard type; who is experiencing an unequal burden of climate risk in cities; and who is particularly vulnerable to climate impacts? This section contains evidence that responds to these questions.
2.1 Rising Temperatures and Heat Waves
Current temperatures and temperature extremes are distributed differentially across the globe. Presently, about 30% of the world’s population is exposed to deadly heat and humidity conditions for more than twenty days per year (Mora et al., Reference Mora, Dousset, Caldwell, Powell, Geronimo, Bielecki, Counsell, Dietrich, Johnston, Louis, Lucas, McKenzie, Shea, Tseng, Giambelluca, Leon, Hawkins and Trauernicht2017). Between 2021 and 2040, low latitudes are projected to show a disproportionate increase of deadly heat under the SSP5-8.5 global warming scenario (Figure 4). Cities located in low latitudes are more exposed to deadly heat than in high latitudes, despite larger observed and projected warming of higher latitudes (Mora et al., Reference Mora, Dousset, Caldwell, Powell, Geronimo, Bielecki, Counsell, Dietrich, Johnston, Louis, Lucas, McKenzie, Shea, Tseng, Giambelluca, Leon, Hawkins and Trauernicht2017). Such conditions are expected to increase with climate change particularly in the tropics. This is because cities in the tropics are already warm and relatively humid, and need less temperature increase to become deadly. For example, in India, twenty-four urban centers are projected to surpass average summertime highs of at least 35°C by 2050 (Ravindra et al., Reference Ravindra, Bhardwaj, Ram, Goyal, Singh, Venkataraman, Bhan, Sokhi and Mor2024). Based on scenarios of population growth, most people at risk of heat and heat waves in the future will live in Subsaharan Africa and India (UN-Habitat, 2016).
UN-reported informal areas using a twenty-five-mile radius. Change in number of extreme hot days in the near future (2021–2040) relative to 1995–2014 using scenario SSP5-8.5.
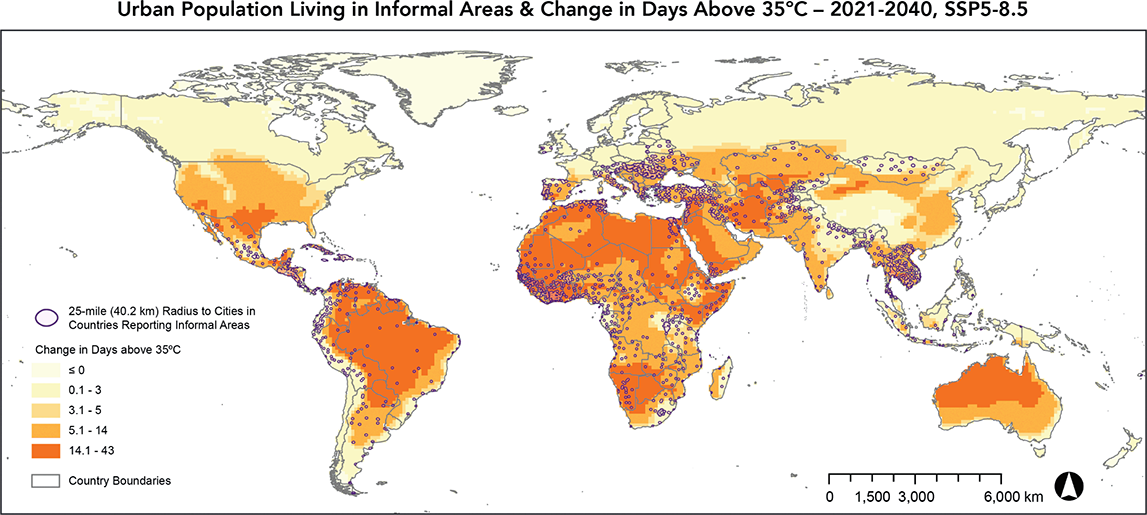
The global scale shows that particularly hot areas coincide with large urban informal settlement populations in cities in Western and Southwestern Africa, the Gulf Coast and the Horn of Africa, and cities of the Middle East and central South America. Populations in these cities will be at particular risk of heat and heat extremes.
Heat risk in cities is exacerbated by the phenomenon called the urban heat island effect – the formation of urban heat domes caused by intensified anthropogenic heat emissions, greater absorption of solar energy as part of urban infrastructure, reduced evaporative cooling, increased surface roughness, lower albedos, and narrow urban canyon geometry in citiesFootnote 5 (Debbage & Shepherd, Reference Debbage and Shepherd2015; Bader et al., Reference Bader, Blake, Grimm, Hamdi, Kim, Horton, Rosenzweig, Rosenzweig, Solecki, Romero-Lankao, Mehrotra, Dhakal and Ibrahim2018). The UHI is highly influenced by the contiguity of an urban area, and within contiguous areas, by density and extent of buildings and structures (Debbage & Shepherd, Reference Debbage and Shepherd2015). In highly built-up cities, the UHI ranges from a few degrees (e.g., for Padua, Italy [Pappalardo et al., Reference Pappalardo, Zanetti and Todeschi2023]) to up to more than 10°C and close to 20°C in Tokyo and New York City (see Figure 5). In the Global South, the UHI can reach 2–4°C in Cairo (Robaa, Reference Robaa2011), 2.74°C in Dhaka, 1.92°C in Chittagong (Dewan et al., Reference Dewan, Kiselev and Botje2021), and 2.44 °C in Kendari (Shaw et al., Reference Shaw, Luo, Cheong, Abdul Halim, Chaturvedi, Hashizume, Insarov, Ishikawa, Jafari, Kitoh, Pulhin, Singh, Vasant, Zhang, Pörtner, Roberts, Tignor, Poloczanska, Mintenbeck, Alegría, Craig, Langsdorf, Löschke, Möller, Okem and Rama2022).
Warm-season three-day surface UHI maximum (2003–2020) (SUHI18y) for all urban pixels in the functional urban areasFootnote 6 for the fourteen world megacities.Footnote 7
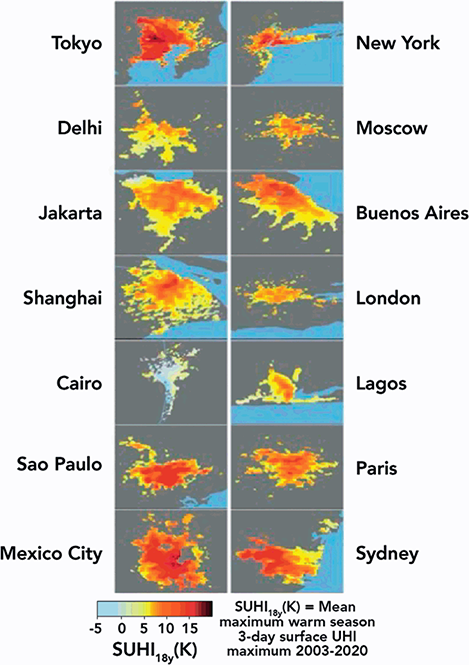
Moreover, heat risk is diffused and varies across intra-urban space. Due to location characteristics (e.g., the amount of green space versus impervious surfaces; proximity to a water body) and building stock characteristics (e.g., availability of air conditioning or thick walls) – and the combination of these – certain areas of a city are hotter than others (Kotharkar & Bagade, Reference Kotharkar and Bagade2018). Global assessments of long-term high-resolution daytime surface UHI find that intra-urban hotspots can have surface UHI intensity of up to 10–18 K higher compared to relatively cooler city parts (Mentaschi et al., Reference Mentaschi, Duveiller, Zulian, Corbane, Pesaresi, Maes, Stocchino and Feyen2022) (see Figure 5).
Studies have investigated the exposure of informal areas and poor urban areas to climate change, many of which have focused on temperature-related issues including temperature variation, extreme heat, and heat waves (Borg et al., Reference Borg, Greibe Andersen, Karekezi, Yonga, Furu, Kallestrup and Kraef2021). Informal areas are specifically prone to UHI effects and increased heat due to their physical conditions of housing and infrastructure. The hyper density, lack of green spaces, and use of low albedo materials within informal settlements increase residents’ exposure to extreme heat. For example, uninsulated corrugated iron roofs and poor ventilation often present in informal settlement areas in the Global South contribute to increased heat stress, in turn increasing residents’ vulnerability to climate change–induced overheating and associated health hazards (Ehebrecht, Reference Ehebrecht2014; Satterthwaite et al., Reference Satterthwaite, Archer, Colenbrander, Dodman, Hardoy, Mitlin and Patel2020).
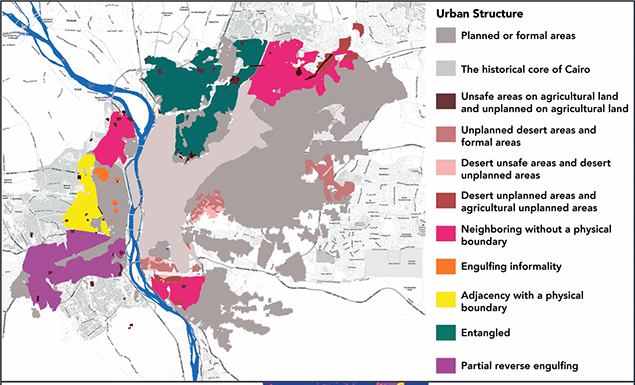
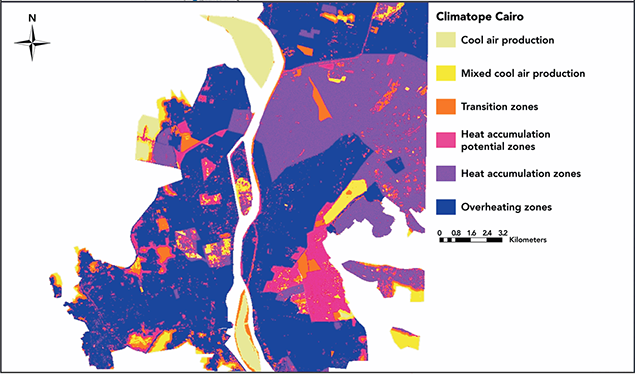
Developing urban climate maps can be a useful tool to identify the overheating characteristics of different parts of the city, including in informal areas (Ren et al., Reference Ren, Ng and Katzschner2011; Khalil et al., Reference Khalil, Ibrahim, Elgendy and Makhlouf2018). The climate map of the Greater Cairo Region (GCR) shows that most extreme heating zones coincide with the distribution of informal areas (Khalil et al., Reference Khalil, Ibrahim, Elgendy and Makhlouf2018) (see Case Study 1).
The Greater Cairo Region is the biggest arid zone worldwide suffering from increased heat stress due to both climate change–induced incidents as well as its own urban structure and development trends. With more than 60% of the city living in informal areas, the relation between formal and informal areas becomes pivotal in identifying needed interventions for climate resilience. The underlying absence of both distributive justice as well as recognitional justice is evident in the current everyday realities of the city inhabitants. The current urban heating risks faced by GCR are influenced by its urban structure, both formal and informal, and the increased vulnerabilities to climate change, particularly within informal areas. Further, the case study examines the resulting inequitable distribution of greenery within the city accentuated by a continuous diminishing of green spaces and increased distributive injustice. The climate map of the Greater Cairo Region shows that the majority of overheating zones coincide with the distribution of informal areas (Khalil et al., 2018). Greenery is often removed from informal areas to extend roads, and the remaining green spaces are being commodified into commercial spaces to generate revenue, depriving lower-income groups who cannot afford access to private clubs or ticketed gardens. Investigation of lack of greenery and its unjust distribution has a direct effect on the proliferation of physical and mental health issues among the most vulnerable groups within both formal and informal areas. Hence, any action toward climate resilience must consider environmental justice/equity with its four facets.
Patterns of formal/planned and informal/unplanned areas in the Greater Cairo Region, Egypt (Gad et al., Reference Gad, Attia and Khalil2022).
Climatopes in Cairo, with heat accumulation zones and overheating zones occurring in informal/unplanned areas, Geographic Information Systems (GIS) analysis (Khalil et al., Reference Khalil, Ibrahim, Elgendy and Makhlouf2018).
Heat impacts trigger several knock-on effects to water, health, food, and livelihoods. Higher water demand and limited water availability in turn impact agricultural production in peri-urban and rural areas and thus food provision in urban areas (Dodman et al., Reference Dodman, Archer and Satterthwaite2019). Agriculture and food-based livelihoods are threatened, and health impacts ensue. Health impacts of heat stress include heat-induced morbidity and mortality when temperature and humidity increases exceed thresholds that are city-dependent (Mora et al., Reference Mora, Dousset, Caldwell, Powell, Geronimo, Bielecki, Counsell, Dietrich, Johnston, Louis, Lucas, McKenzie, Shea, Tseng, Giambelluca, Leon, Hawkins and Trauernicht2017). Moreover, the decrease in cold days extends some disease vectors’ range and activity (e.g., mosquito and related tick-borne diseases [de Sherbinin et al., Reference de Sherbinin, Schiller and Pulsipher2007; Dodman et al., Reference Dodman, Archer and Satterthwaite2019]) (see additional resources and the ARC3.3 Health and Well-Being Element).
2.2 Precipitation and Inland Flooding
Across the globe precipitation patterns are changing, increasing the risk for inland flooding. Cities are at risk of inland flooding, in particular when they are located along rivers, in valleys, and on or at the bottom of steep slopes. Changes in the amount of annual precipitation across the world over the last fifty years are bi-directional and patchy with the frequency of extreme precipitation events often increasing (IPCC, Reference Masson-Delmotte, Zhai, Pirani, Connors, Péan, Berger, Caud, Chen, Goldfarb, Gomis, Huang, Leitzell, Lonnoy, Matthews, Maycock, Waterfield, Yelekçi, Yu and Zhou2021, Atlas figures 11e and 11f). Of 241 urban areas surveyed worldwide from 1973 to 2012, 17% encountered statistically significant increases in frequencies of extreme precipitation events (Mishra et al., Reference Mishra, Ganguly, Nijssen and Lettenmaier2015). Most of them are in South Asia and South America. Less than 5% of the cities studied showed a statistically significant decrease, some of them found in the Mediterranean and Eastern Europe, as well as Central Asia. However, some evidence shows that high-intensity short duration rainfall events also increase in areas with a decrease of total annual precipitation in the coming decades (IPCC, 2022b).
For cities, increases in precipitation and heavy rainfall can lead to flooding when the amount of rainwater exceeds carrying (natural or built drainage systems) and infiltration capacities. This is due to large areas in cities covered with impermeable surfaces such as roads and buildings and/or accumulation of rainwater in low-lying areas without storage or drainage capacities. Impacts of extreme precipitation events and flooding are exacerbated within informal residential areas because of their hyper-density and location in hazard areas. These are often associated with lower land value and lower likelihood of eviction (Satterthwaite et al., Reference Satterthwaite, Archer, Colenbrander, Dodman, Hardoy and Patel2018). In addition to location, the structure of informal housing contributes to exposure to flooding. Poor-quality housing, in absence of risk-reducing infrastructure, is less able to withstand flooding (Dodman et al., Reference Dodman, Archer and Satterthwaite2019).
Secondary impacts of precipitation and inland flooding comprise infrastructural interruptions as well as social and economic consequences, such as damages of energy supply, transport, information technology, urban services, and social infrastructure, potentially including damages or loss of property and disruption to livelihoods (Dodman et al., Reference Dodman, Archer and Satterthwaite2019). Secondary impacts extend from infrastructural interruptions and damages to social and economic services in cities, to causing health impacts including morbidity and mortality (Borg et al., Reference Borg, Greibe Andersen, Karekezi, Yonga, Furu, Kallestrup and Kraef2021). These can be brought about by mediators (e.g., water contamination and waterborne diseases), but also more directly through accidents with damaged energy and other infrastructure (Jurgilevich et al., Reference Jurgilevich, Käyhkö, Räsänen, Pörsti, Lagström, Käyhkö and Juhola2023). Several studies investigated the correlations between health impacts with flooding and increased precipitation and yield key associative relationships in the cities of Shashemene (Ethiopia) (Bambrick et al., Reference Bambrick, Moncada and Briguglio2015), Lima (Peru) (Contreras et al., Reference Contreras, Aguilar, Eappen, Guzmán, Carrasco, Millones and Galea2018), and Dhaka (Bangladesh) (Khan et al., Reference Khan, Gruebner and Krämer2014).
Deaths due to flooding are concentrated in Southeastern Africa (Mozambican and Zimbabwean cities), and along the slopes of the Andes in Western South America, but also in South Asia (Indian cities), and some parts of Western Africa (Namibian cities) and the Middle East (cities of Iraq and Syria) (EM-DAT, 2023). All these areas, apart from the slopes of the Andes, contain cities with a large population living in informal settlements and show substantial increases in daily precipitation. Hence, deaths due to flooding clearly relate to flood risk as a combination of the meteorological/climatological and the structural/housing conditions.
2.3 Extreme Rainfall and Landslides
Landslides are a particular threat to cities in hilly areas under climate change as they are conditioned by extreme rainfall and certain slope conditions such as slope stability and gradient (Foilleau et al., 2023; Marengo et al., Reference Marengo, Alcantara, Cunha, Seluchi, Nobre, Dolif, Goncalves, Assis Dias, Cuartas, Bender, Ramos, Mantovani, Alvalá and Moraes2023). Landslides occur as fast-moving and slow-moving phenomena, both strongly related to urban activities such as settlement, road building, housing, or storm drainage (Dille et al., Reference Dille, Dewitte, Handwerger, d’Oreye, Derauw, Ganza Bamulezi and Kervyn2022). In urban areas where demand for space and related pressure on land is high, areas with high landslide susceptibility are often used, legally or illegally, for housing, such as in Recife, Brazil (Marengo et al., Reference Marengo, Alcantara, Cunha, Seluchi, Nobre, Dolif, Goncalves, Assis Dias, Cuartas, Bender, Ramos, Mantovani, Alvalá and Moraes2023) or the Caribbean islands (Bozzolan et al., Reference Bozzolan, Holcombe, Pianosi, Marchesini, Alvioli and Wagener2023). A study in urban areas of the Caribbean islands shows that the landslide susceptibility rises by 40% considering past rainfall-intensive hurricanes plus illegal housing and informal settlements, compared with only 20 and 6%, respectively, when independently modelling the expansion of informal housing, deforestation, and rainstorms due to climate change (Bozzolan et al., Reference Bozzolan, Holcombe, Pianosi, Marchesini, Alvioli and Wagener2023).
Impacts of landslides, in particular fast-moving landslides, often cause a large number of human fatalities, such as in Italian cities (Franceschini et al., Reference Franceschini, Rosi, Del Soldato, Catani and Casagli2022; Esposito et al., Reference Esposito, Salvati and Bianchi2023), cities in the Andean mountains (Zambrano & Rey, Reference Zambrano and Rey2022; Marengo et al., Reference Marengo, Alcantara, Cunha, Seluchi, Nobre, Dolif, Goncalves, Assis Dias, Cuartas, Bender, Ramos, Mantovani, Alvalá and Moraes2023), Chinese cities (Huang et al., Reference Huang, Tang, Jiang, Liu, Chen and Huang2022; Wang et al., Reference Wang, Fleischmann, Venerandi, Kuffer and Porta2022), and South Asian cities (Mukherjee et al., Reference Mukherjee, Wickramasinghe, Chowdhooree, Chimi, Poudel, Mishra, Ali and Shaw2022). A review by Petrucci (Reference Petrucci2022) found that landslide fatalities worldwide are underestimated. While new landslide detection methods using machine learning promise better early warning, the continuing growth of settlements in mountainous areas and the associated reduction of forest area remain a concern in many hilly urban areas worldwide (Youseff et al., Reference Youssef, Shao, Moon and Bouchard2023).
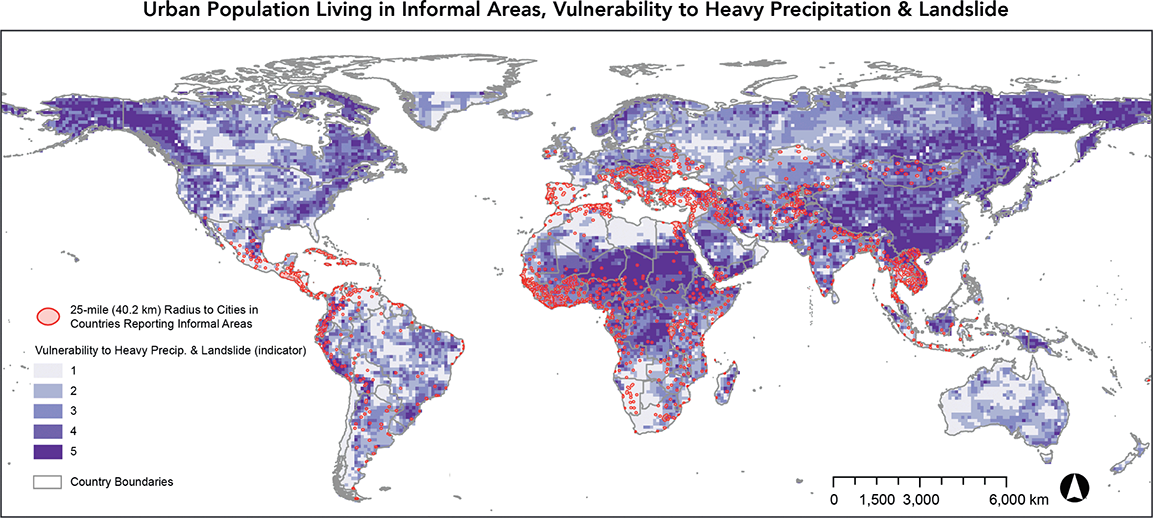
Figure 6 shows a global overview of the greatest susceptibility to heavy precipitation and consequent landslides along with large proportions of inhabitants living in informal settlements. Susceptible cities are found in the Andean and Himalayan region, in Tajikistan and Kyrgyzstan, along with areas of Northern Thailand, Laos, Myanmar, and Western China, in particular.
UN-reported informal areas using twenty-five-mile radius. Change in maximum five-day precipitation (mm) in the near future (2021–2040) relative to 1995–2014 using scenario SSP5-8.5. Landslide susceptibility combines Global Precipitation Measurement data with landscape observations: whether roads have been built, trees have been cut down or burned, a major tectonic fault is nearby, the local bedrock is weak, and/or the hillsides are steep. Vulnerability indicator multiples change in maximum five-day precipitation by landslide susceptibility for each grid cell and is classified by severity (1–5).
2.4 Sea Level Rise and Flooding in Coastal Cities
The rate of global mean sea level (GMSL) has increased from about 0.20 m between 1901 and 2018 to 3.7 mm/yr from 2006 to 2018 and is virtually certain to continue to rise throughout the twenty-first century – between another 0.18–0.23 m by 2050, and 0.38–0.77 m by 2100 (Fox-Kemper et al., Reference Fox-Kemper, Hewitt, Xiao, Aðalgeirsdóttir, Drijfhout, Edwards, Golledge, Hemer, Kopp, Krinner, Mix, Notz, Nowicki, Nurhati, Ruiz, Sallée, Slangen, Yu, Masson-Delmotte, Zhai, Pirani, Connors, Péan, Berger, Caud, Chen, Goldfarb, Gomis, Huang, Leitzell, Lonnoy, Matthews, Maycock, Waterfield, Yelekçi, Yu and Zhou2021; IPCC, Reference Masson-Delmotte, Zhai, Pirani, Connors, Péan, Berger, Caud, Chen, Goldfarb, Gomis, Huang, Leitzell, Lonnoy, Matthews, Maycock, Waterfield, Yelekçi, Yu and Zhou2021). This is due to anthropogenic climate change as well as natural and human-induced subsidence and other land water shortage changes (Frederikse et al., Reference Frederikse, Landerer, Caron, Adhikari, Parkes, Humphrey, Dangendorf, Hogarth, Zanna, Cheng and Wu2020; Cao et al., Reference Cao, Esteban, Valenzuela, Onuki, Takagi, Thao and Tsuchiya2021). Many coastal inhabitants are in subsiding locations and are therefore likely to experience an average relative sea level rise up to four times the global average, 7.8–9.9 mm/yr (Nicholls et al., Reference Nicholls, Lincke, Hinkel, Brown, Vafeidis, Meyssignac, Hanson, Merkens and Fang2021). See additional resources for more information on sea level rise, the quantity of urban populations it impacts, and cascading effects.
In general, more cities in the tropics are exposed to severe coastal flooding than those at higher latitudes, but not exclusively (Tebaldi et al., Reference Tebaldi, Ranasinghe, Vousdoukas, Rasmussen, Vega-Westhoff, Kirezci, Kopp, Sriver and Mentaschi2021). The top twenty cities with population exposed to coastal flooding in 2070 are spread across high-, middle- and low-income populations, including Kolkata, Mumbai, Dhaka, Guangzhou, Ho Chi Minh City, Shanghai, and many other cities in Asia. Outside of Asia, Miami (ranked 9), and Alexandria (ranked 11) were among the most vulnerable cities outside of Asia (Hansen et al., Reference Hansen, Sato, Kharecha and von Schuckmann2011). Ranking by exposed assets in 2070 puts Miami, Guangzhou, New York City, and Kolkata at the top of the vulnerability list globally (Hansen et al., Reference Hansen, Sato, Kharecha and von Schuckmann2011).
Effective coastal zone management is important in all these cities, but particularly in the cities of large deltas, flood plains, and low-elevation coastal zones in low- and middle-income countries, as the lowest parts of these cities are often inhabited by low-income populations (Nicholls, Reference Nicholls, Shroder, Ellis and Sherman2015). This is due to the availability of less expensive housing and land or space for informal settlements such as in the eastern Philippines city of Canumay (Cash, Reference Cash2021). In cities of high-income countries, a similar process has recently been observed – a wave of climate gentrification has set in. This means that more well-off urban residents are moving away from low-elevation areas to higher ground (Li & Grant, Reference Li and Grant2022). In Miami, wealthy and well-educated homeowners and buyers are relocating. However, this is mostly due to increases in flood insurance costs for lower-elevation plots and less because of increased awareness of vulnerable locations and projections of increased coastal flooding (Li & Grant, Reference Li and Grant2022). Often, lower-income people are in a less opportunistic situation and cannot move. In contrast, with falling housing prices, more middle- or even low-income households are moving into riskier areas when not prevented by coastal zoning policies (Sherwin, Reference Sherwin2019).
Sea level rise is associated with flood-related hazards and storm surges (Marcos et al., Reference Marcos, Chust, Jordà and Caballero2012; Fox-Kemper et al., Reference Fox-Kemper, Hewitt, Xiao, Aðalgeirsdóttir, Drijfhout, Edwards, Golledge, Hemer, Kopp, Krinner, Mix, Notz, Nowicki, Nurhati, Ruiz, Sallée, Slangen, Yu, Masson-Delmotte, Zhai, Pirani, Connors, Péan, Berger, Caud, Chen, Goldfarb, Gomis, Huang, Leitzell, Lonnoy, Matthews, Maycock, Waterfield, Yelekçi, Yu and Zhou2021, ch.9). Flood-related hazards are documented for the cities in the Pearl River Delta in China and other Asian deltaic megacities (Cao et al., Reference Cao, Esteban, Valenzuela, Onuki, Takagi, Thao and Tsuchiya2021). Many Asian deltaic cities are also subsiding, which will expand the area of the 100-year flood zone (Olson & Kreznor, Reference Olson and Kreznor2021).
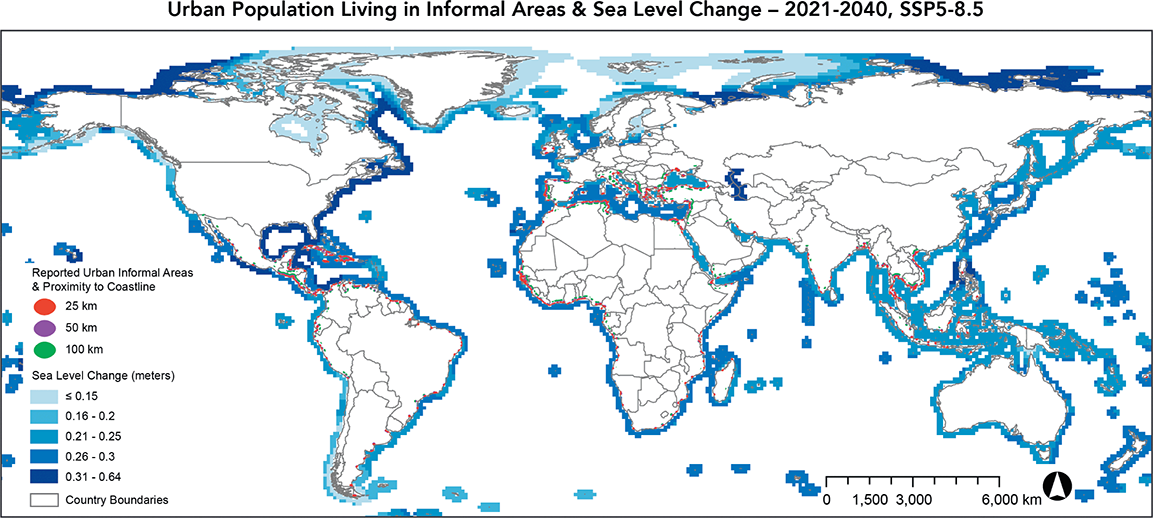
Figure 7 shows the change in sea level in the near future (2021–2040) and informal settlements in close proximity to coastlines. Singapore, cities of Malaysia and in Sumatra, Indonesia, as well as Central American cities in Guatemala and Ecuador as well as the Caribbean will all be most affected by sea level rise. The coasts along the Pacific and Atlantic Ocean of the United States, the Atlantic Ocean and Baltic Sea of Europe, the Mediterranean coasts of Italy and Gibraltar, and the North Pacific coasts of Japan are projected to also face large increases in centennial sea level rise events, but without large proportions of urban residents living in informal settlements.
UN-reported informal areas using twenty-five-mile radius. Informal areas are classified by proximity to coastline: 25 km, 50 km, and 100 km. Change in sea level in the near future (2021–2040) relative to 1995–2014 using scenario SSP5-8.5.
2.5 Droughts
Droughts in urban areas are not uniformly defined, often referring to “prolonged absence or marked deficiency of precipitation” or “dry conditions relative to normal” (Singh et al., Reference Singh, Jain, Sukhwani and Shaw2021). Drought is a phenomenon that impacts a wider region, not only a single urban center. Hence, drought impacts often affect entire urban regions or metropolitan areas with impact differentials based mainly on vulnerability and adaptive capacity, less on exposure and hazard.
Drought-related impacts of climate change are often discussed as a particularly rural phenomenon, with main impacts on agriculture and forests (Frank, Reference Frank2021). Drought has serious implications for urban residents, although drought in urban areas is not exclusively due to climate change, but also influenced by inequality and other social drivers, such as seen in Southern African cities, or in the 2014 drought that impacted São Paulo, Brazil, in which water scarcity exacerbated existing territorial inequalities and injustices (van Loon et al., Reference van Loon, Gleeson, Clark, van Dijk, Stahl, Hannaford, di Baldassarre, Teuling, Tallaksen, Uijlenhoet, Hannah, Sheffield, Svoboda, Verbeiren, Wagener, Rangecroft, Wanders and van Lanen2016; Millington, Reference Millington2018; Yuan et al., Reference Yuan, Wang and Wood2018). Drought is particularly severe for urban residents that are dependent on their hinterland for food, energy, and other resources through trickle-down effects, that is, secondary and tertiary impacts of drought on urban residents.
Overall, there is a pronounced gap in the literature on empirical and conceptual works on drought impacts in urban areas, particularly regarding impacts in nonagricultural contexts, such as energy and transport infrastructures, industry, and businesses (Singh et al., Reference Singh, Jain, Sukhwani and Shaw2021). Scenarios that explore drought in the context of socioeconomic development in Maputo indicate that future droughts in Southern Africa will probably polarize urban inequalities, cause localized public health crises, and revert improvements of water access (Rusca et al., Reference Rusca, Savelli, di Baldassarre, Biza and Messori2023). Drought in Asian megacities has been associated with severe water stress and related adaptation strategies varying by city, country, and context. For example, in the Indian city of Chennai and the Pakistani city of Karachi, water tankers are used that often use groundwater resources from likewise drought-stricken neighboring rural districts. This raises equity concerns related to the rural poor, women, and children who are responsible for water fetching in many low- and medium-income countries in Asia (Singh et al., Reference Singh, Jain, Sukhwani and Shaw2021).
Other secondary impacts of drought are related to food insecurity, morbidity, and mortality. Drought can foster infectious disease outbreaks, which are aggravated by high levels of inequality in relation to poor access to water, sanitation, and hygiene (Charnley et al., Reference Charnley, Kelman and Murray2022). In African cities, for example, the highest cholera burden globally coincides with several drought-prone regions and high levels of inequality (e.g., related to marginalization of refugees and nomadic populations, large informal areas, poor access to water, sanitation, and hygiene), ultimately leading to increased mortality levels during and post drought occurrences (Charnley et al., Reference Charnley, Kelman and Murray2022). Moreover, in thirteen major Brazilian macro-urban areas, drought positively influenced nonexternal, circulatory, and respiratory mortality from 2000 to 2019 (Salvador et al., Reference Salvador, Vicedo‐Cabrera, Libonati, Russo, Garcia, Belem, Gimeno and Nieto2022). In particular, females, the elderly, and children were affected, signified by a robust positive association, illustrating the inequity in experiencing drought impacts (Salvador et al., Reference Salvador, Vicedo‐Cabrera, Libonati, Russo, Garcia, Belem, Gimeno and Nieto2022).
However, with increasing global warming, tropical vector-borne diseases are also traveling toward higher latitudes (Adepoju et al., Reference Adepoju, Afinowi, Tauheed, Danazumi, Dibba, Balogun, Flore, Saidu, Ibrahim, Balogun and Balogun2023; Lovey & Schlagenhauf, Reference Lovey and Schlagenhauf2023). In the United States, an endemic outbreak of the West Nile Virus in 2012 was connected to a nationwide drought that same year (Brown & DeMaria, Reference Brown and DeMaria2012). Particularly, urban vectors such as dengue and chikungunya have been found to adapt to water adaptation infrastructure, especially due to the contraction of water resources during times of drought, that is, breeding in water storage containers (Brown & DeMaria, Reference Brown and DeMaria2012).
2.6 Comparative Risk Assessment
Previous sections have assessed the impacts of climate change and climate risk separately across hazards. However, how does a single city or a number of cities in a region fare when comparing across hazards? This depends on the risk metric used. For example, impacts vary depending on morbidity, mortality, economic damage, affectedness, or others. Using data from the EM-DAT and the International Disaster Database of the Centre for Research on the Epidemiology of Disasters (CRED), we present an overview of different risk metrics across hazards (see Figure 8). The EM-DAT database contains data on the occurrence and impacts of over 26,000 mass disasters worldwide from 1900 to the present day.
Disasters, monetary damages, affected people, and registered deaths for multiple climate hazards, 1980–2023. Left column is cities, and the right column is all geographies. Bars show data that include at least one city or one country. Detailed data description in additional resources.
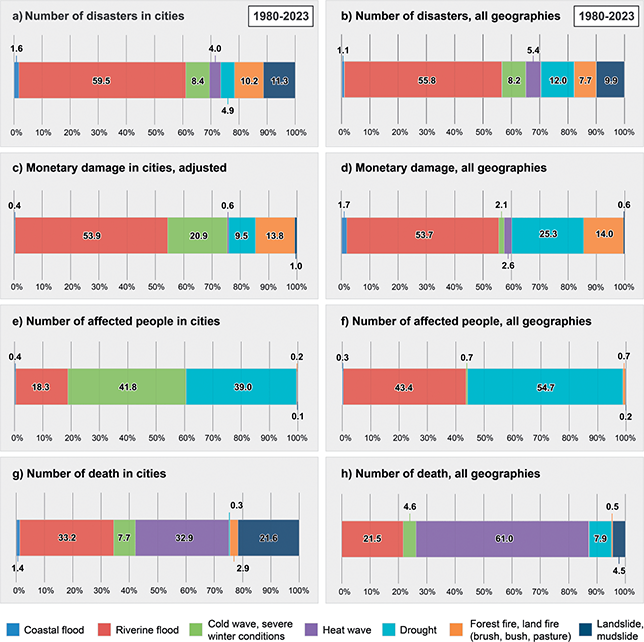
Figure 8 shows that riverine floods are by far the disasters most recorded in cities, as well as across all geographies. About 60% of all disasters in cities relate to riverine floods (Figure 8a). However, compared to all geographies, there are relatively more fires, landslides, and riverine floods recorded in cities (comparing Figures 8a and 8b). The dominance of riverine floods remains when looking at the metric of total monetary damage, for disasters in cities and all geographies. However, cold waves, drought, and fires cause relatively more monetary damage in cities than other disasters, as their monetary damage is larger than the relative number of disasters recorded.
Compared to all geographies, the large damage of cold waves in cities sticks out markedly (Figure 8c). Looking at the metric of number of affected people (Figure 8c), cold waves and droughts dominate the impact scale in cities. About 42% of all disaster-affected people in cities are associated with cold waves; 39% relate to drought. According to our assessment, the impacts of cold waves and droughts in cities in terms of injured, homeless, or otherwise affected people are highly underestimated.
Regarding number of deaths, however, riverine floods and heat waves gain in importance (Figure 8d). About 33% of disaster deaths in cities relate to each of these two hazards. In comparison to all geographies (Figure 8d), heat wave fatalities are not a particularly urban issue, but fatalities due to landslides are much more frequent in urban areas than elsewhere. Looking across the risk metric, the analysis shows that the case of heat waves and landslides is particularly important for cities and equity/justice issues, as these are disasters where medium occurrences, negligible economic damages, and small numbers of affected people occur, but with large numbers of deaths. In contrast, cold waves and droughts are recorded at medium levels and affect large numbers of people in cities, but only cause negligible, direct deaths.
3 Differential Vulnerability: Drivers of Vulnerability and Intersectionality
Urban socioeconomic systems and ecosystems are inextricably linked (Cinner & Barnes, Reference Cinner and Barnes2019). Increasing trends of urban inequality, precarious livelihoods, insufficient access to key infrastructure, and exclusionary decision-making processes coupled with the hazards associated with climate change can make populations highly vulnerable, as shown for example in the case of Ibadan, Nigeria (Adelekan et al., Reference Adelekan, Cartwright, Chow, Colenbrander, Dawson, Garschagen, Haasnoot, Hashizume, Klaus, Krishnaswamy, Lemos, Ley, McPhearson, Pelling, Kodira, Revi, Sara, Simpson, Singh, Solecki, Thomas and Trisos2022). Additionally, the COVID-19 pandemic has exposed even further the socioeconomic challenges of vulnerable communities.Footnote 9 While nobody is immune to the impacts of climate change, not all climate impacts are created and distributed equally. Marginalized, vulnerable communities often face disproportionate effects of climate change due to a range of social, economic, and environmental factors that depend on the level of sensitivity and adaptive capacity, which might differ with the type of hazard (Reckien & Petkova, Reference Reckien and Petkova2018).
In this section, we look at differential impacts of climate change on various social groups, their drivers, and interactions of drivers. In 2005, the UN report The Inequality Predicament sounded the alarm over how persistent and growing inequalities could impede the achievement of the Millennium Development Goals (MDGs). Nearly twenty years on, closing this divide is just as challenging, as the world is grappling with the same problems, even as we pledge to “Leave No One Behind” by 2030. As the SDGs have broadly replaced the MDGs, cities remain key to achieving the SDGs, as urban areas are the drivers of financial and technological growth, and socioeconomic opportunities. Studies have highlighted the impacts of climate change on women, old and young people, and low-income households (IPCC, Reference Pörtner, Roberts, Tignor, Poloczanska, Mintenbeck, Alegría, Craig, Langsdorf, Löschke, Möller, Okem and Rama2022a) (Table 1).
| Vulnerable group | Explanation | References |
|---|---|---|
| Women and girls | Vulnerability is gendered; access to resources and safe places may be restricted, particularly in dense cities with pressure on land; power inequalities in decision-making, although a more global lifestyle in cities might reduce gender hierarchies | Hunter et al. (Reference Hunter, Castro, Kleiber and Hutchens2016); Moreno & Shaw (Reference Moreno and Shaw2018); Rao et al. (Reference Rao, Lawson, Raditloaneng, Solomon and Angula2019); Haque (Reference Haque2020) |
| Age | Heat stress for children and elderly, exacerbated by the UHI; childhood exposure to pollutants, particularly in cities with high pollution rates; poor mobility to leave harm’s way | Anderko et al. (Reference Anderko, Chalupka, Du and Hauptman2020); Nakstad et al. (Reference Nakstad, Filippi, Lusambili, Roos, Scorgie, Chersich, Luchters and Kovats2022); Sahani et al. (Reference Sahani, Othman, Kwan, Juneng, Ibrahim, Hod, Zaini, Mustafa, Nnafie, Ching, Dambul, Varkkey, Phung, Mamood, Karim, Abu Bakar, Wahab, Zulfakar and Rosli2022) |
| Individuals and households living in poverty | Living in high-risk areas and neglected by official planning, particularly in cities where open space is rare; high cost of energy exacerbates poverty, particularly in cities where alternative sources of energy/heating are rare | Sverdlik et al. (Reference Sverdlik, Mitlin and Dodman2019, p. 62); Satterthwaite et al. (Reference Satterthwaite, Archer, Colenbrander, Dodman, Hardoy, Mitlin and Patel2020); Jay et al. (Reference Jay, Capon, Berry, Broderick, de Dear, Havenith, Honda, Kovats, Ma, Malik, Morris, Nybo, Seneviratne, Vanos and Ebi2021) |
| Ethnic and Indigenous communities | Loss of livelihoods and culture, particularly in urban areas where a global lifestyle is more common; however, less knowledge of impacts of that loss in urban areas | Ford et al. (Reference 87Ford, King, Galappaththi, Pearce, McDowell and Harper2020); Schlingmann et al. (Reference Schlingmann, Graham, Benyei, Corbera, Martinez Sanesteban, Marelle, Soleymani-Fard and Reyes-García2021) |
However, a lens of intersectionality offers a more nuanced lens to understand the heightened impacts of climate risks on highly exposed and vulnerable populations. Intersectionality approaches refer to the interconnecting, overlapping, and compounding effects of discrimination and inequality related to status positions of men and women, age, gender, sex, ethnicity, socioeconomic status, sexuality, geographic location, and disabilities (Kelly et al., Reference Kelly, Kasperavicius, Duncan, Etherington, Giangregorio, Presseau, Sibley and Straus2021). These multiple identities and other differences intersect and reflect larger structures of oppression, such as sexism and racism. For example, women, especially those of color, who manage their own households, suffer multiple and interlocking disadvantages as they navigate local and national governance structures in securing basic services and livelihoods, especially those in informal settlements with no security of housing tenure (Mitlin, Reference Mitlin2021).
As another example, refugees are often confronted with a trifold vulnerability: not knowing the host city and seeking permanent housing in not yet occupied, informal, high-risk areas and thereby being exposed to increased climate change impacts without formal institutional support (Diaby et al., Reference Diaby, Shaarawy and Yousry2020).
Figure 9 shows how the application of an intersectional approach can help to highlight particularly unequal vulnerabilities. This study explored the relationship between person-specific, socioeconomic characteristics that are frequently associated with social vulnerability and perceived affectedness by extreme weather events, future impact severity, and adaptation need and adaptation responsibility in New York City, using a large online survey (Reckien & Petkova, Reference Reckien and Petkova2018). Authors found a significant relationship (represented by the size of the circles) between perceived affectedness by heat waves and low-income households, women and people of African American descent. For heavy rain events, significant relationships existed for people of Asian and Hispanic descent, particularly women and those of low-income households (Reckien & Petkova, Reference Reckien and Petkova2018).
Intersectionality of vulnerability markers, based on data from highly vulnerable populations in New York City who are most affected by heat waves, heavy rain, and storms.
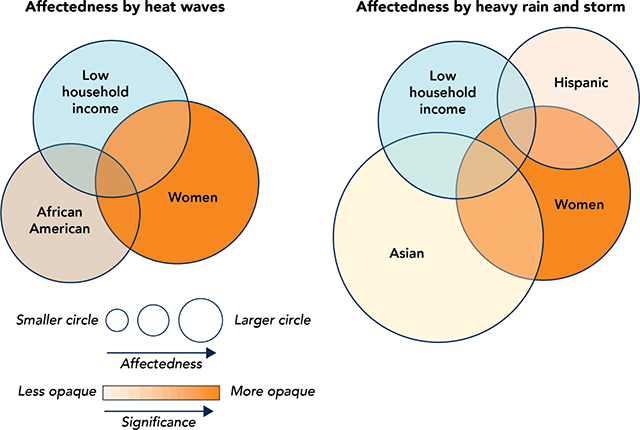
Employing the lens of intersectionality enables us to disaggregate the granularity of systems of power and privilege that perpetuate social inequality, injustice, and marginality among men and women of different colors, identities, abilities, and capacities. This can be seen in the struggles of informal settler families to obtain housing tenure in the Global South where evictions or vagrancy laws are embedded in urban development policies that continue to thwart their resource claims (Domaradzka & Wijkström, Reference Domaradzka and Wijkström2019; Mitlin, Reference Mitlin2021). An intersectional climate justice framework for urban adaptation planning, as proposed by Amorim-Maia et al. (Reference Amorim-Maia, Anguelovski, Chu and Connolly2022), argues for inclusion of the following factors: (1) differential drivers of differential vulnerabilities; (2) systemic gendered social inequalities; (3) place-based and place-making resilience approaches; (4) operationalizing climate action and community resilience; and (5) adopting a politics of care. Thus, adopting an approach that includes all five of the aforementioned factors is necessary to interrogate equity and informality in cities as most urban vulnerability assessments are primarily focused on single and physical vulnerability indicators (e.g., Tapia et al., Reference 104Tapia, Abajo, Feliu, Mendizabal, Martinez, Fernández, Laburu and Lejarazu2017).
4 The State of Urban Adaptation and Equity, Development, and Informality Interactions
Equity in both formal and informal adaptation can be viewed from all four perspectives (distributive, recognitional, procedural, and restorative) (Figure 2). This includes considering how the costs and benefits of adaptation are distributed over time and space, and whether all social groups are recognized to be part of a city and involved in formal decision-making on adaptation throughout the planning and implementation (Reckien et al., Reference Reckien, Magnan, Singh, Lukas-Sithole, Orlove, Schipper and Erin-Coughlan-de Perez2023a). From the point of view of restorative justice, it is also possible to consider using adaptation to restore past injustices in terms of the unequally distributed burden of climate change impacts.
This section considers the interplay between public and private adaptation and the types of adaptation strategies and measures that emerge and are implemented in cities. The informality of adaptation is considered here to be a feature of actions taken to adapt to climate change impacts, often in the absence of public measures. The dimensions of equity and justice also affect and condition the relationship between public and private adaptation. For example, unequal distribution of public adaptation may force households and individuals to adapt privately, thus placing a strain on them to cope. Section 4.1 outlines current urban adaptation efforts and Section 4.2 discusses their effects on equity, development, and informality.
4.1 Adaptation Planning and Implementation in Cities
Adaptation measures are generally implemented by city governments but can also be initiated across other levels of governance (IPCC, 2023a, Ishtiaque et al., Reference Ishtiaque, Eakin, Vij, Chhetri, Rahman and Huq2021). This means adaptation takes place at the individual and household level in cities, as well as the community and city level. However, the influence of national adaptation plans on city adaptation planning varies and is often dependent on the country context (Pietrapertosa et al., Reference Pietrapertosa, Olazabal, Simoes, Salvia, Fokaides, Ioannou, Viguié, Spyridaki, de Gregorio Hurtado, Geneletti, Heidrich, Tardieu, Feliu, Rižnar, Matosović, Balzan, Flamos, Belšak Šel and Reckien2023).Footnote 10
Public adaptation is generally directed at collective needs and provides public adaptation goods in cities (IPCC, 2023b). A global review of over 400 cities shows that the adaptation measures most implemented by city governments apply to the public sector itself (Klein et al., Reference Klein, Araos, Karimo, Heikkinen, Ylä-Anttila and Juhola2018). The instrument mostly used by cities to steer the private sector are different forms of economic incentives, which include financial incentives for companies, for example (Klein et al., Reference Klein, Araos, Karimo, Heikkinen, Ylä-Anttila and Juhola2018). In these cities, citizens and citizen action are mainly steered by information provision (Klein et al., Reference Klein, Araos, Karimo, Heikkinen, Ylä-Anttila and Juhola2018).
In cities, private adaptation is generally taken by citizens and other private organizations to prepare or cope with and take advantage of changes in the climate. The action taken is usually in the actor’s self-interest, and sometimes as a response to stimuli other than climate change, for example to diversify livelihoods (Fenton et al., Reference Fenton, Paavola and Tallontire2017). Much of this private adaptation includes dealing with immediate hazards affecting those taking the action, with or without the support from the public sector.
Although there is a wealth of private adaptation actions taking place in cities, very little documentation exists of them as they are taken by organizations, households, and individuals daily with little knowledge or coordination by the public sector. For example, a review of 301 articles covering information from ninety-eight countries found that 63% (178) of articles reported current heat adaptation responses to be largely undertaken by individuals or communities, thereby falling under the category of coping strategies with no long-term plans, including using local knowledge, leveraging social networks, or engaging in community actions (Turek-Hankins et al., Reference Turek-Hankins, Coughlan de Perez, Scarpa, Ruiz-Diaz, Schwerdtle, Joe, Galappaththi, French, Austin, Singh, Siña, Siders, van Aalst, Templeman, Nunbogu, Berrang-Ford, Agrawal and Mach2021). Types of private adaptation in urban areas can be directly related to the prevalent hazard, such as flood adaptations by using homestead and plinth, that is, the wall between ground level and ground floor level (see Figure 10). However, understanding of private adaptation interventions is still limited, as it remains unnoticed, uncoordinated, and lacking support from governmental actors or other public bodies.
Private adaptation in households, highlighted in yellow boxes in Dhaka, Bangladesh.
Left: Elevating furniture by placing bricks. Middle: Elevated plinth. Right: Construction of shelves near the ceiling to store valuables.
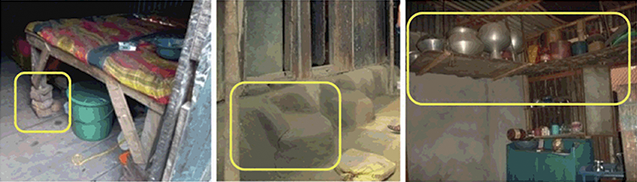
Left: Use of polythene in roof and wall to avoid rainwater seepage. Middle: Use of Styrofoam for vegetation. Right: Raised barrier on doorstep.
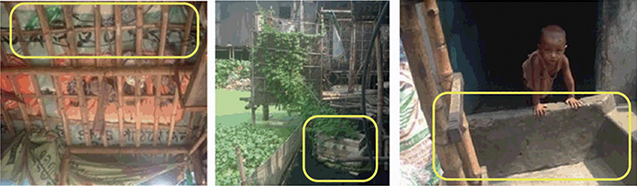
Communal adaptation in Dhaka, Bangladesh. Left: Elevated land of settlement by brick structure. Right: Use of bamboo structures to protect land erosion.
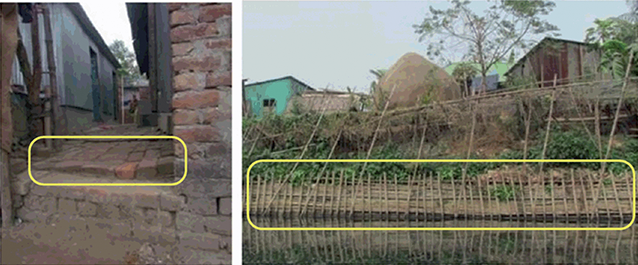
There are also more general actions to empower communities in coastal cities to adapt (Ehsan et al., Reference Ehsan, Begum, Abdul Maulud and Mia2022). In these, community-level boundary organizations and use of local knowledge, public participation events, and targeted community grants can empower the local community to act (Chapin et al., Reference Chapin, Knapp, Brinkman, Bronen and Cochran2016; Howes, Reference Howes2018). With increased heat stress the need for altering current housing structures becomes vital in cities, and this is often done privately without public steering or support programs for retrofitting. For example, the use of cool roofs can have a significant effect on reducing indoor temperatures (Borg et al., Reference Borg, Greibe Andersen, Karekezi, Yonga, Furu, Kallestrup and Kraef2021).
In Ahmedabad, standard tin roofs, asbestos/cement sheets, and concrete were altered with installations of solar reflective white paint on tin, a modular roofing system (ModRoof – an interlocking modular roofing system designed for low-income homeowners, and Airlite ventilation sheet with a passage that allows airflow and thermo-cool insulation, thus reducing indoor temperatures) (Vellingiri et al., Reference Vellingiri, Dutta, Singh, Sathish, Pingle and Brahmbhatt2020). In addition to measures focusing on the dwellings’ physical structures, many other types of private measures are taken by households, such as livelihood changes, insurance, money lending for preparedness, and domestic and international migration (Haque, Reference Haque2021; Noll et al., Reference Noll, Filatova, Need and Taberna2022).
Several studies have shown that most of the climate change adaptation take place within the “formal” public sphere of policies, budgets, rules, and regulations, leaving informal areas outside most of such policies and plans (Satterthwaite et al., Reference Satterthwaite, Archer, Colenbrander, Dodman, Hardoy and Patel2018). Hence, in such areas, it becomes the duty of individuals and community organizations to address the impacts of climate change (Satterthwaite et al., Reference Satterthwaite, Archer, Colenbrander, Dodman, Hardoy, Mitlin and Patel2020). In addition, public and private adaptation measures naturally differ, and the evidence base on how public adaptation affects private adaptation is relatively scarce.
While a distinction is made here between public and private adaptation, this strict classification and a focus on certain adaptation typologies ignores other important dynamics within adaptation processes (Woroniecki et al., Reference Anguelovski, Connolly, Pearsall, Shokry, Checker, Maantay, Gould, Lewis, Maroko and Roberts2019). For example, adaptation processes can reinforce existing power dynamics, supporting local elites (Buggy & McNamara, Reference Buggy and McNamara2016).
Furthermore, adaptation of Indigenous people is often ignored since it relies on coping and autonomous action, in contrast to planned adaptation. The impact of climate change on urban Indigenous people is largely lacking in literature but there are some cases where this has been highlighted. For example, an endeavor in Porirua in Aotearoa, New Zealand focused on imagining beyond the current constraints of urban form, focusing on how cities might reflect the diverse realities of the Māori (Partington & Pedersen Zari, Reference Partington, Pedersen Zari, Pedersen Zari, Connolly and Southcombe2020; Kiddle et al., Reference Kiddle, Elkington, Ross, Mercier, Thomas, Gjerde, Smeaton, Arona and Mawer2023). An urban design competition, workshops, and a symposium can be seen as first steps to build capacity at practical levels.
4.2 Advancement of Justice and Equity in Adaptation Planning and Implementation
Existing literature shows that equity concerns are beginning to be addressed in the development and planning of official city adaptation, albeit slowly (Reckien et al., Reference Reckien, Buzasi, Olazabal, Eckersley, Simoes, Spyridaki, Salvia, Pietrapertosa, Goonesekera, Fokaides, Bastakova, Belsak Sel, Church, Boer, de Gregorio Hurtado, Feliu Torres, Flamos, Foley, Geneletti, German Fernandez, Heidrich, Ioannou, Juhel, Krook-Riekkola, Krkoska Lorencová, Matosovic, Orru, Paspaldzhiev, Riznar, Streberova, Szalmane Csete, Vasilie, Viguié and Wejs2023b). Much of the literature has examined the planning of adaptation (Reckien et al., Reference Reckien, Buzasi, Olazabal, Eckersley, Simoes, Spyridaki, Salvia, Pietrapertosa, Goonesekera, Fokaides, Bastakova, Belsak Sel, Church, Boer, de Gregorio Hurtado, Feliu Torres, Flamos, Foley, Geneletti, German Fernandez, Heidrich, Ioannou, Juhel, Krook-Riekkola, Krkoska Lorencová, Matosovic, Orru, Paspaldzhiev, Riznar, Streberova, Szalmane Csete, Vasilie, Viguié and Wejs2023b). Studies on the outcomes of implementing adaptation measures are rare and there is a particular lack of empirical studies showing how adaptation measures affect different aspects of justice (Reckien et al., 2023b; UNEP, 2023). Actions that focus on inequality and justice are often piecemeal and not particularly coordinated (Fitzgibbons & Mitchell, Reference Fitzgibbons and Mitchell2019). Overall, there is an emphasis on procedural and distributive justice in public adaptation planning, and less attention on recognitional or restorative approaches to justice, although this might be affected by publication bias, with most studies focusing on the distributional and procedural aspects (Coggins et al., Reference Coggins, Berrang-Ford, Hyams, Satyal, Ford, Paavola, Arotoma-Rojas and Harper2021).
Few systematic reviews exist regarding equity in adaptation responses across regions and sectors. In one review of 1,682 articles, researchers examined to what extent certain marginalized social groups were considered in planning or implementing of adaptation (Araos et al., Reference Araos, Jagannathan, Shukla, Ajibade, Coughlan de Perez, Davis, Ford, Galappaththi, Grady, Hudson, Joe, Kirchhoff, Lesnikowski, Alverio, Nielsen, Orlove, Pentz, Reckien, Siders and Turek-Hankins2021). The study found that about 60% of the literature on adaptation responses identifies at least one marginalized group in implementing adaptation, and 50% do so in planning for adaptation. Literature covering social equity in adaptation mainly comes from the Global South: Africa (74% of articles), Asia, and the Small Island States (59% of articles); less often from Australasia (28% of articles), Europe (29% of articles), or North America (42% of articles). Low-income groups are most frequently mentioned (37% of articles), followed by gender/women (20% of articles), and Indigenous peoples (10% of articles); migrants are mentioned least (4% of articles). See additional resources for further review of literature.
Adaptation plans do not always translate into actions on the ground. A review of thirty Latin American city adaptation plans shows that justice considerations are prominent but do not necessarily result in concrete actions and when they do, they focus on education and capacity building, rather than systemic policy interventions (Kato-Huerta & Geneletti, Reference Kato-Huerta and Geneletti2023). Moreover, aiming to contribute to a larger good, public adaptation can at times exacerbate existing injustices and hinder informal adaptation measures (see, for example, a recent review of sixty-eight studies regarding the implementation of public adaptation in Coggins et al., Reference Coggins, Berrang-Ford, Hyams, Satyal, Ford, Paavola, Arotoma-Rojas and Harper2021).
Distributive justice is the most often considered dimension of equity in city-level adaptation. In a sample of twenty-two large US cities, distributive justice was a prominent theme in half the plans, with the most focus placed on adaptation actions and identification of vulnerabilities (Fiack et al., Reference Fiack, Cumberbatch, Sutherland and Zerphey2021). In a representative study of large- and medium-sized cities in Europe, 66% of plans and 34% of cities included a social vulnerability study in their adaptation plans (Reckien et al., Reference Reckien, Magnan, Singh, Lukas-Sithole, Orlove, Schipper and Erin-Coughlan-de Perez2023a). Similarly, an analysis of the strategies of ten of the Rockefeller Foundation’s 100 Resilient Cities programs shows that eight of the plans in the United States have stated objectives of addressing existing inequalities in income, infrastructure access, and services (e.g., housing, transportation, public areas), environmental amenities and disamenities, and educational and economic opportunities, while others have no mention of it (Meerow et al., Reference Meerow, Pajouhesh and Miller2019).
The outcomes of implemented adaptation measures can be viewed through the lens of distributive justice. A review of 136 studies between 2008 and 2020 assesses three adaptation measures that target urban form, green and blue infrastructure, adaptive land uses, and urban design measures, based on indications that adaptation measures may exacerbate existing inequalities or lead to the emergence of new ones (Mohtat & Khirfan, Reference Mohtat and Khirfan2021). Outcomes of adaptation are mostly connected to distributive injustice because adaptation is often implemented in areas of high-value real estate rather than marginalized urban areas.
A study of 3,466 adaptation actions of 983 US urban counties revealed that adaptation actions over the past five years were highest in counties with large annual expected financial loss, particularly in communities of Black and Asian populations (Liu et al., Reference Liu, Fang, Liao, Fan, Sun and Mu2023). This indicates that current adaptation policymaking could be driven by reducing negative economic impacts associated with extreme events rather than prioritizing areas with high socially vulnerable populations (Liu et al., Reference Liu, Fang, Liao, Fan, Sun and Mu2023).
Distributive justice in private adaptation concerns to what extent public adaptation does not address the unequal distribution of climate change impacts, thus placing an undue burden on some groups in society to act privately in the absence of planned adaptation (see Case Study 2 and additional resources for more information).
Meanwhile public adaptation is often done under expert supervision, with hierarchies sometimes resulting in power relations among the actors. Political power and wealth discrepancies have been shown to exacerbate intra-community inequality and exclusion in public, large-scale resettlement projects in the coastal city of Iloilo, Philippines (See & Wilmsen, Reference 102See and Wilmsen2020) as well as coastal city adaptation in Caribbean Small Island Developing states, Bridgetown, Barbados (see Case Study 2). Constrained resources in vulnerable communities can limit access to the benefits of public adaptation, which may be accentuated by an unequal distribution of government programs (Fenton et al., Reference Fenton, Paavola and Tallontire2017).
Lusaka has a history of flooding. The increase in the number of unplanned settlements compounded with the effects of climate change has caused an increase in affected households (Chitumbo & Nchito, Reference Chitumbo and Nchito2023). It is known that the poor tend to settle in precarious and hazardous zones in and around cities as these areas are more affordable. Upon an initial analysis of various adaptive measures, as residents in Kanyama and Kalikiliki settlements in Lusaka undertake to cope with frequent flooding, it becomes apparent that climate adaptation has become a newfound way of life. Some adaptive measures include changes in the architectural style of homes, unblocking drainage, and adapting informal businesses to suit flood conditions. Another prominent action is raising the foundation of homes, which presents additional costs to homeowners (Nchito, Reference Nchito2019).
It is such proactive measures that enable people to continue living in conditions that are considered harsh, unhealthy, and stressful. Residents believe that they play an important role in mitigating floods by unblocking drains and disposing of waste properly. It is often assumed that communities cannot participate in preventing flooding and mitigating impacts. The responsibility is seen as being the preserve of government institutions and NGOs, which often do not take into consideration efforts of individuals and communities. Homeowners construct their houses with an advanced knowledge of terrain and the changing climate. The local municipal government would benefit by learning from Lusaka residents and replicating these community efforts on a broader, city-wide scale.
Left: Flooding in an unplanned settlement in Lusaka. Right: Abandoned housing in Lusaka.
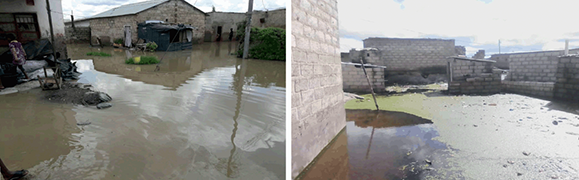
Procedural justice is centered on fairness in decision-making and planning of public adaptation. While equal participation should be ensured throughout the process, van den Bergh and Keenan (Reference van den Berg and Keenan2019) suggest that this alone is not enough. Instead, procedural justice should be linked to vulnerability dynamics by engaging participation across vulnerable populations as these change over time (van den Berg & Keenan, Reference van den Berg and Keenan2019). Initial results from analysis of city plans show that procedural justice is more often accounted for in comparison to the other dimensions of justice (Juhola et al., Reference Juhola, Heikkinen, Pietilä, Groundstroem and Käyhkö2022). Most reviews that assess procedural justice often use the plans themselves as data (e.g., Fiack et al., Reference Fiack, Cumberbatch, Sutherland and Zerphey2021; Reckien et al., Reference Reckien, Buzasi, Olazabal, Eckersley, Simoes, Spyridaki, Salvia, Pietrapertosa, Goonesekera, Fokaides, Bastakova, Belsak Sel, Church, Boer, de Gregorio Hurtado, Feliu Torres, Flamos, Foley, Geneletti, German Fernandez, Heidrich, Ioannou, Juhel, Krook-Riekkola, Krkoska Lorencová, Matosovic, Orru, Paspaldzhiev, Riznar, Streberova, Szalmane Csete, Vasilie, Viguié and Wejs2023b), which does not necessarily reflect all actions taken by a city government. The twenty-two biggest US cities mainly address procedural justice in terms of defining participation in adaptation actions and initiatives, followed by defining adaptation goals and calculating climate change vulnerabilities (Fiack et al., Reference Fiack, Cumberbatch, Sutherland and Zerphey2021).
Studies documenting participation in climate adaptation have mixed results. A study of US cities participating in the Rockefeller Foundation’s 100 Resilient Cities Program shows that most climate adaptation plans were developed with public consultation, with many partner organizations listed as having taken part in the process (Fitzgibbons & Mitchell, Reference Fitzgibbons and Mitchell2019). Likewise, most local adaptation plans of large- and medium-sized cities in Europe (80% of plans) include some form of participation (Reckien et al., Reference Reckien, Magnan, Singh, Lukas-Sithole, Orlove, Schipper and Erin-Coughlan-de Perez2023a). However, the scope of that participation varies significantly between cities (Meerow et al., Reference Meerow, Pajouhesh and Miller2019). See additional resources for examples of procedural justice and how participation is facilitated.
Particularly among vulnerable citizens, procedural justice is seen as the most important part of increasing equity and justice in climate adaptation decision-making, as a study in the City of Lake Macquarie, Australia, highlights (McManus et al., Reference McManus, Shrestha and Yoo2014). Likewise, procedural and recognitional justice was of crucial importance to users of NbS in the Hague, Netherlands (Snep et al., Reference Snep, Klostermann, Lehner and Weppelman2023). And, based on a review of the literature, Cattino and Reckien (2018) found that the level of participation is associated with transformative potential of adaptation, that is, the higher the level of participation (Arnstein, Reference Arnstein1969), the higher the transformative potential of adaptation projects reviewed.
Recognitional justice is a relatively new issue, and overall, plans are weaker in addressing recognitional justice. For example, in a review of ten US cities, Boston and Pittsburgh’s plans specifically note systemic racism while New Orleans recognizes persistent racism and its far-reaching effects (Meerow et al., Reference Meerow, Pajouhesh and Miller2019). In the same review, intergenerational justice, sometimes considered a part of recognitional justice, was not a concern in any of the plans analyzed. However, recognitional (and procedural) justice are found to be of crucial importance to make adaptation interventions, such as implementing greenspaces in The Hague, worthwhile and useful to residents (Snep et al., Reference Snep, Klostermann, Lehner and Weppelman2023).
If recognitional justice is left unfulfilled, that is, already disadvantaged groups are not recognized, then ensuring their rights to participate and guaranteeing procedural justice is challenged. For this reason, recognitional justice is closely tied to procedural justice. This is illustrated in a study of two Indian cities, which shows that a lack of recognition of citizenship rights is compounded by informal livelihood strategies contributing to insufficient social networks, lack of political voice, and heightened exposure (Chu & Michael, Reference Chu and Michael2019). In thirty Global North and South city strategies, there was also a noticeable difference between consultation and engagement, with most cities identifying specific marginalized groups for which specific improvement actions were also identified (Fitzgibbons & Mitchell, Reference Fitzgibbons and Mitchell2019). However, only a fifth of those strategies in the two US cities included in the study directly consulted these disadvantaged or disempowered groups regarding their adaptation needs (Fitzgibbons & Mitchell, Reference Fitzgibbons and Mitchell2019). In New York City, CBOs together with the New York Panel on Climate Change (NPCC) have addressed this issue by co-developing an engagement model for better inclusion (Leichenko et al., Reference Leichenko, Foster, Nguyen, Rice, Long and Levenda2023).
Restorative justice is the newest dimension of adaptation justice and the least settled in terms of theoretical underpinnings and adaptation planning. While there is continued ambiguity, damage is considered to take place when it is possible to repair or restore negative climate impacts and loss when it is not possible (Boyd et al., Reference Boyd, James, Jones, Young and Otto2017). While the Loss and Damage (L&D) mechanism was established at COP27, there continues to be a lack of knowledge of national level financing and effective mechanisms for managing L&D (Boyd et al., Reference Boyd, Chaffin, Dorkenoo, Jackson, Harrington, N’guetta, Johansson, Nordlander, Paolo de Rosa, Raju, Scown, Soo and Stuart-Smith2021; Juhola et al., Reference Juhola, Heikkinen, Pietilä, Groundstroem and Käyhkö2022).
Reviews of existing literature show a lack of empirical studies demonstrating L&D occurring overall, with an urban focused research field yet to emerge (McNamara & Jackson, Reference McNamara and Jackson2019). With cities being particularly affected by sea level rise, due to the location of many cities along the coasts based on historical trade routes, the L&D fund will be majorly important for coastal cities, where adaptation will not suffice. There is evidence of water insecurity and drought leading to L&D in seven Asian countries in the form of tangible losses (groundwater over extraction) and intangible losses (conflict) (Singh et al., Reference Singh, Jain, Sukhwani and Shaw2021). Planning measures for restorative justice thus would be the acknowledgment of the need to compensate for diverging impacts of climate change, as well as compensation for maladaptation and redistribution of resources for adaptation. These have been taken up in some cities.
For example, Vancouver has acknowledged the need to reallocate resources to develop adaptive capacity (Juhola et al., Reference Juhola, Heikkinen, Pietilä, Groundstroem and Käyhkö2022). Planned relocation programs can also be considered to compensate for climate impacts (see additional resources for more information).
Generally, a co-production approach when planning and implementing adaptation is purported to lead to more just outcomes (Tubridy et al., Reference Tubridy, Lennon and Scott2022). Waller (Reference 106Waller2023) posit that in order to advance justice in adaptation: (1) ownership of climate adaptation and infrastructural needs must benefit all populations; (2) communities must be empowered to petition for climate adaptation and infrastructural needs, thereby increasing their resilience; (3) the coping, adaptation, and recovery capacity of underserved communities must be increased; and (4) transparency to the allocation adaptation benefits from specific individual adaptation measures must be improved.
The case of Greater Bridgetown, Barbados highlights the importance of effective climate-resilient development for overcoming barriers such as weak governance, lack of local stakeholder engagement, and a centralized top-down planning approach. Small Island Developing States are extremely vulnerable and exposed, as is the case of the Caribbean islands and particularly Barbados which, with a huge population concentration in low elevation coastal zones, are threatened by rising sea levels and tropical cyclones. These events lead to flooding, coastal retreat, and loss and damage to key infrastructure, housing, health, and economic activities, including the numerous institutional, financial, and human resource capacity barriers that characterize these areas (Mycoo et al., Reference Mycoo, Wairiu, Campbell, Duvat, Golbuu, Maharaj, Nalau, Nunn, Pinnegar, Warrick, Pörtner, Roberts, Tignor, Poloczanska, Mintenbeck, Alegría, Craig, Langsdorf, Löschke, Möller, Okem and Rama2022).
Formal urban planning in Barbados, particularly Physical Development Plans (PDPs) of 2017 (several plans carried out and few implemented), seeks to reduce climate risk with a focus on regulatory and physical-structural measures, offering guidance to public and private actors through regulation and control instruments for urban occupation (Town and Country Development Planning Office, 2017). Plans such as these prioritize solutions based on ecosystems, with preservation and recovery of green areas on the coast and a positive impact on drainage, cobenefits for mitigation and adaptation, in addition to the retreat of urban populations in relation to the line of high tide and cliffs. These measures are typically rejected by real estate agents, pressuring the government for permits to keep investing in high commercial value risky locations, covered by the insurance system (Mycoo et al., Reference Mycoo, Robinson, Nguyen, Nisbet and Tonkel2021).
Despite being a rather small nation, population and area-wise (though size judgment differs according to context), the centralized government of Barbados ends up promoting top-down actions, weakening local networks and the adaptive capacity of communities, and their ability to contribute local knowledge to climate-resilient development. Despite some recent efforts, the nonparticipation of local institutions and the community remains a barrier to effective adaptation in Barbados (Robinson, Reference Robinson2020). Likewise, the appropriation of knowledge about the interaction between adaptation and mitigation to inform adaptation design and planning is still weak, and knowledge gaps, along with weakened governance, are consistent barriers for actions that effectively contribute to climate justice and sustainable development (Mycoo et al., Reference Mycoo, Robinson, Nguyen, Nisbet and Tonkel2021).
Flood hazard map of Bridgetown showing some of the key coastal assets.
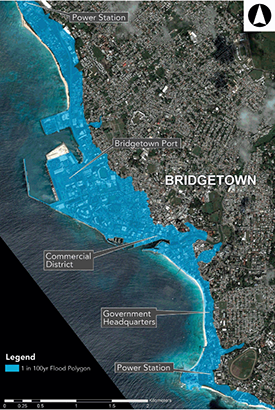
Low elevation coastal zone and flooding in Holetown and Trent based on climate change.
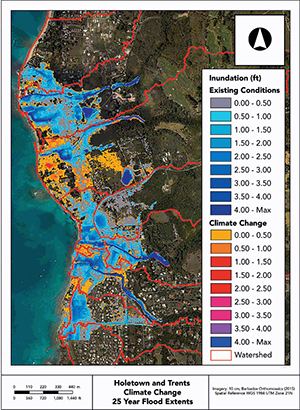
5 The State of Urban Mitigation and Equity, Development, and Informality Interactions
Cities are responsible for both direct and indirect GHG emissions. Direct emissions (Scope 1) arise from activities within their jurisdictions; indirect emissions (Scope 2 and Scope 3)Footnote 13 are embodied emissions associated with activities outside the jurisdictions but related to the demands of the city (Ramachandra et al., Reference Ramachandra, Aithal and Sreejith2015). Affecting Scope 2 emissions, for example, switching energy sources from private cars to electric vehicles, is an upstream product redevelopment (Ellingsen et al., Reference Ellingsen, Singh and Strømman2016). While these are beyond the direct influence of cities, they can enact policies with incentives that promote these kinds of products and substituted materials.
Achieving city-wide emissions targets of net zero will require all sectors to act in an integrated manner that can enable informality to thrive through micro-, small and medium-sized enterprises (MSMEs) and innovatively disruptive technologies (Linton et al., Reference Linton, Clarke and Tozer2022). But the burden of mitigation actions should not be placed on the residents of informal settlements, since they are currently responsible for very low levels of GHG emissions (Moellendorf, Reference Moellendorf2012).
Several cities have adopted climate action plans with mitigation being important alongside adaptation. For example, in Europe, 66% of European large- and medium-sized cities have mitigation plans (Reckien et al., Reference Reckien, Salvia, Heidrich, Church, Pietrapertosa, de Gregorio-Hurtado, d’Alonzo, Foley, Simoes, Krkoška Lorencová, Orru, Orru, Wejs, Flacke, Olazabal, Geneletti, Feliu, Vasilie, Nador, Krook-Riekkola, Matosović, Fokaides, Ioannou, Flamos, Spyridaki, Balzan, Fülöp, Paspaldzhiev, Grafakos and Dawson2018b). Some cities have set targets of reducing emissions by 2030 or 2050. Strategies for net-zero targets have mitigation typologies that have varying implications on equity, development, and informality. Section 5.1 outlines current urban net-zero mitigation strategies and Section 5.2 discusses their effects on equity, development, and informality.
5.1 Mitigation Planning and Implementation in Cities
There are four broad mitigation strategies emerging that cities are actively implementing (Douville et al., Reference Douville, Raghavan, Renwick, Allan, Arias, Barlow, Cerezo-Mota, Cherchi, Gan, Gergis, Jiang, Khan, Pokam Mba, Rosenfeld, Tierney, Zolina, Masson-Delmotte, Zhai, Pirani, Connors, Péan, Berger, Caud, Chen, Goldfarb, Gomis, Huang, Leitzell, Lonnoy, Matthews, Maycock, Waterfield, Yelekçi, Yu and Zhou2021, ch.8): electrification, shifting to clean energy, NbS, and spatial planning.Footnote 14 Cities are stepping up GHG emissions reduction through electrification of high-energy demand systems. Mobility systems are transitioning across cities in both developed and developing countries (Nikulina et al., Reference Nikulina, Simon, Ny and Baumann2019). Public transportation including buses, trains, three-wheelers, and motorcycles are increasingly transitioning in many developing countries (Energy Institute, 2020). Opportunities for electrification are harnessed by expanding into ancillary mobility infrastructure, such as terminals, major transportation stations, and charging stations combined with incentives offered by cities.Footnote 15
Some cities are starting to implement ambitious plans for electrification of the entire public transportation fleet. This may come with inequitable consequences such as increasing costs (Emodi et al., Reference Emodi, Okereke, Abam, Diemuodeke, Owebor and Nnamani2022). Individuals most severely affected by energy poverty tend to be those residing in informal settlements, with a particular emphasis on women in Subsaharan Africa and developing regions of Asia. On the other hand, the role of electrifying supplemental public transportation systems of motorcycles is enabling the informal transportation sector to grow, providing jobs and equity, especially among youth (Martin et al., Reference Martin, Courtright, Nkurunziza and Lah2023).
In Rwanda, for example, electrifying all motorcycles would reduce GHG emissions by approximately 70 kilo tonnes of carbon dioxide (CO2) emissions annually by 2025, reducing total transport emissions by approximately 10% in Kigali and saving over 23 billion Rwandan franc on fuel imports (Sudmant et al., Reference Sudmant, Verlinghieri, Khreis and Gouldson2020). In Nairobi, Dar es Salaam, and Kigali, several projects are introducing or exploring e-car taxis, e-motorbikes (vehicles and charging), e-safari vehicles, e-tuk-tuks and e-tricycles, e-light duty deliveries, e-handcarts, e-wheelchairs, and e-minibuses (Galuszka et al., Reference Galuszka, Martin, Nkurunziza, Achieng’Oginga, Senyagwa, Teko and Lah2021).
The second broad type of mitigation involves reduced reliance on fossil fuels and switching to renewable energy production. Most energy is consumed in cities as electricity is generated outside the city, either as hydropower, thermal power, coal-fired, gas, or diesel-generated electricity (Geels et al., Reference Geels, Schwanen, Sorrell, Jenkins and Sovacool2018). Many cities are promoting solar power uptake for business and households driven by decreasing costs for photovoltaics and batteries. Several cities in Europe and America give subsidies and incentives for homeowners to install solar panels, which can also be integrated with a feed-in system to the grid (Child et al., Reference Child, Kemfert, Bogdanov and Breyer2019; Narayanan et al., Reference Narayanan, Mets, Strobbe and Develder2019). In the Global South, cities are also promoting solar energy through a variety of tools including renewable energy grading of buildings and institutional switching to solar energy (Akrofi & Okitasari, Reference Akrofi and Okitasari2022). However, many programs are yet to offer direct subsidies and monetary incentives to individual homeowners.
Switching to cleaner forms of energy can benefit the informal economy. Bioenergy, biomass, and solar energy technologies are less complicated for semi-skilled labor forces in many cities (Surendra et al., Reference Surendra, Takara, Hashimoto and Khanal2014). In South Africa, cities and the national government worked with energy companies to address energy injustices by installing solar panels in informal settlements, thereby attempting to redistribute access to critical energy in previously marginalized settlements (Conway et al., Reference Conway, Robinson, Mudimu, Chitekwe, Koranteng and Swilling2019; Cantoni et al., Reference Cantoni, Caprotti and de Groot2022). However, the success of many such initiatives in the low-income settlements are questionable due to the disjuncture between policy expectations and user attitudes. This is partially caused by a lack of critical awareness regarding the sociocultural dimensions of introducing new energy forms into low-income settlements (Haque, Reference Haque2021).
While solar energy plays a key role in switching to renewables, sustainable biomass production through green and organic waste recovery are also viable strategies (Islam, Reference Islam2018). Cities in developing countries have large ecological footprints associated with waste that mostly ends up in landfills. Due to high waste generation in these institutions, biogas energy is now tapped from the wastes, enabling a transition of these institutions to become sustainable (Odejobi et al., Reference Odejobi, Ajala and Osuolale2022).
The third broad type is enhancement of green and blue space to sequester carbon. Both in developed and developing country cities, NbS are key due to the multiple co-benefits of improved air quality, health, economics, and adaptation to extreme climate events (Adegun, Reference Adegun2019; van der Meulen et al., Reference van der Meulen, IJff and van Zetten2023). Through enhancing blue and green infrastructure, many cities enhance the uptake of carbon within their region (Ahmed et al., Reference Ahmed, Meenar and Alam2019; O’Donnell et al., Reference O’Donnell, Netusil, Chan, Dolman and Gosling2021; Suleiman, Reference Suleiman2021).
Some cities, such as Portland in the United States, are switching from concrete and steel systems of sewage treatment to natural systems of wetlands (whether artificial or natural), which also enables restoration of urban ecological systems but presents trade-offs related to low-income housing (O’Donnell et al., Reference O’Donnell, Thorne, Yeakley and Chan2020). For equity, development, and informality, NbS have often immediate advantages of improving air quality in cities, moderating heat, providing economic opportunities, generating savings on health costs, and long-term benefits of improving health of the urban population while cities achieve net-zero emissions (Kabisch et al., Reference Kabisch, Korn, Stadler and Bonn2017; Lwasa et al., Reference Lwasa, Buyana, Kasaija and Mutyaba2018; de la Sota et al., Reference de la Sota, Ruffato-Ferreira, Ruiz-García and Alvarez2018).
Industrious, innovative mitigation activities that utilize noncentralized and non-networked infrastructure have demonstrated bottom-up initiatives that can expand emissions reduction and avoidance by cities from waste recycling, bioenergy, urban agriculture (see Case Study 4), material circular flows, compactness of settlements, and active infrastructure powered by adaptable MSMEs. These are evident in literature though are still largely anecdotal (Adegun, Reference Adegun2019).
Nature-based solutions like urban agriculture (UA) are gaining attention as effective climate adaptation strategies, particularly in the Global South (Bezner Kerretal., 2022).Footnote 18 In India, UA is widely practiced in informal settlements, with diverse forms of cultivation such as rooftop, balcony, and backyard gardening. A three-year project by the Indian Institute for Human Settlements mapped UA in Pune and Bengaluru through interviews, surveys, and site visits. Both cities have experienced rapid population growth and the expansion of informal settlements, making UA a valuable tool for empowering marginalized communities (Ramachandra & Kumar, 2010; Butsch et al., 2017).
In these settlements, women predominantly practice UA, often using minimal inputs like native vegetables and fruits, reusing greywater, and composting kitchen waste. Community networks play a crucial role in facilitating these practices. The shared belief in creating green spaces makes UA vibrant in these settlements. In the absence of formal support and guidance, connectedness and community cohesion are deeply valued.
UA in Pune and Bengaluru has yielded several positive outcomes, including a reduction in local temperatures by up to 4°C, enhanced food security, and providing habitat for urban biodiversity (Sagar et al., 2022; Singh et al., 2023). However, challenges such as limited access to land and time constraints persist, reflecting broader issues of land availability, tenure security, and livelihood insecurity in low-income settlements. While UA faces challenges in informal settlements, it offers significant potential to contribute to urban climate adaptation and sustainability goals. Some benefits of UA include the potential to create green jobs, reduce organic landfill waste, and strengthen child nutrition. Targeted city-supported UA initiatives could help overcome challenges and promote more equitable urban development within these spheres.
Urban gardening in informal settlements in Bengaluru, India.
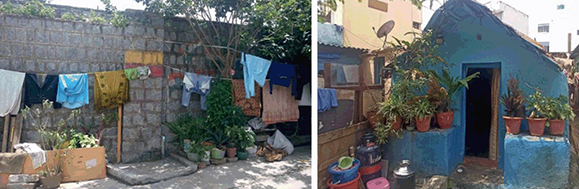
The fourth broad mitigation type is planning to promote compactness of land use, co-locating activities of jobs and residence, and improving circulation for high connectivity within cities.Footnote 16 Cities in developing countries are rapidly growing or emerging, and there is an opportunity to maintain low GHG emissions in these cities by enhancing the compact nature of developments to limit trips, decrease energy demand, and promote active infrastructure. This also includes consideration of safe and affordable, low carbon public transport, which is mostly not available thus far (Karjalainen & Juhola, Reference Karjalainen and Juhola2021). Most older cities continue to sprawl outwards, and the opportunity to create compact growth is being lost. This sprawl is accompanied by lack of infrastructure, which includes drainage systems, thus increasing vulnerability (Ramiaramanana & Teller, Reference Ramiaramanana and Teller2021). Municipal and government institutions are leading this endeavor by reducing the carbon footprint in their routine activities including public procurement, institutional buildings, and planning for more compact cities, neighborhoods, and economic zones (Boyd et al., Reference Boyd, Ghosh and Boykoff2015; Lee & Painter, Reference Lee and Painter2015; Fuhr et al., Reference Fuhr, Hickmann and Kern2018). However, it is important to note that there are associated equity implications of compact city planning.
Cities are taking the lead in mitigating climate change, but there is tension between formal mitigation policies and informality. The dominant approach is top-down, following the sector-based approach to city management, which has implications when these mitigation efforts are viewed through the lens of informality. This is no surprise as most funding and programming is still based on city sectors of infrastructure, energy, housing, and land use.
For example, many cities rely on these large-scale highly networked and centralized systems for water distribution and sewage management. Water supply and sewage treatment systems in many cities are high-emitting sectors due to the high energy demand for water quality and wastewater treatment (Garrick et al., Reference Garrick, De Stefano, Yu, Jorgensen, O’Donnell, Turley, Aguilar-Barajas, Dai, De Souza Leão, Punjabi, Schreiner, Svensson and Wight2019). This can also be seen in bus-rapid transport systems, which are lately being coupled with electrification – an example of a sector for which GHG emissions are estimated and can be verified based on number of trips, passengers, energy used, and combustion (Tayarani et al., Reference Tayarani, Nadafianshahamabadi, Poorfakhraei and Rowangould2018). For both sectors, mitigation efforts are also centrally planned by the utility companies and/or government agencies. From a territorial perspective, the emissions targeted are generated outside the city (e.g., are Scope 2 emissions). Thus, top-down mitigation efforts tend to put emphasis on these types of emissions and focus less on primary emissions that occur within the city jurisdiction.
GHG emissions reduction of informal, bottom-up initiatives is small, but examples show possibilities for expansion. In East African cities, public transport is limited due to many factors (Galuszka et al., Reference Galuszka, Martin, Nkurunziza, Achieng’Oginga, Senyagwa, Teko and Lah2021). However, the deficit is often filled with motorcycle-based transportation and now an electrification of the motorcycle fleet is starting to bear the economic, health, and air quality outcomes of this initiative. The cumulative potential reduction in direct emissions by electrifying the most popular and most used mode of transport in African cities is yet to be realized (Pothitou et al., Reference Pothitou, Hanna and Chalvatzis2016). This implies that electrification of informal infrastructure can have high cumulative emissions reductions if promoted, supported, and dignified as a form of employment in near to mid-term periods.
5.2 Advancement of Justice and Equity in Mitigation
Growing interest exists to examine dimensions of justice of low-carbon transitions and decarbonization (IPCC, Reference Pörtner, Roberts, Tignor, Poloczanska, Mintenbeck, Alegría, Craig, Langsdorf, Löschke, Möller, Okem and Rama2022a; Johnson et al., Reference Johnson, Krisko, Malik, O’Donnell, Pendleton, Ahn, Bizberg, Chafe, Kim, McCormick, Naidoo and Anenberg2022). Evaluations of mitigation strategies have revealed that a focus on equity, social and climate justice, development, and informality can yield both positive and negative outcomes. While many cities are implementing measures to reduce emissions and enhance sustainability, there is an increasing awareness that these efforts may inadvertently exacerbate inequalities and social justice (Pratt, Reference Pratt2023; Bulkeley et al., Reference Bulkeley, Carmin, Castan Broto, Edwards and Fuller2013).
In general, top-down and sector-specific mitigation strategies in cities can have more adverse effects on informality and equity than bottom-up approaches. This is primarily due to an emphasis on structural urban management issues, which are often linked to the emergence of informality (Delgado-Ramos & Guibrunet, Reference Delgado-Ramos and Guibrunet2017; da Silva et al., Reference da Silva, Kernaghan and Luque2019). The negative consequences of mitigation policies are likely to be more pronounced in contexts characterized by high levels of poverty, corruption, and existing economic and social disparities (Markkanen & Anger-Kraavi, Reference Markkanen and Anger-Kraavi2019). These are often compounded, leading to perpetual peripheralization and discrimination (del Rio & Sovacool, Reference del Rio and Sovacool2023).
While top-down mitigation strategies can benefit informality and improvement in equity, the opportunities for equitable development must embrace informality by expanding possibilities of emerging technologies, pathways, and economic systems (Adegun, Reference Adegun2019). Informality in the literature is largely still treated as problematic, requiring replacement and disabling urban governance, but recent literature is enabling a shift in the way informality is seen within urban systems (Banks et al., Reference Banks, Lombard and Mitlin2019).
Bottom-up mitigation initiatives offer opportunities to enhance equity, transition urban development pathways, and reduce informality (Quaye et al., Reference Quaye, Amponsah, Azunre, Takyi and Braimah2022). Achieving equity within mitigation requires deliberate action to ensure that vulnerable populations are not disproportionately burdened, can fully participate, and benefit from these initiatives.
By integrating equity and justice, development pathways can be redirected toward sustainability, avoiding excessive burdens on marginalized communities and cities, and promoting a shared commitment to addressing climate issues (Johnson et al., Reference Johnson, Krisko, Malik, O’Donnell, Pendleton, Ahn, Bizberg, Chafe, Kim, McCormick, Naidoo and Anenberg2022). A comprehensive study of ethical guidance for improving social justice in urban climate change planning is still limited (Pratt, Reference Pratt2023). Drawing from studies, several key dimensions emerge as relevant to this context: recognition, inclusion, fair and equitable distribution of resources and opportunities, and transformative change (Healy et al., Reference Healy, Stephens and Malin2019; IPCC, Reference Pörtner, Roberts, Tignor, Poloczanska, Mintenbeck, Alegría, Craig, Langsdorf, Löschke, Möller, Okem and Rama2022a; Niamir & Pachauri, Reference Niamir and Pachauri2023; Pratt, Reference Pratt2023). In the context of mitigation, the following issues emerge when viewed from the perspective of the four dimensions of climate justice (refer to Box 1).
When considering distributive justice, there is an unfair burden of policies and measures to reduce GHG emissions, which is often realized in the costs and benefits of mitigation policies and management (Sovacool et al., Reference Sovacool, Martiskainen, Hook and Baker2019). The concept of “Well-being for All” and “Leave No One Behind” acknowledges the unequal burden placed on certain individuals and groups, which can be exacerbated by climate impacts. Wealthy individuals have access to more energy sources, disproportionately contribute to higher emissions, and therefore have a high potential for emissions reductions. Figure 11 shows the disconnection between where annual CO2 emissions are projected to be highest versus where informal settlements are located. Those with high socioeconomic status have the potential to curtail GHG emissions by pursuing low-carbon lifestyles, directing investments toward low-carbon enterprises, and actively supporting stringent climate policies (IPCC, Reference Pörtner, Roberts, Tignor, Poloczanska, Mintenbeck, Alegría, Craig, Langsdorf, Löschke, Möller, Okem and Rama2022a; Lamb & Steinberger, Reference Lamb and Steinberger2017).
UN-reported informal areas using twenty-five-mile radius. Annual anthropogenic CO2 emissions (kg/m2) in the near future (2021–2040) relative to 1995–2014 using scenario SSP5-8.5.
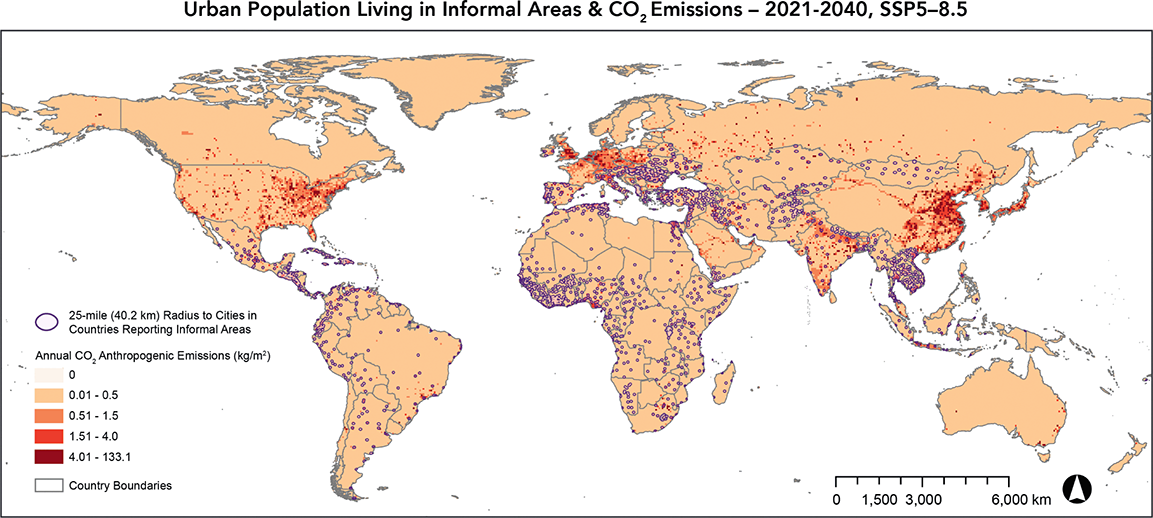
In the transition to a low-carbon economy, distributive justice plays a pivotal role in shaping systems such as energy infrastructure and delivering services like access to renewable energy technology, all with the aim of ensuring equitable distribution of costs and benefits among participants (McCauley et al., Reference McCauley, Ramasar, Heffron, Sovacool, Mebratu and Mundaca2019; Sovacool et al., Reference Sovacool, Martiskainen, Hook and Baker2019). The 2022 Inflation Reduction Act (IRA) in the United States is an example of how legislation can improve access to sustainable energy infrastructure like renewables. The IRA reduces renewable energy costs for businesses, nonprofits, educational institutions, and state, local, and tribal organizations through offering incentives and tax cuts (United States Government, 2022).
In terms of distributional benefits, investments in renewable energy can reduce energy poverty by providing alternatives to grid energy, which is expensive and in some parts of cities hard to connect to. Renewable energy systems are also providing jobs and employment of youths, thereby integrating many into the urban labor force and market. Finally, renewable energy is also enabling alternative pathways for urban development including off-grid, heterogeneous pathways (Lakuma et al., Reference Lakuma, Marty and Muhumuza2019) (see additional resources for information related to equitable allocation of social goods and green spaces).
In procedural justice, engaging citizens, businesses, investors, consumers, role models, professionals, youth, and Indigenous groups and other marginalized groups in decision processes enhances perceptions of legitimacy of climate change mitigation policy choices and support for policy outcomes, while cultivating social trust (Wood et al., Reference Wood, Dougill, Stringer and Quinn2018). An examination into four specific cases reveals injustices regarding the closed nature of decision-making in national energy policy and in smaller-scale pilot programs, which may exclude willing participants. Also, the strong power of lobbying groups was noted as a possible source of procedural injustice (Sovacool et al., Reference Sovacool, Martiskainen, Hook and Baker2019). A systematic review of the literature shows that most renewable energy policies have negative impacts on customers’ energy bills in the short or medium term (Peñasco et al., Reference Peñasco, Anadón and Verdolini2021), meaning that the cost of mitigation is passed onto city dwellers with differing capacities to pay.
Legal institutions, gender equality, and income equity tend to foster social trust. This, in turn, paves the way for enabling climate policies, in particular demand-side measures. Furthermore, it is possible to curtail the consumption of high-status goods, which often have a high carbon footprint, by implementing taxes on absolute wealth. Such measures can be enacted without jeopardizing overall well-being (Creutzig et al., Reference Creutzig, Niamir, Bai, Callaghan, Cullen, Díaz-José, Figueroa, Grubler, Lamb, Leip, Masanet, Mata, Mattauch, Minx, Mirasgedis, Mulugetta, Nugroho, Pathak, Perkins and Ürge-Vorsatz2022a; IPCC, Reference Pörtner, Roberts, Tignor, Poloczanska, Mintenbeck, Alegría, Craig, Langsdorf, Löschke, Möller, Okem and Rama2022a, 2023). Therefore, mitigation policies are more likely to achieve success when they are designed to align with and communicate the values that individuals hold. Approaches that prioritize autonomy, safety, energy security, equity, environmental protection, and fairness tend to resonate effectively within various communities and social groups (Creutzig et al., Reference Creutzig, Ro, Devine-Wright, Díaz-José, Geels, Grubler, Maïzi, Masanet, Mulugetta, Onyige, Perkins, Sanches-Pereira, Weber, Shukla, Skea, Slade, Al Khourdajie, van Diemen, McCollum, Pathak, Some, Vyas, Fradera, Belkacemi, Hasija, Lisboa, Luz and Malley2022b). Though many of these policies and taxes are beyond the city governments to design and implement, they can nevertheless support and lobby for these measures to be passed nationally.
Recognitional justice refers to the need to acknowledge that there are vulnerable groups in society that may disproportionately be affected by low-carbon transitions (Hughes & Hoffmann, Reference Hughes and Hoffmann2020). These groups may be the chronically poor, ill, or unemployed. Also, low-income people often bear the cost of subsidies of new low carbon energy programs while simultaneously not being able to benefit from them (Sovacool et al., Reference Sovacool, Martiskainen, Hook and Baker2019). For example, Sovacool et al. (Reference Sovacool, Martiskainen, Hook and Baker2019) report that poor housing segments in France, burdened families in Germany, and vulnerable groups in Norway are dependent on inefficient and high-priced electrical heating. In the United Kingdom, the best deals within the energy market have been structurally excluded (Sovacool et al., Reference Sovacool, Martiskainen, Hook and Baker2019).
Restorative justice, rooted in principles of healing, accountability, and reconciliation has become a topic for academic debate in recent years (Almassi, Reference Almassi, Pali, Forsyth and Tepper2022). The potential lies in leveraging climate change mitigation strategies as catalysts for both environmental sustainability and social restitution. By directing these efforts toward historically marginalized communities, which often bear a disproportionate burden of environmental challenges, cities can simultaneously rectify past wrongs and foster a more equitable and resilient future. There is very little scientific evidence in terms of implementation of restorative policies. The European Union (EU) Green Deal with its ambition of “Leave No One Behind,” may be considered a form of compensation for the loss of employment due to the transition. For example, this may mean compensation or new jobs for more than 230,000 coal workers in thirty-one coal regions in eleven EU member states (Skjærseth, Reference Skjærseth2021).
6 Equitable Urban Transitions and Transformations
Development in this Element is understood as climate-resilient development in which both adaptation and mitigation are needed to secure the achievement of the SDGs (Schipper et al., Reference Schipper, Revi, Preston, Carr, Eriksen, Fernandez-Carril, Glavovic, Hilmi, Ley, Mukerji, Muylaert de Araujo, Perez, Rose, Singh, Pörtner, Roberts, Tignor, Poloczanska, Mintenbeck, Alegría, Craig, Langsdorf, Möller, Okem and Rama2022). Thus, development that is not supported by successful adaptation and mitigation actions is unlikely to yield a sustainable, thriving society. It is broadly recognized that for adaptation and mitigation to be successful, they should transform existing systems rather than propose incremental changes (Heikkinen et al., Reference Heikkinen, Ylä-Anttila and Juhola2019).
Central to this ARC3.3 Element is understanding the role that equity and informality play in just urban transformations and how they can lead toward climate-resilient development. Thus, understanding and conceptualizing the “just” in just urban transformations means considering what equity implications transformations might have and in what ways transformation processes affect the rights of those involved. It is also possible that mitigation and adaptation are not successful and lead to or further contribute to injustices, such as maladaptation (Reckien et al., Reference Reckien, Buzasi, Olazabal, Eckersley, Simoes, Spyridaki, Salvia, Pietrapertosa, Goonesekera, Fokaides, Bastakova, Belsak Sel, Church, Boer, de Gregorio Hurtado, Feliu Torres, Flamos, Foley, Geneletti, German Fernandez, Heidrich, Ioannou, Juhel, Krook-Riekkola, Krkoska Lorencová, Matosovic, Orru, Paspaldzhiev, Riznar, Streberova, Szalmane Csete, Vasilie, Viguié and Wejs2023b). While many adaptation and mitigation measures will be successful in achieving their goals, maladaptation is shown to take place, as well as unintended outcomes of mitigation (Wang, Reference Wang2021; Reckien et al., Reference Reckien, Buzasi, Olazabal, Eckersley, Simoes, Spyridaki, Salvia, Pietrapertosa, Goonesekera, Fokaides, Bastakova, Belsak Sel, Church, Boer, de Gregorio Hurtado, Feliu Torres, Flamos, Foley, Geneletti, German Fernandez, Heidrich, Ioannou, Juhel, Krook-Riekkola, Krkoska Lorencová, Matosovic, Orru, Paspaldzhiev, Riznar, Streberova, Szalmane Csete, Vasilie, Viguié and Wejs2023b).
The concept of “just transition” is a conceptual umbrella that integrates previous scholarship on climate, energy, and environmental justice (Heffron & McCauley, Reference Heffron and McCauley2018; Hughes, Reference Hughes2020). The emerging concept of “just urban transition” (Hughes & Hoffmann, Reference Hughes and Hoffmann2020) and “just climate adaptation” (Castán Broto, Reference Castán Broto2021; Juhola et al., Reference Juhola, Heikkinen, Pietilä, Groundstroem and Käyhkö2022) conceptualize the pathway toward climate justice especially for cities. In this predominantly theoretical discussion so far, the focus has been to conceptualize transformative capacity inherent to the urban system and its interfaces among stakeholders, places, and processes (Torrens et al., Reference Torrens, Westman, Wolfram, Broto, Barnes, Egermann, Ehnert, Frantzeskaki, Fratini, Håkansson, Hölscher, Huang, Raven, Sattlegger, Schmidt-Thomé, Smeds, Vogel, Wangel and von Wirth2021).
6.1 Inclusion of Justice Dimensions
The concepts of just urban transitions are emerging in the literature to orient research, policy, and practical actions toward an effective inclusion of justice and equity dimensions into climate-responsive planning and urban design projects.Footnote 19 This would be a move away from existing processes that often tend to reproduce inequalities or overlook marginalized, vulnerable communities (Hughes et al., Reference Hughes, Chu and Mason2020; Torrens et al., Reference Torrens, Westman, Wolfram, Broto, Barnes, Egermann, Ehnert, Frantzeskaki, Fratini, Håkansson, Hölscher, Huang, Raven, Sattlegger, Schmidt-Thomé, Smeds, Vogel, Wangel and von Wirth2021). Large-scale, prestige-oriented infrastructure projects and business-oriented interventions are often preferred by climate finance with a focus on representative parts of global cities as centers of climate urbanism, overlooking small- and medium-sized cities, vulnerable communities, most poor settlements in terms of access to climate-safe services, housing, and infrastructures (Anguelovski et al., Reference Anguelovski, Connolly, Pearsall, Shokry, Checker, Maantay, Gould, Lewis, Maroko and Roberts2019; Shi, Reference Shi, Castán Broto, Robin and While2020; Lehmann et al., Reference Lehmann, Major, Fitton, Doust and O’Donoghue2021). All four dimensions of equity are addressed in the conceptualization of just urban transformations, highlighting how they need to be addressed and accounted for when climate actions are emerging or facilitated.
For recognitional justice, the implementation of planning mechanisms and design tools that can integrate the demands of inclusiveness can overcome systemic inequality, discrimination, and marginalization, and cope with root causes of vulnerability is called for (Collado & Wang, Reference Collado and Wang2020). Community-led innovations need to be reconsidered and considered for just urban transitions as they represent opportunities to develop resilience that already exist in cities (see Case Study 5). In the context of informality, people are adapting constantly to changing urban settings and formulating new models of urban development that may turn into robust coping actions (e.g., autonomous waste collection, energy self-sufficiency) (Castán Broto & Robin, Reference Castán Broto and Robin2020). Reconsideration of informality in this perspective is crucial in terms of recognition and procedures (e.g., knowledge and governance) to incorporate aspects of low-carbon development, social network capabilities, circular economies, and low-budget solutions into just urban projects. Recognitional justice is also critical in environmental justice aspirations and for the SDG fulfillment, especially SDG1 (No Poverty), SDG10 (Reduced Inequalities), and SDG13 (Climate Action) (Gomes, Reference Gomes2021).
Barrio Intercultural, in San Martin de los Andes, Patagonia, is an example of a successful community-led initiative for accessible, sustainable, and resilient housing for vulnerable, marginalized groups facing environmental and political-economic pressure. The region was traditionally occupied by the Mapuche community and became of high touristic interest by the 1980s.
A housing emergency was declared after a census led by Vecinos Sin Techo (VST), a social organization that has collaborated with the Mapuche Curruhuinca community since 2004, to recover the land for its original occupants expelled in 1880. The area became a National Park in the 1930s and in 2011 the Argentinean Government restored around 400 hectares to the community, comprising Indigenous and non-Indigenous inhabitants, thanks to the VST and Mapuche community movement.
The physical and social construction of Barrio Intercultural (92 of 250 houses built) is based on preserving Indigenous– and non-Indigenous identities. Barrio Intercultural is built by the community, self-organized, and financed by the government, which also gives technical assistance, also through partner social organizations. A complex inclusive governance and planning were conceived to achieve a sustainable future focusing on “intersectionality, interdisciplinarity, organizational strengthening, interculturality, environmental and climate awareness, as well as solidarity.”
Sustainable and resilience-based building and social and economic solutions were adopted: use of natural lighting and ventilation in homes; reduced soil sealing; prioritizing pedestrians over motorized vehicles; mixed system of solar and electrical energy; efficient stoves (few homes also using gas); water supply mixed system with reduced environmental impact (by the water cooperative and from the Cull Rani stream); community gardens to support food sovereignty (deactivated during the COVID-19 pandemic, impacting community cultivation and meals); recycling waste in the community or in a recycling station; and local sustainable sanitary treatment (not fully implemented due to cost, bioclimatic, and cultural issues).
The success of the project also has positive repercussions for tackling the giant housing challenge for vulnerable and marginalized populations, which persists in the context of the environmental and climate crisis.
Left: A home in Barrio Intercultural: Community of Change for non-Mapuche community members; San Martin de los Andes, Argentina. Right: The rucas, a typical Mapuche-style home, with an octagonal floorplan in Barrio Intercultural; San Martin de los Andes, Argentina.
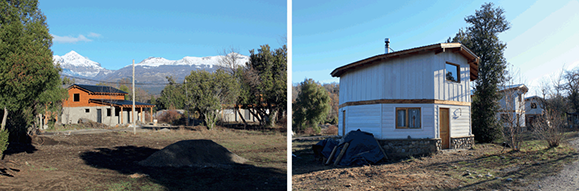
In terms of procedural justice, there is a need to reconfigure understanding of which actors can deliver just urban adaptation and mitigation in contemporary cities. This calls for reshaping the dynamics of power and action currently occurring in cities in which climate interventions are led mostly by business-oriented actors. Recognition of actors in terms of agency, authority, and accountability for just urban transformations needs to be implemented (Hughes et al., Reference Hughes, Chu and Mason2020). This is also linked to the dichotomy between large-scale investments carried on by private companies versus small-scale innovations led by local communities (Castán Broto et al., Reference Castán Broto, Robin and While2020; Castán Broto, Reference Castán Broto2021).
For distributive justice, the focus is on the community scale. The neighborhood scale is at the forefront in innovating the provision of collective services (e.g., childcare, security, food production, energy production) and the sharing of responsibilities (Castán Broto, Reference Castán Broto2021). The scale of citizen engagement, small enterprises, local institutions (e.g., schools, neighborhood healthcare centers, civic centers), third-sector organizations, that is, a range of organizations with different structures and functions, belonging neither to the public sector (i.e., the state) nor to the private sector (profit-making private enterprise), and knowledge intermediaries (e.g., universities, nonprofit organizations) should be included in effective planning actions (Wolfram et al., Reference Wolfram, Borgström and Farrelly2019; Castán Broto, Reference Castán Broto2021).
The restorative justice dimension needs to be better understood and integrated in terms of effective measures to ensure responses to loss and damage and recognition of the knowledge, capacity, and desires of marginalized or excluded groups of populations (Chu & Michael, Reference Chu and Michael2019; Hughes et al., Reference Hughes, Chu and Mason2020). One way to do this is to develop consistent forms of coproduction of knowledge and actions, while acknowledging power imbalances (Vincent et al., Reference Vincent, Carter, Steynor, Visman and Wågsæther2020). In addition, research and policy agendas should pay more attention to colonial legacies that still have consequences in urban processes and give more space to postcolonial lenses and Global South experiences and their dynamics of change (Robin & Castán Broto, Reference Castán Broto2021).
6.2 The State of Just Urban Transformations
The empirical evidence for ongoing transformations is scarce both, in general, but also in the urban context (Salomaa & Juhola, Reference Salomaa and Juhola2020; IPCC, Reference Pörtner, Roberts, Tignor, Poloczanska, Mintenbeck, Alegría, Craig, Langsdorf, Löschke, Möller, Okem and Rama2022a). Most literature has focused on identifying potential theoretical and conceptual gaps and leverage points that need to be addressed for just transformations to occur. Thus far, there is little empirical evidence on the equity implications of transformations. Therefore, we rely on identified examples that can serve as entry points but should not be generalized (see additional resources Box 1).
First, transformational approaches address the root causes of risk that involve the drivers of vulnerability and engage with issues of power, justice, and agency. Power, justice, and agency are particularly important for cities in developing countries because of rapid rates of urbanization. Poorer rural populations are more likely to face political marginalization and lack adequate representation in host communities, which directly impacts their vulnerability and exposure (Bahadur & Tanner, Reference Bahadur and Tanner2021).
Second, for an initiative to be transformational, it needs to deliver outcomes that will endure for a long duration, for example, shifts in institutional structures and policies (Few et al., Reference Few, Morchain, Spear, Mensah and Bendapudi2017). In many contexts, sustainable change may result from a reorganization of government systems, the establishment of new organizations, or political and administrative regime reform. This issue is particularly relevant for urban contexts because governance mechanisms and structures tend to be assembled in urban areas, which offers opportunities to embed risk-reducing policies and institutions to deliver lasting change.
Third, a number of different conceptualizations of transformation underline the critical importance of scale, that is, they embody the need for a large magnitude and intensity of change. For an initiative to be transformational, it should affect a large number of people and work across governance scales (e.g., from local to national level) (Kates et al., Reference Kates, Travis and Wilbanks2012; Few et al., Reference Few, Morchain, Spear, Mensah and Bendapudi2017). Working across scales is particularly crucial for urban areas in developing countries because these towns and cities are afflicted by fractured decentralization. The power to make key risk reduction decisions may reside with authorities at provincial and federal levels.Footnote 21
Fourth, there is a growing understanding of how transformational approaches influence change beyond the direct area of implementation and incorporated cascading impacts (Kates et al., Reference Kates, Travis and Wilbanks2012). Pal et al. (Reference Pal, Bahadur, Mcconnell, Prutha Vaze, Acharya and Kumar2019) argue that “transformational change can result from initiatives that catalyze broader change. Deliberate shifts within systems can be expanded to trigger indirect changes and cascading impacts within structures and systems that are beyond an initiative’s direct mandate or reach” (p. 7). This ability to catalyze a domino effect is particularly important in the context of cities as most countries and regions have institutions aimed at linking cities with one another (e.g., national mayors’ councils, municipal federations, urban climate networks, etc.) and that can be used for transmitting these cascading shifts.
Red Hook is a community in Brooklyn, New York that is particularly vulnerable to climatic events. When Hurricane Sandy struck in October 2012, Red Hook was one of the city’s four hardest-hit areas suffering major service disruptions that left residents with no heat and electricity for seventeen days, and without running water for eleven (New York City Special Initiative for Rebuilding and Resiliency, 2013; Schmeltz et al., Reference Schmeltz, González, Fuentes, Kwan, Ortega-Williams and Cowan2013). At the time, municipal disaster plans did not contemplate nor address “extensive and long-lasting power outages and lack of key services” such as the ones experienced in Red Hook (Schmeltz et al., 2013, p. 7).
The Red Hook Initiative(RHI) is a community-based nonprofit whose doors stayed open 12−14 hours per day for twenty-four consecutive days during Hurricane Sandy to meet the needs of thousands of Red Hook residents and serve as a social and logistical hub for the community. It is from this context of equity and engagement that the Community Disaster Readiness Plan was born, developed to establish a locally relevant protocol to address the critical 72 hours before and after a disaster. What distinguishes this plan from its municipal counterparts is the understanding and integration of lived experience, which allows residents to create a responsive and meaningful intervention framework guided by knowledge of how previous gaps in service failed to keep their community safe and serviced.
Red Hook’s readiness framework has seven thematic areas that distribute relief efforts across the community: support services; food and shelter; communications; health and medical; community response team; utilities; and coordination. This community example creates numerous entry points for replicating its participatory approach across many areas of the resilience planning process, providing a valuable case to guide the implementation of scalable and responsive local interventions worldwide.
Community Disaster Readiness Plan: Support services map (Ready Red Hook, 2016).
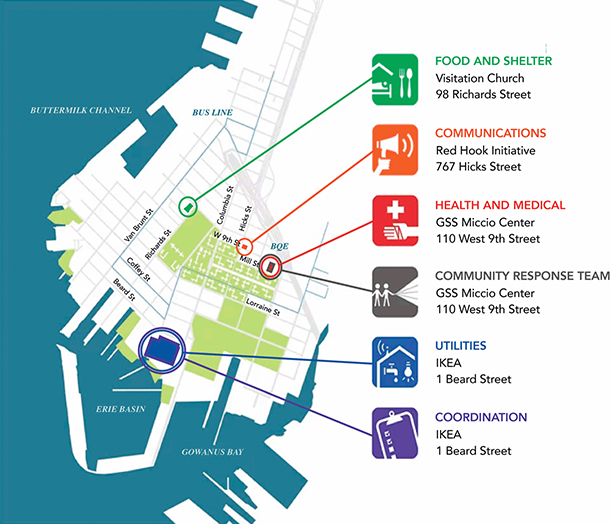
However, there is an open debate in the literature concerning what can initiate transformation. Shi (Reference Shi2021) argues that cities can move from being historical neoliberal cities, through cities of (un)just resilience or cities of equitable vulnerability, to transformative cities when they center on equitable, just adaptation, localized economies, and noncapitalist visions of human–nature relations (Figure 12). To achieve redistribution, progressive powers seek to expand democracy, which can advance procedural justice if communities meaningfully participate in decisions that affect them. However, it is also important to focus on administrative reforms to institutionalize progressive values in government or community institutions (Creutzig et al., Reference Creutzig, Becker, Berrill, Bongs, Bussler, Cave, Constantino, Grant, Heeren, Heinen, Hintz, Ingen-Housz, Johnson, Kolleck, Liotta, Lorek, Mattioli, Niamir, McPhearson, Milojevic-Dupont, Nachtigall, Nagel, Närger, Pathak, Perrin de Brichambaut, Reckien, Reisch, Revi, Schuppert, Sudmant, Wagner, Walkenhorst, Weber, 84Wilmes, Wilson and Zekar2024).
Typology of transformation pathways in cities.

Others argue public participation itself has the potential for transformation. Based on a review by Cattino and Reckien (Reference Cattino and Reckien2021), for participation to be potentially transformative, four conditions must be met: (1) recognition of all actors; (2) their clear and meaningful engagement in all decision-making stages; (3) full decision-making power of the involved public; and (4) the support of a logic of welfare, that is, social efforts designed to promote the basic physical and material well-being of people in need.
Hurlbert and Gupta (Reference Hurlbert and Gupta2015) call out four spaces regarding how procedural justice interacts with power. Figure 13 shows how participation can take place within these four spaces, depending on how structured/agreed or unstructured/contested the science and the values/norms/goals of interventions are (Hurlbert & Gupta, Reference Hurlbert and Gupta2015; Georgiadou & Reckien, Reference Georgiadou and Reckien2018). Figure 13 also shows the centrality of participation for other justice dimensions, as each of the four spaces is characterized by a particular form of participation entailing certain conditions for other justice dimensions. This figure shows how the different forms of participation identified in literature foster or hinder outcomes on justice dimensions.
Framework to guide exploration of centrality of participation and trust in just adaptation.
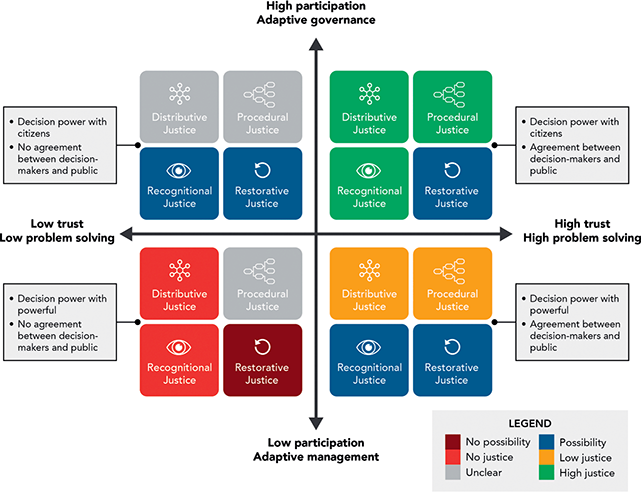
While the literature unanimously stresses the importance of including local people, their concerns, values, and worldviews, little evidence for good practices exist or how participation can be done in a meaningful way and the challenges it entails (Wood et al., Reference Wood, Dougill, Stringer and Quinn2018; Cattino & Reckien, Reference Cattino and Reckien2021). According to Wood et al. (Reference Wood, Dougill, Stringer and Quinn2018), there are at least three spaces where participation is possible: (1) the introduction space of a project, that is, the time when, for example, climate change projects are instigated in a city or community; (2) the execution space, that is, the time when projects are implemented or carried out; and (3) the monitoring and evaluation space, that is, when the outcomes of projects are tracked, monitored, evaluated, and reported.
Within these spaces, Wood et al. (Reference Wood, Dougill, Stringer and Quinn2018) present an approach to help decision-makers and implementers create widespread recognition of and substantial participatory opportunities for local people, thereby understanding, managing, and challenging power asymmetries (see additional resources for further details). Juhola et al. (Reference Juhola, Heikkinen, Pietilä, Groundstroem and Käyhkö2022) stress the importance of monitoring and evaluation and show along a management cycle how certain indicators can help in monitoring and evaluating toward a more just urban climate governance (see Figure 14).
Steps in an adaptation cycle, entry points for the four types of climate justice, and indicators to evaluate their function.
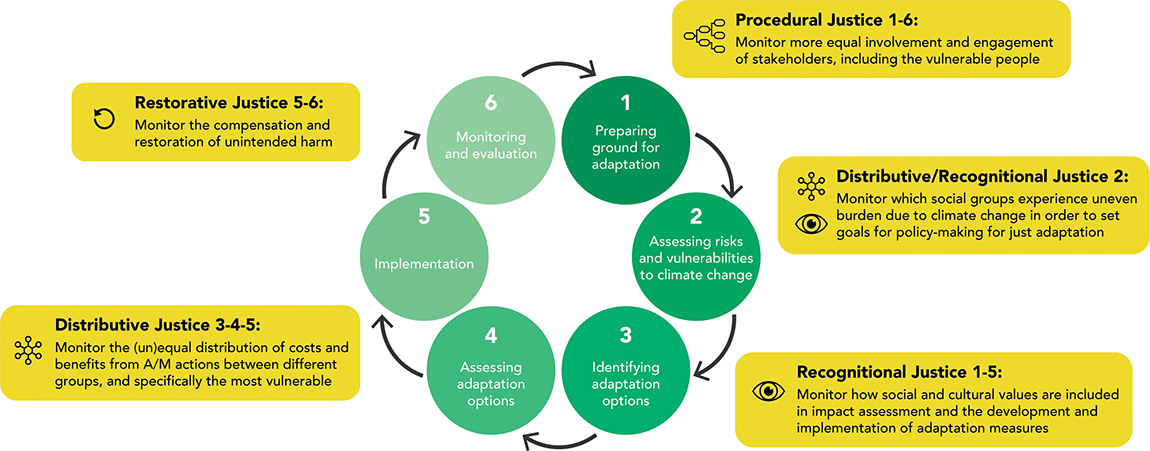
There are examples of ongoing just urban transformation, such as those by the Gorakhpur Environmental Action Group, New York City Mayor’s Office of Recovery and Resiliency, Slum Dwellers International, and Self-Employed Women’s Association in Indian cities (see additional resources Box 1). Sometimes, transformative adaptation and mitigation actions also have potential for restorative justice. For example, vulnerable people tend to live in hotter urban areas with less green cover. Yet, increasing tree cover has been shown to exert a larger cooling effect in vulnerable neighborhoods based on research in thirty-eight of the largest cities in the United States (Zhou et al., Reference Zhou, Huang, Pickett, Wang, Cadenasso, McPhearson, Grove and Wang2021).
6.3 Components of Urban Transformations and Climate-Resilient Development
While the focus in transformation research is often at the systems level, it is important to account for changes at the individual level, which are required for systems change. Behavioral change is a key lever for cities to adapt and mitigate while meeting individual and collective needs and aspirations (Creutzig et al., 2022b; de Coninck et al., 2018). It can incentivize individual actions (e.g., appeal to peoples’ sustainability values to drive lower meat consumption); change in communities or social groups (e.g., tax rebates to enable community urban farming); and city-wide transformation (e.g., cheaper public transport encouraging commuter use commuter behavioral change).
In urban adaptation, behavior change tends to focus on averting or reducing disaster impacts and aligning risk perceptions with public values. This tends to be more socio-culturally accepted, thereby facilitating positive social behavioral change in cities (Glavovic et al., Reference Glavovic, Dawson, Chow, Garschagen, Haasnoot, Singh, Thomas, Aerts, Blackburn, Catt, Chu, Solecki, Stijn-Temmerman and Winter2022). In coastal cities, individual behavior depends on the ability or belief in one’s capacity to undertake adaptation (Fox-Rogers et al., Reference Fox-Rogers, Devitt, O’Neill, Brereton and Clinch2016). In cities that experience floods, moving away from low-lying areas may be necessary to adapt or cope with impacts of loss of fisheries or tourism, or salinization of groundwater. Behavior changes like diversifying livelihoods may not suffice, and more transformational changes need to be enabled by urban planned adaptation that align with socio-cultural values and worldviews (Glavovic et al., Reference Glavovic, Dawson, Chow, Garschagen, Haasnoot, Singh, Thomas, Aerts, Blackburn, Catt, Chu, Solecki, Stijn-Temmerman and Winter2022).
Urban mitigation measures are dependent on changes in urban form as well as initiatives encouraging consumer behavior change (Shukla et al., Reference Shukla, Skea, Reisinger, Slade, Fradera, Pathak, Al Khourdajie, Belkacemi, van Dieman, Hasija, Lisboa, Luz, Malley, McCollum, Some, Vyas, Shukla, Skea, Slade, Al Khourdajie, van Diemen, McCollum, Pathak, Some, Vyas, Fradera, Belkacemi, Hasija, Lisboa, Luz and Malley2022). For example, transportation coordinated with housing policies can broaden relocation options and develop walkable urban areas. Urbanization that focuses on greening and decentralized renewable energy can create health co-benefits from clean air and enhanced mobility (Shukla et al., Reference Shukla, Skea, Reisinger, Slade, Fradera, Pathak, Al Khourdajie, Belkacemi, van Dieman, Hasija, Lisboa, Luz, Malley, McCollum, Some, Vyas, Shukla, Skea, Slade, Al Khourdajie, van Diemen, McCollum, Pathak, Some, Vyas, Fradera, Belkacemi, Hasija, Lisboa, Luz and Malley2022).
In terms of research methodologies and localized action, inclusive approaches to planning can be identified to incorporate the needs of the most vulnerable in producing just planning outcomes defined as “the degree to which formal or institutionalized adaptation projects and programs achieve just results” (Chu et al., Reference Chu, Anguelovski and Carmin2016, p. 376). For example, co-production of knowledge to support climate services is intended as the provision of climate information to assist decision-making and can be used to address power relations (Vincent et al., Reference Vincent, Daly, Scannell and Leathes2018; Howarth et al., Reference Howarth, Lane, Morse-Jones, Brooks and Viner2022).Footnote 23
Usually, co-production in climate policies takes place among powerful peers (e.g., scientists and decision-makers) excluding perspectives of vulnerable communities (Visconti, Reference Visconti2023). Thus, conditions of exclusion for marginalized subjects are maintained (Muñoz-Erickson et al., Reference Muñoz-Erickson, Miller and Miller2017; Howarth et al., Reference Howarth, Lane, Morse-Jones, Brooks and Viner2022). This also means that learning processes within organizations need to be identified and marginalized populations placed at the center of adaptation and mitigation objectives (Eriksen et al., Reference Eriksen, Schipper, Scoville-Simonds, Vincent, Adam, Brooks, Harding, Khatri, Lenaerts, Liverman, Mills-Novoa, Mosberg, Movik, Muok, Nightingale, Ojha, Sygna, Taylor, Vogel and West2021).
This is also related to the topic of reproducing inequalities or creating new ones (e.g., processes of maladaptation, green gentrification). Co-production shapes an interface between science and society and if used in a more collaborative and inclusive way can lead to more equitable pathways of adaptation and mitigation (Vincent et al., Reference Vincent, Daly, Scannell and Leathes2018). One way to do this is through urban living labs, for example, UCCRN’s Urban Design Climate Workshops.Footnote 24 Currently, information on hazards, exposure, and vulnerability is generated through a range of approaches, which include climate models that deliver projections for changes in key climate variables (e.g., temperature rise), which are then combined with other variables and employed for modeling hazards (e.g., heat waves) (Bader et al., Reference Bader, Blake, Grimm, Hamdi, Kim, Horton, Rosenzweig, Rosenzweig, Solecki, Romero-Lankao, Mehrotra, Dhakal and Ibrahim2018).
Satellite remote sensing data permit analysts to ascertain the likelihood of certain hazards (e.g., storms and landslides), help determine the people and assets that might be exposed to these hazards and by capturing information on the socioeconomic profile of those exposed (e.g., quality of houses), and enable citizens to approximate the degree to which individuals might be vulnerable (Kaku, Reference Kaku2019) (see Box 2).
Earth observations tools, data, and approaches help to monitor deprivation, informality, and vulnerability, and the progress toward sustainability and resilience. Here, we present examples from (1) the Earth Observations Toolkit for Sustainable Cities and Human Settlements, (2) the IDEAMAPS Network and IDEATLAS, and (3) the SLUMAP project.
(1) The Earth Observations Toolkit for Sustainable Cities and Human Settlements is an online resource that supports cities and countries in their SDG 11 monitoring, urban policy planning, and implementation.
(2) The IDEAMAPS Network and IDEATLAS developed AI-based methods to map and characterize informal settlements from Earth Observations data with the aim of developing and maintaining an integrated mapping system of deprived areas. The mapping system leverages the strengths of current siloed approaches to “slum” areas. Variables include unplanned urbanization as small, high-density, disorganized buildings; social risk as no social safety net, crime; environmental risk as flood zones, slopes; and land use/rights as nonresidential zoning, and so on.
(3) The SLUMAP (Remote Sensing for Slum Mapping and Characterization in sub-Saharan African Cities) project was a two-year research project (2019−2021) that proposed an open-source framework for the processing of remote sensing images to a) provide geographic information of inter-city slums and b) characterize the physical environment within slums. The method was tested on three Subsaharan cities of different characteristics, including Nairobi (Kenya), Kisumu (Kenya), and Ouagadougou (Burkina Faso) and then expanded to additional cities. The SLUMAP Tool was the result of this project.
The Earth Observations Toolkit
SLUMAP, showing greenness of building roofs and citywide indicators in Nairobi
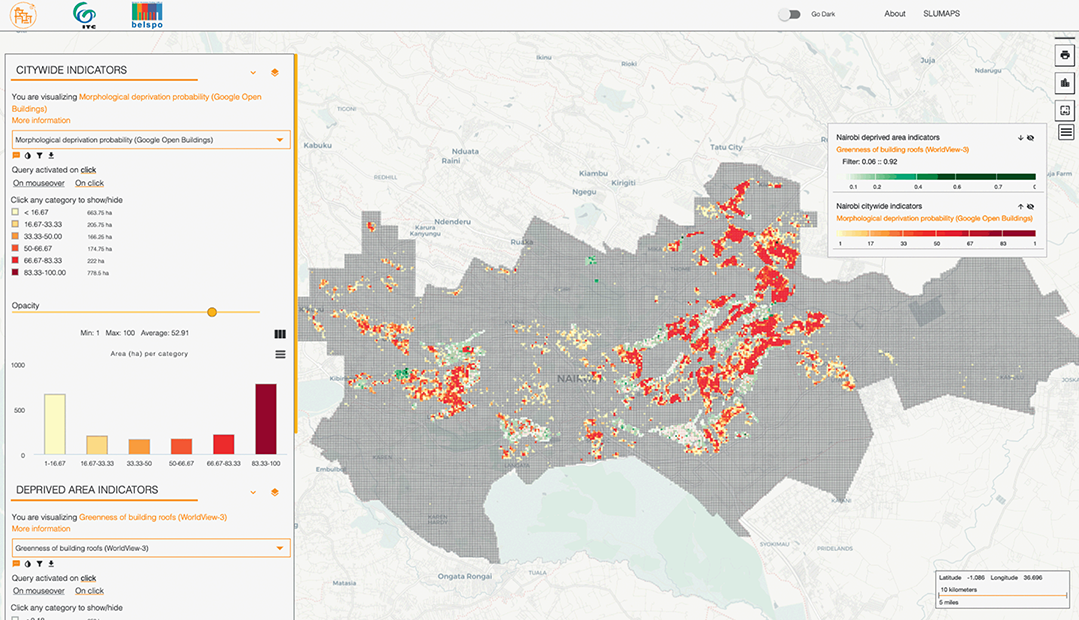
7 Challenges and Future Research
There are a number of limitations and constraints to further investigating the complex relations between climate change in cities and equity, development, and informality. Among them is a data gap, particularly in the cities of the Global South, which concerns data on hazards and risks of climate change at the local scale, for the whole urban system (both formal and informal areas).
Although mapping informal areas (e.g., by using GIS) has been advancing rapidly over the last two to three years (Georganos et al., Reference Georganos, Hafner, Kuffer, Linard and Ban2022; Kühnl et al., Reference Kühnl, Sapena, Wurm, Geiß and Taubenböck2022), climate change–related data gaps (regarding weather observations, weather stations, scenarios) further widen the existing data gap for informal areas regarding socio-economic, demographic, land use data. The need to access adequate information and downscale climate data in relation to informal city structure and climate projections in an accessible form is vital for climate action. Otherwise, there is a risk that future climate impacts are not considered in relation to existing informal settlements or when planning upgrading initiatives (Satterthwaite et al., Reference Satterthwaite, Archer, Colenbrander, Dodman, Hardoy and Patel2018).
The complexity of informality and lack of local data has been hindering local plans to take climate change action into consideration. Usually conducting a climate change assessment requires expertise that is not available at the local level, which adds to the cost of local planning efforts (GIZ, 2017; Schuck & Eissa, Reference Schuck and Eissa2018; Eissa & Khalil, Reference Eissa and Khalil2021). In addition, the lack of relevant expertise is apparent with much of the work focused on country-level issues rather than city level or district/neighborhood levels, especially in the Global South where most of the informal areas exist.Footnote 25 Moreover, lack of access to data and data sharing exacerbates the data gap even when relevant data are available as responsive actions become unattainable (Hardoy et al., Reference Hardoy, Gencer and Winograd2019).
Urban contexts pose challenges because of the dynamism that is a key characteristic of urban contexts across the world, but especially in the Global South. For example, in South Asia in the period 2000–2010, the population of those living in urban areas grew by almost 130 million (Ellis & Roberts, Reference Ellis and Roberts2016). This means that land use patterns and urban geo-morphology are changing very rapidly, making it virtually impossible to capture the variables necessary for effectively modeling hazard impacts. Investment and massive application of remote sensing technologies and GIS are now gaining prominence to address this highly dynamic challenge. Much of this expansion is taking the form of informal settlements, which means that the most vulnerable urban populations are represented least in these forms of data collection.
Urban areas are also highly diverse where people from different classes, ethnic backgrounds, linguistic groups, and professions reside near one another. This can lead to the emergence of disputes about justice, making the adoption of policies a challenge. This in turn poses challenges for the use of participatory approaches that are predicated on the generation of consensus and therefore require a degree of social homogeneity to deliver valid results (Bahadur & Tanner, Reference Bahadur and Tanner2021).
Participatory or collaborative processes require investment in training the population for inclusion to be effective and require time that governments often cannot or do not want to spend on the initiatives they lead. This means that the reality of vulnerable urban citizens is not captured effectively. Towns and cities are also dense where homesteads, especially in informal settlements, merge into one another. This poses challenges, for instance, making it difficult to ascertain the level of exposure to hazards in urban informal settlements using satellite pictures. Frequent assessments are essential.
Informal areas are often found on the fringes of planned urban settlements or in abandoned locations inside urban agglomerations. However, different relations could be found between informal areas and planned areas. There are limited studies that investigate the inter- and intra-relationships between planned and informal/unplanned areas around cities. Reciprocal relationships can be deduced based on studying aspects such as boundaries and borders, mobility and connectivity, and waste collection networks. Several overlaps, contradictions, and intersections can be drawn from such juxtapositions.
In a study conducted in the Greater Cairo Region, the identified neighboring typologies showed the complexity of relations among one of the biggest metropolitan areas in the Global South and the biggest arid city worldwide (Gad et al., Reference Gad, Attia and Khalil2022). Such relationships are very much related to resilience to climate change as it manifests in the responsiveness of existing infrastructures and urban systems with their formal and informal parts to various incidents. Relationship typologies also govern how interventions and deployment of solutions can address urgent vulnerabilities.
8 Conclusions
This Element explores the ways in which climate change risks and policy influence cities from the perspective of justice and informality (see additional resources Figure 7). Our findings show that vulnerable marginalized groups, often living in informal urban areas, pay a disproportionately heavier burden in terms of experiencing the impacts of climate change as well as outcomes from adaptation and mitigation responses. Those who are marginalized are often not recognized, nor do they participate in formal adaptation or mitigation planning processes, further exacerbating their situation. While there is initial discussion on loss and damage and restorative justice in the urban context, almost no measures exist to compensate for the unfair burden. Empirical evidence of how transformations affect justice and equity and the context of informality is largely missing. Any transformative initiatives that support climate-resilient development need to address the rights of all citizens and actively account for them during change.
This Element has found:
1) The literature stresses that procedural justice is a key component of transformation in climate-stressed cities. The inclusion of marginalized communities in public planning processes – with transparency and fairness – can set in motion a transformational approach to justice in cities that accounts for distributive, procedural, and potentially restorative justice.
2) Investing in monitoring and evaluation is a necessity to identify intended and unintended consequences of past and current adaptation policies and actions.
3) Including vulnerable communities and social groups in documenting, monitoring, and evaluating is vital, as their inclusion may help avoid or course-correct unintended consequences of climate-related adaptation and mitigation responses in cities.
4) Enabling learning from in-point adaptation, mitigation, and monitoring activities institutionalizes principles of equity and justice in the urban management, administration, and policy realm. When doing so, take the bureaucracy of an urban setting into account.
5) Regarding distributive justice, prioritize funding and resources for vulnerable, particularly low-income and marginalized groups, especially for those living in informal settlements, and build socio-technical capacities in these communities to understand climate science, early warning, climate impacts and response outcomes (e.g., by increasing access to easy-to-comprehend information, promoting networking, and sharing of good practices).
6) For recognitional and restorative justice, less information is documented in scientific literature. However, evidence points toward the importance of identifying the most significant contributors of urban emissions as well as the most impacted social groups in urban environments and to include both in decision-making processes. The inclusion of currently vulnerable and marginalized groups would support a move toward restorative justice with the goal of climate-resilient development for all.
This Element identifies the need to accumulate the evidence base of how justice and equity mediate the development of urban areas, particularly in terms of informality. While there is increasing evidence of unequal distribution of climate impacts globally, further steps need to be taken at the city-scale to document, through citizen science methodologies, not only the impacts of climate change but also the implementation and outcomes of adaptation and mitigation.
For adaptation, this means to go beyond low-hanging fruit such as urban green solutions, for example, that tend to favor more affluent areas, demonstrating the unequal distribution of benefits of climate responses. For mitigation, this means turning the research agenda toward questions of fairness and well-being in terms of GHG reduction measures and going beyond emissions calculations. Transforming urban areas to support climate-resilient development also means monitoring and evaluating systematic evidence in terms of what implications these have for vulnerable groups and how transformative processes may alter power balances in urban areas.
Appendix: Stakeholder Sounding
Stakeholder Sounding Workshops are vitally important aspects of the Assessment Reports on Climate Change and Cities series. They are essential to every assessment we do as part of UCCRN. On April 21, 2022, the Justice Coordinating Lead Authors met with city stakeholders from Copenhagen, Durban, Grandquevilly, Gujarat, Lagos, Philadelphia, Rio de Janeiro, and São Paulo. In that workshop, we discussed the preliminary findings of the Element and received critical feedback as regards scope and breadth of the presented information as well as relevance and applicability for implementation.
Insights from Stakeholders
Understanding the legacy of environmental injustice – In some cities, public development is aligned with the Sustainable Development Goals (e.g. SDG 16 on Peace, Justice, and Strong Institutions), and building stronger public-private partnerships can accelerate progress. Cities, such as Philadelphia, are using place-based initiatives and assessing economic development of specific neighborhoods to consider the interconnectedness between historical injustices and environmental justice. In Bogotá, the city’s master plan includes the creation of “Care Blocks” which will enhance women’s access to city services in their respective neighborhoods, including professional development, wellness promotion, and income-generation.
Working across government sectors – Impactful climate adaptation and mitigation requires strong coordination across government sectors. Cities like Rio de Janeiro recognize that enhancing climate knowledge among political leaders is necessary to advance integrated climate actions across national, subnational, and city levels.
Collecting localized data that enables city planning – There is widespread need for more precise, high-resolution, location-specific data. Stakeholders request actionable data that addresses immediate and acute needs like economic impact data and flood vulnerability information. Cities such as Durban have begun measuring how heavy precipitation and storms affect stream flow but have identified a lack of connectivity between extreme event data and public sector emergency responses.
Monitoring and evaluating climate indicators – By tracking climate indicators, spatially and temporally, cities can evaluate the effectiveness of adaptation actions while ensuring that urban strategies account for changing environmental conditions. Cities like Barcelona stress the need for indicators related to health, for example, the relationships between heat and mortality, and energy poverty and health.
Acknowledgments
We thank UCCRN South Africa Hub Director Sean O’Donoghue for his excellent shepherding of this Element. Jaad Benhallam and Natalie Kozlowski of the UCCRN Secretariat provided outstanding editorial and graphic support. We greatly appreciate the constructive reviews of the Element by Katherine Cann, David Dodman, Sofia Fernandes, David Resnik, Hartmut Fünfgeld, and David Satterthwaite. UCCRN acknowledges support from NASA (WBS 509496.02.80.01.16) for this publication.
Coordinating Lead Authors
Diana Reckien, University of Twente, Enschede and Berlin
Sirkku Juhola, University of Helsinki, Helsinki
Lead Authors
Anika Nasra Haque, University of York, York
Heba Allah Khalil, Cairo University, Cairo
Maria Fernanda Lemos, Pontifical Catholic University of Rio de Janeiro (PUC-Rio), Rio de Janeiro
Shuaib Lwasa, International Institute of Social Studies, The Hague
Leila Niamir, International Institute for Applied Systems Analysis (IIASA), Laxenburg
Juan Camilo Osorio, School of Architecture, Pratt Institute, New York City
Cristina Visconti, University of Naples Federico II, Naples
Contributing/Case Study Authors
Aditya Bahadur, International Institute for Environment and Development (IIED), Delhi
Chiara Camponeschi, Institute for Global Health Research, York University, York
Belen Olaya García, National Autonomous University of Mexico, Mexico City
Alejandra Marcela Vanegas Díaz, National University of Río Negro, Viedma
Gerard Martínez Görbig, University of Twente, Enschede
Michelle Mycoo, University of the West Indies, Saint Augustine
Wilma S. Nchito, University of Zambia, Lusaka
Basirat Oyalowo, University of Lagos, Lagos
Sheetal Patil, Indian Institute for Human Settlements, Bengaluru
Emma Porio, Ateneo de Manila University, Manila
Paula Presser, University of Twente, Enschede
Chandni Singh, Indian Institute for Human Settlements, Bengaluru
UCCRN Editorial Board Shepherd
Sean O’Donoghue, eThekwini Municipality, Durban
Series Editors
William Solecki
New York
William Solecki is a Professor in the Department of Geography at Hunter College, City University of New York (CUNY). From 2006–2014 he served as the Director of the CUNY Institute for Sustainable Cities at Hunter College. He also served as interim Director of the Science and Resilience Institute at Jamaica Bay. He has co-led several climate impacts studies in the greater New York and New Jersey region, including the New York City Panel on Climate Change (NPCC). He was a Lead Author of the Urban Areas chapter in the Fifth Assessment Report of the Intergovernmental Panel on Climate Change (IPCC), and a Coordinating Lead Author of the Urbanization, Infrastructure, and Vulnerability chapter in the Third National Climate Assessment (US). He is a co-founder of the Urban Climate Change Research Network (UCCRN), co-editor of Current Opinion on Environmental Sustainability, and founding editor of the Journal of Extreme Events. His research focuses on urban environmental change, resilience, and adaptation transitions.
Minal Pathak
Ahmedabad
Minal Pathak is an Associate Professor at the Global Centre for Environment and Energy at Ahmedabad University, India. She is a Senior Scientist with the Technical Support Unit of Working Group III of the IPCC for its Sixth Assessment cycle. She has contributed to two IPCC Special Reports, co-edited the IPCC Sixth Assessment Report, and contributed to the recently published IPCC Sixth Assessment Synthesis Report. She heads the South Asia Hub of the UCCRN, headquartered at the Columbia Climate School. She was a Visiting Researcher at Imperial College London (2017–2023) and a Visiting Scholar at MIT (2016–2017). Her research focuses on climate change mitigation strategies for urban settlements, transport, and buildings, and their co-benefits/interlinkages with development.
Martha Barata
Rio de Janeiro
Martha Barata is Coordinator of the Latin America Hub of the UCCRN, headquartered at Columbia Climate School. Barata is a collaborating researcher at the Oswaldo Cruz Institute (Fiocruz) and CentroClima (COPPE/UFRJ), following retirement from the Oswaldo Cruz Foundation in 2017. She was a Visiting Scholar in the Center for Climate Systems Research at Columbia University in 2014, conducting research on climate risk management in cities.
Aliyu Salisu Barau
Kano
Aliyu Salisu Barau is a Professor in Urban Development and Management at the Department of Urban and Regional Planning and Fifth Dean of the Faculty of Earth and Environmental Sciences at Bayero University in Kano, Nigeria. He is a transdisciplinary researcher with interests in climate change, landscape ecology, clean energy, socio-ecological systems, sustainability agenda setting, informally and formally protected ecosystems, special economic zones, and inclusive and innovative planning. He contributes to the research, policy, and action agenda in Nigeria and globally through engagements with UN Environment, IPCC, Future Earth, IUCN, IPBES, IIED, UNICEF, and UN Habitat. He is also the director of the West Africa Center for the UCCRN at Columbia University in New York.
Maria Dombrov
New York
Maria Dombrov is a Senior Research Associate I at the Climate Impacts Group, co-located at NASA Goddard Institute for Space Studies and Columbia University’s Center for Climate Systems Research, in New York City. Ms. Dombrov is UCCRN’s Global Coordinator and the Project Manager of UCCRN’s Third Assessment Report on Climate Change and Cities (ARC3.3). Her work focuses on understanding the risks and vulnerabilities that climate change and extreme events present to cities and their metropolitan regions around the world.
Cynthia Rosenzweig
New York
Cynthia Rosenzweig is a Senior Research Scientist at the NASA Goddard Institute for Space Studies (GISS), Adjunct Senior Research Scientist at the Columbia University Climate School, and Adjunct Professor in the Department of Environmental Science at Barnard College. At NASA GISS, she heads the Climate Impacts Group, whose mission is to investigate the interactions of climate on systems and sectors important to human well-being. Dr. Rosenzweig is Co-Founder and Co-Director of the Urban Climate Change Research Network (UCCRN). She was co-chair of the New York City Panel on Climate Change (NPCC). Dr. Rosenzweig has served as coordinating lead author and lead author on several IPCC Assessment Reports.
About the Series
This Elements series, published in collaboration with the Urban Climate Change Research Network (UCCRN), provides essential knowledge on climate change and cities for researchers, practitioners, policymakers, and students. Bridging the gap between theory and practice, the series invites readers to engage with the latest advances in the field. Focusing on urban transformation, cross-cutting themes, and urgent research areas, it empowers stakeholders to drive impactful climate action in rapidly-evolving urban contexts.


 Open access