1 Introduction
1.1 Ethnic Bloc Voting
The role of social identities, and in particular ethnicity, in democratic politics has captured the interest of political scientists for well over seventy years (Key, Reference Key1949; Lipset and Rokkan, Reference Lipset and Rokkan1967; Dahl and Tufte, Reference Dahl and Tufte1973; Horowitz, Reference Horowitz2000; Chandra, Reference Chandra2007). While the politicization of social identities is readily observed around the world, a generalized understanding of what makes members of a particular group more likely to coordinate their votes toward a single party or candidate remains elusive. Ethnic identities are a particularly strong and pervasive subset of social identities. The impact of ethnic group size and other features is routinely analyzed and discussed, but rarely tested cross-regionally and over multiple identity dimensions. Individuals are arranged in “crosscutting” patterns, meaning that those affiliated with one identity group are nearly always diverse across other social identity dimensions. Critically, scholars also lack a broader test of how ethnic identities interact with political institutions. This Element seeks to answer the following question: How do the characteristics of ethnic groups, particularly size and crosscutting patterns, interact with political institutions to determine bloc voting?
There are numerous complicating factors, both theoretical and methodological, that affect such a study. These include challenges related to adequately measuring distinctive ethnic groups, varying salience of membership or identification, specific relationships between groups, and overlapping patterns of membership across identity dimensions. These theoretical constructs are still debated by social scientists. Ethnic groups also operate within different political, economic, cultural, and historical contexts, and thus, analyses must also incorporate country-level conditions. Because many of the best studies of the relationships between social identity and politics focus on a single country and/or type of social identity, scholars have tended to deemphasize a general theory on the role of ethnic cleavages in democratic politics. However, the leading cleavage theories are often – explicitly or implicitly – treated and discussed as generalizable.
A diverse array of literatures on social group behavior are relevant to understanding ethnic group voting. The study of group coordination has led to siloed theoretical constructs among the various social science disciplines, including psychologists studying the determinants of group participation and belonging, conflict scholars examining the role of ethnicity in civil wars and violence, economists studying the role of ethnic diversity on economic growth, sociologists considering the formation and intersection of social identities, and political scientists surveying the connection between demographics and political behavior. The core theoretical implications for some of these social cleavage literatures are overviewed in Section 3, with seemingly contradictory expectations around block voting between small- and medium-sized groups.
What is especially urgent is a generalized understanding of how ethnic group characteristics interact with political institutions to generate different rates of bloc voting. This topic has garnered significant interest in political science and has received the greatest amount of attention surrounding the interplay between social cleavages and political institutions and how this affects party system development (Cox, Reference Cox1997; Benoit, Reference Benoit2007; Neto and Cox, Reference Neto and Cox1997; Clark and Golder, Reference Clark and Golder2006). Yet, there is little consensus on what arrangements translate to the highest degree of bloc voting across political systems.
1.2 Contributions
Social scientists sometimes speak as if ethnic identities are influential in some countries and not others due to differing historical, economic, and social circumstances. While, of course, the expression of ethnic identity in politics is highly contextualized, we should also expect that political institutions interact with group characteristics, which in turn influence individual vote choice. Several quantitative analyses exploring the determinants of bloc voting have focused on a specific region or country, but grappling with the breadth of such findings requires a broader geographic scope that encompasses the variation across social and political experiences, as well as various political institutions.
To capture these dynamics, this Element scrutinizes voting patterns at the group level, but based on individual-level survey data and controlling for and interacting with country-level variables. This yields findings that advance our understanding of how ethnic group characteristics interact with political institutions and reinforce the critical role of crosscutting patterns. Specifically, this Element makes the following contributions to the study of ethnic identity and vote coordination:
1. Identifies the conflicting expectations within the core social identity theories related to characteristics like group size and expected degrees of political salience.
2. Creates and tests one of the most comprehensive datasets on ethnic group bloc voting by number of countries and groups.
3. Creates indicators measuring the crosscutting nature of ethnic groups using the framework of multiple identities.
4. Argues for and leverages a more intuitive bloc voting measure compared to fractionalization scores.
5. Is the only study to test the interaction between three key dynamics – group size, degree of crosscutting, and political institutions, as far as the author is aware.
The compiled dataset comprises 2,555 ethnic groups, which can be broadly categorized as heritage or religious-centric, across 115 countries. The outcome of interest is the degree to which social group members coordinate their votes around a single political party as a vehicle for accessing political power, also referred to as bloc voting. This research design enables the comparison of the validity of central social cleavage theories, not only in relation to one another but also in relation to the political systems that significantly influence voting logic.
1.3 Key Findings
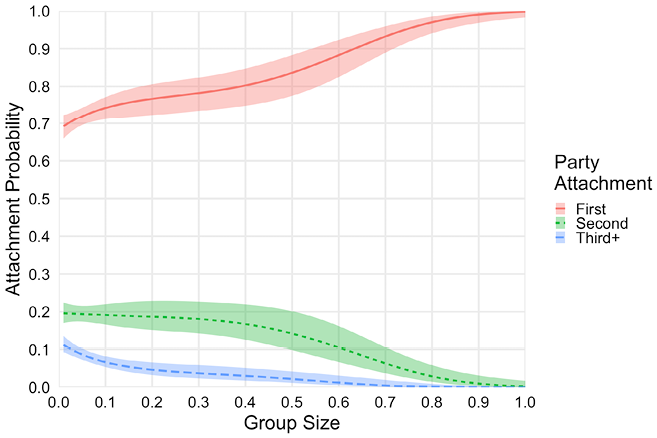
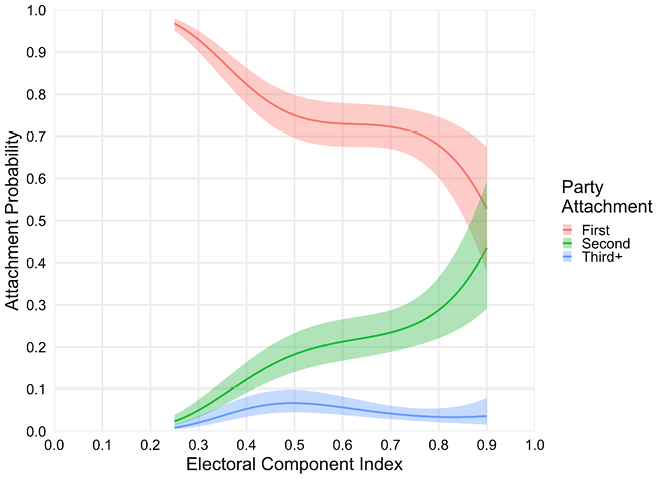
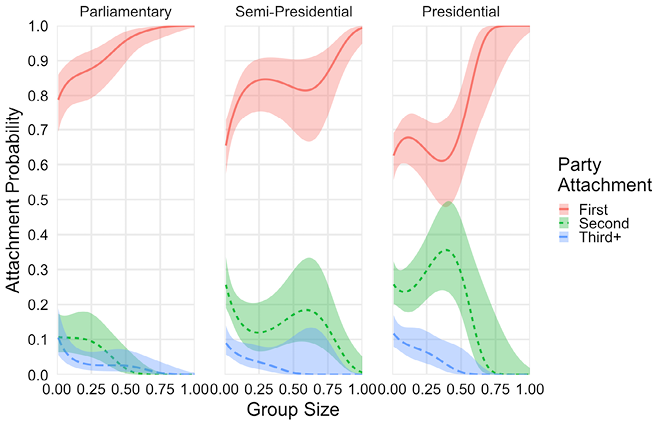
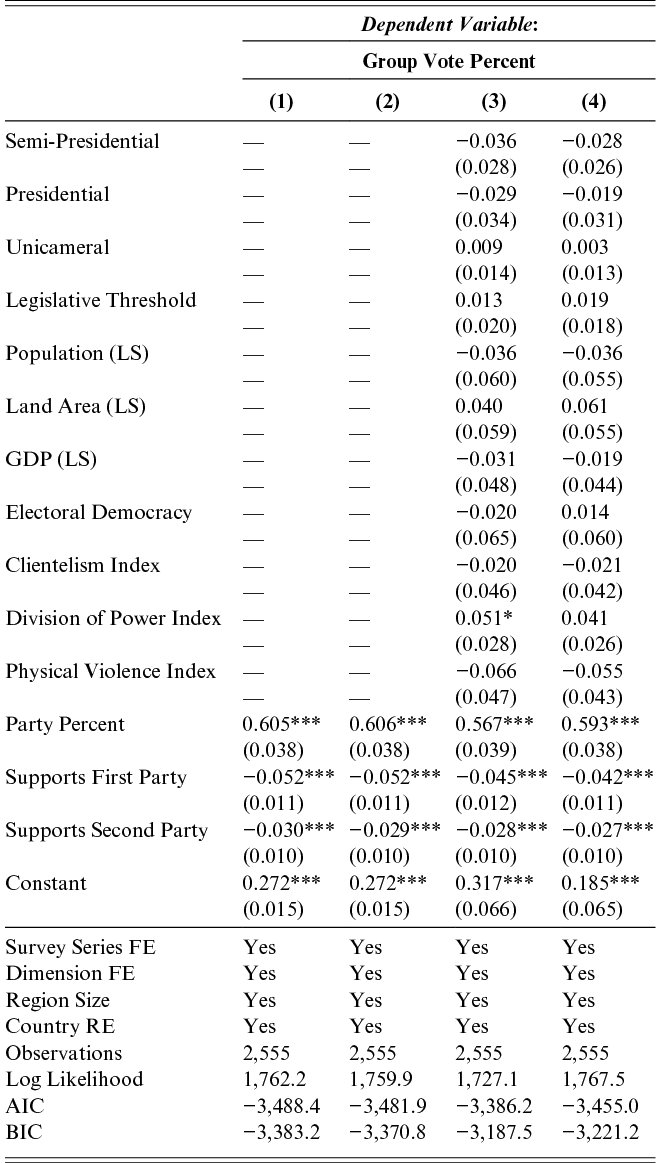
It is at the intersection between ethnic group characteristics and political institutions that a more generalizable understanding of group voting patterns is found. First, the reasons for supporting different parties are analyzed – do ethnic groups primarily support the most popular party at the time of data collection, the second most popular party, or a third-ranked or less popular party? Here, institutions play a vital role. While larger groups, on average, increasingly tend to support the first-ranked party, in presidential systems, ethnic groups that represent less than 50% of the population are also highly motivated to support the second-ranked party relative to parliamentary and semi-presidential countries. Electoral quality also has a dramatic effect of encouraging ethnic groups to support parties that are not the first-ranked party.
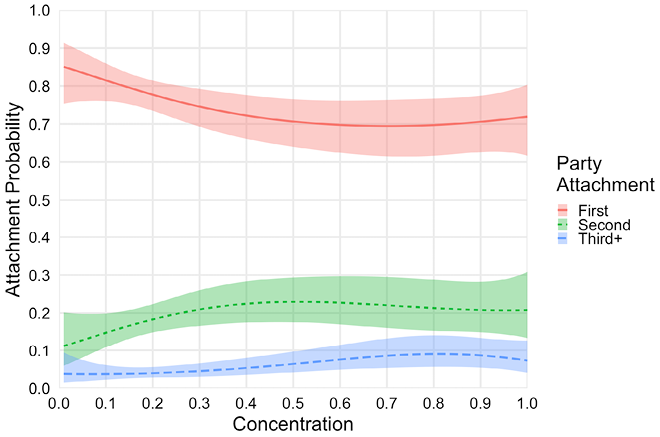
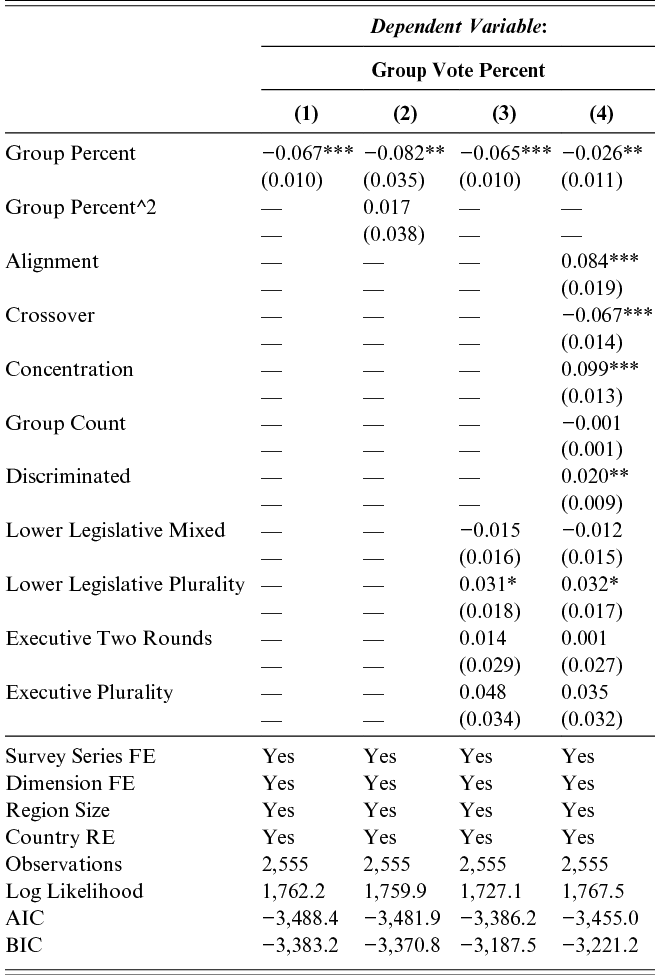
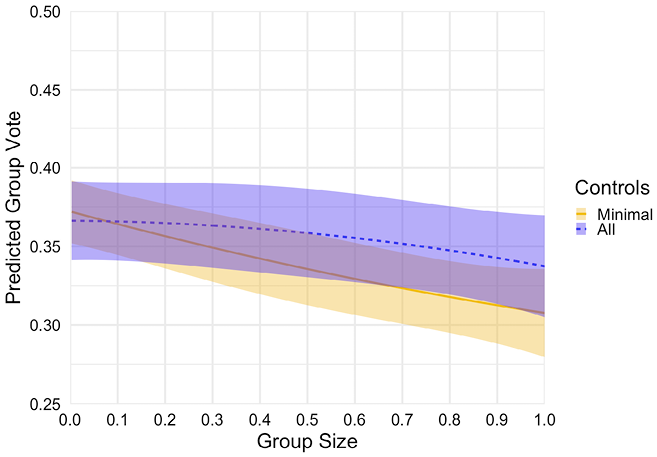
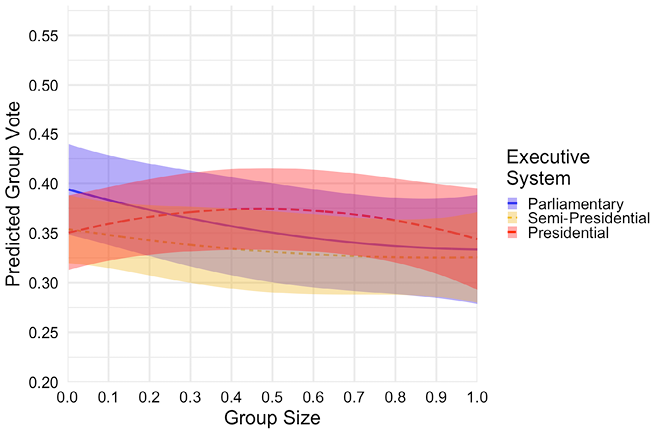
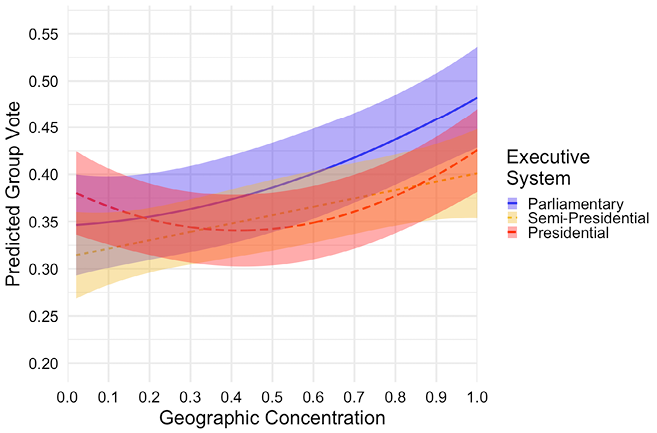
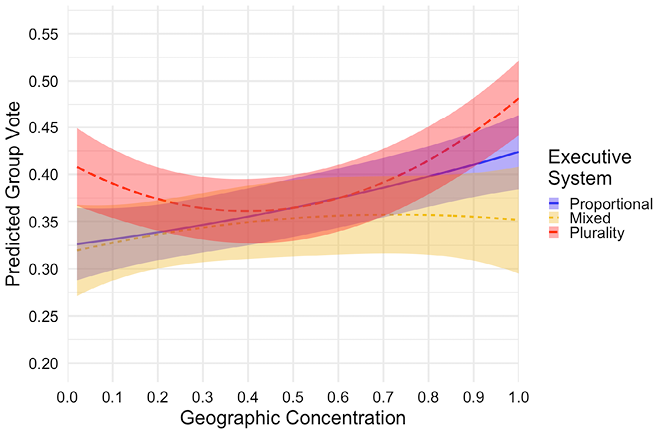
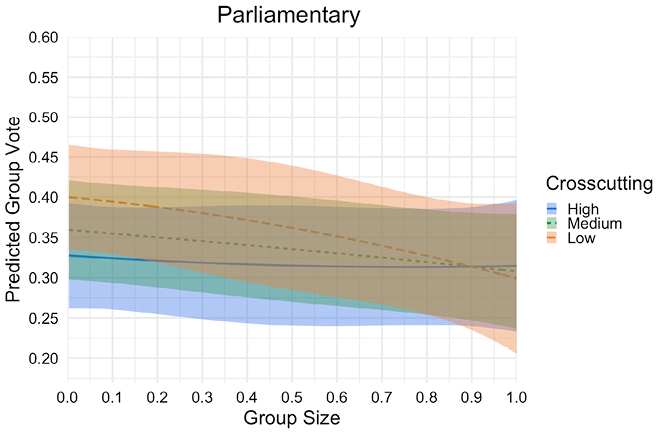
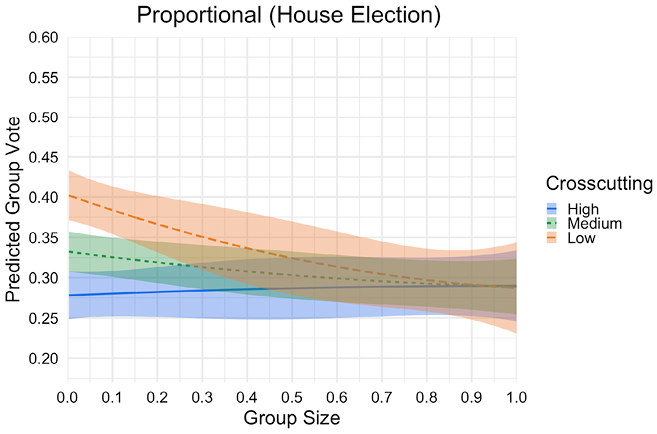
When testing with minimal controls, the analysis shows that smaller groups experience stronger group vote coordination, and that this is most prevalent among groups in parliamentary systems. Critically, multiple group characteristics are correlated with the size of ethnic groups. When additional group-level characteristics are modeled, three indicators are shown to be highly influential: the geographic concentration of groups, the internal social alignment of group members, and the degree to which all group members are similar to or different from the rest of the population. The last two variables are measures of “crosscutting,” which considers multiple ethnic identity dimensions, and their combined influence is the strongest predictor of bloc voting. Thus, smaller, more distinctive, and more geographically concentrated groups are much more likely to engage in bloc voting. Overall, the models show that social separation or feelings of difference are the main mechanisms driving bloc voting.
Many scholars have also posited that ethnic group size interacts with a country’s political institutions to influence both political salience and vote coordination. This Element compares the effects of “restrictive” institutions, including presidential executive systems and plurality election rules, to more “permissive” institutions such as parliamentary systems and proportional electoral rules. Indeed, in most cases, permissive institutions relate to group characteristics in relatively intuitive and straightforward ways – feelings of difference are exacerbated, leading to higher rates of bloc voting for smaller ethnic groups, and/or those that are characterized by geographically concentrated, greater internal alignment, lower crossover to other identity types, and greater discrimination. These are the expectations consistent with much of the relevant literature.
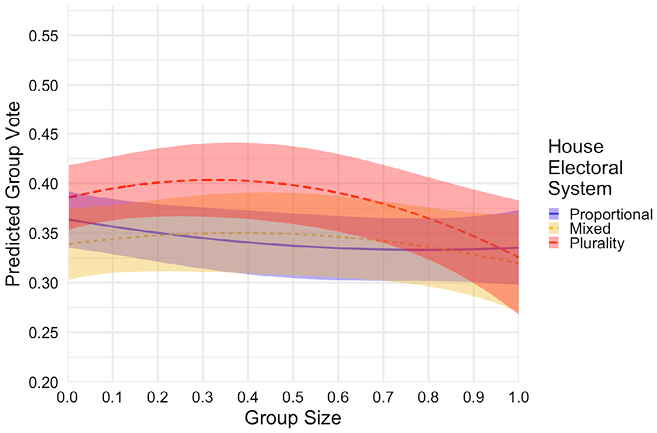
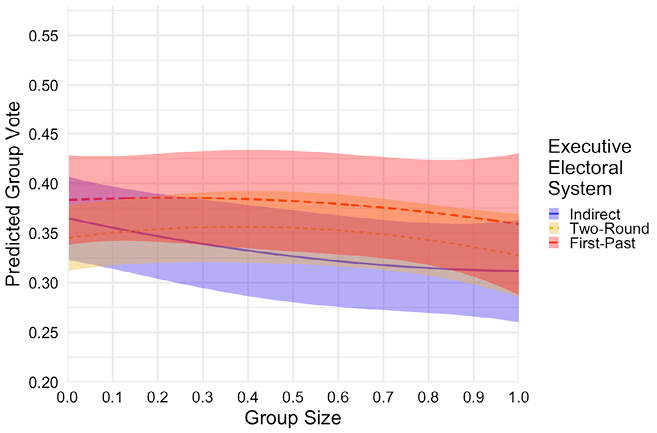
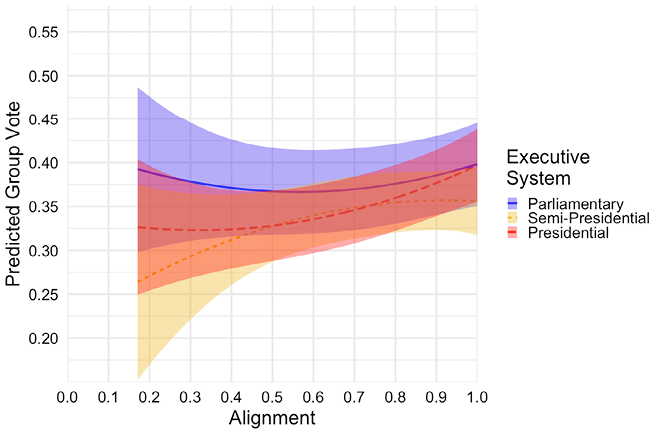
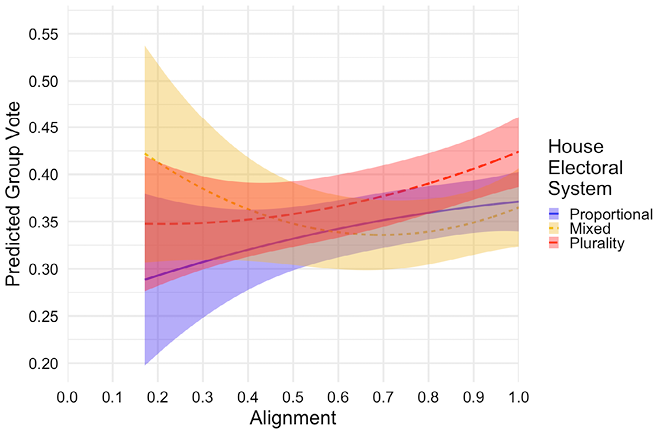
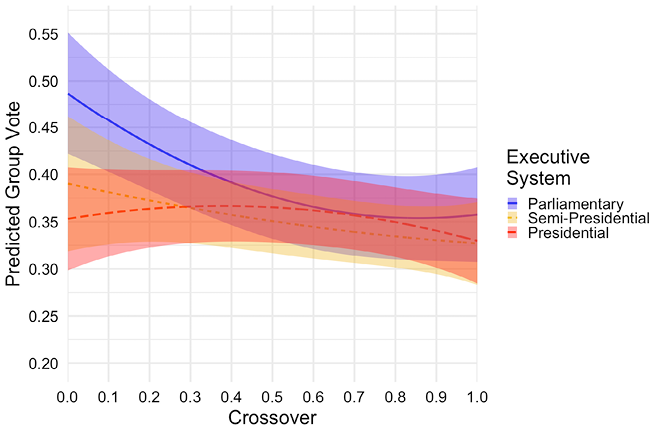
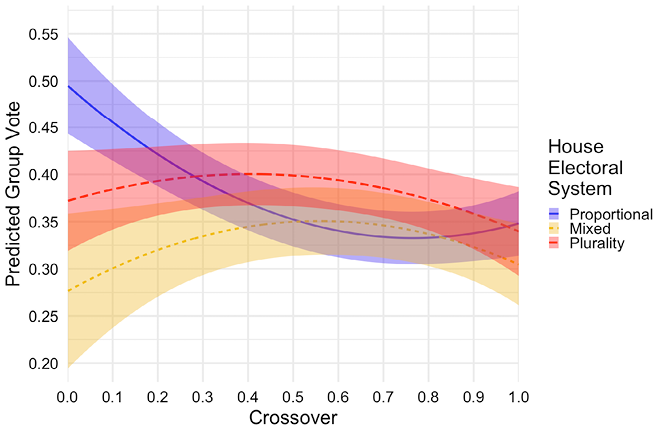
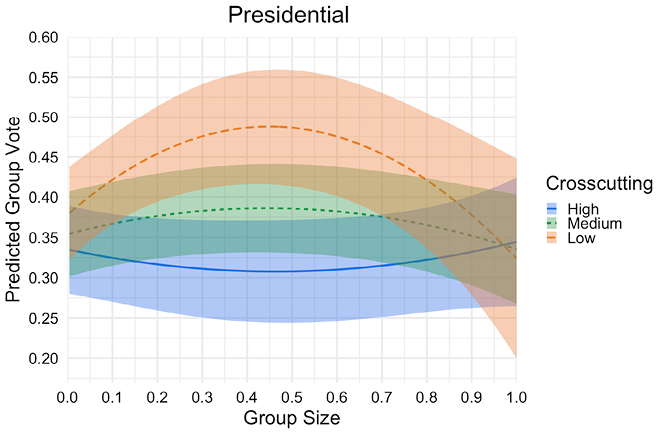
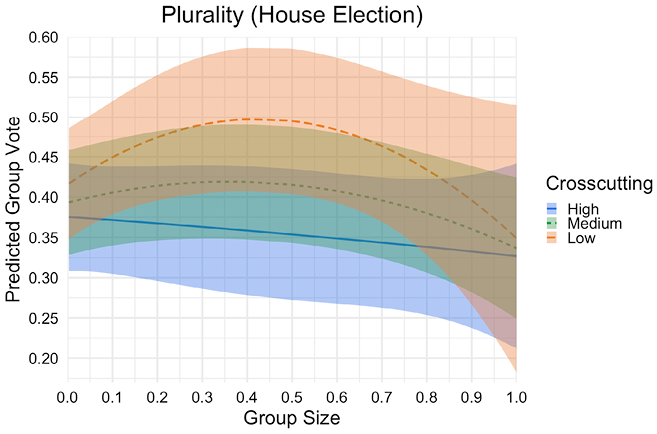
How group characteristics relate to bloc voting in restrictive institutional settings is more complex. The findings from presidential systems and countries with plurality rules for legislative elections show that bloc voting is somewhat higher among medium-sized ethnic groups (around 30–50% of the population), which also affirms previous work that members of such groups experience a greater incentive to vote as a bloc to be part of the winning coalition. The most dramatic effects among ethnic groups in restrictive institutional settings, however, come when crosscutting is interacted with group size. In restrictive political environments, it is medium-sized ethnic groups with low crosscutting that experience the highest rates of bloc voting. Overall, the findings emphasize the importance of analyzing multiple identities in concert, as well as considering how group characteristics interact with political institutions to draw out generalizable patterns of bloc voting.
1.4 Organization
The Element is organized into eight sections. Following this introduction, Section 2 surveys a vast literature on social identities and ethnicity, and their interactions with political organizations, institutions, and behaviors. Building upon this foundation, Section 3 tracks a non-exhaustive list of theories that present relevant expectations for the situation in which ethnic group members should experience the highest incentives to coalesce their voting power, with the key distinction being those that prioritize small groups and those that prioritize medium-sized groups.
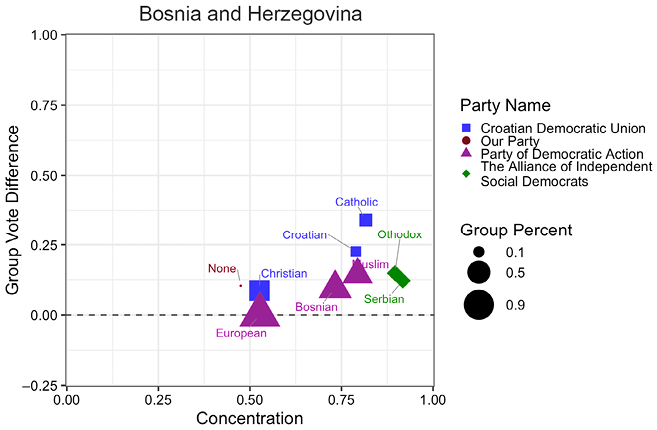
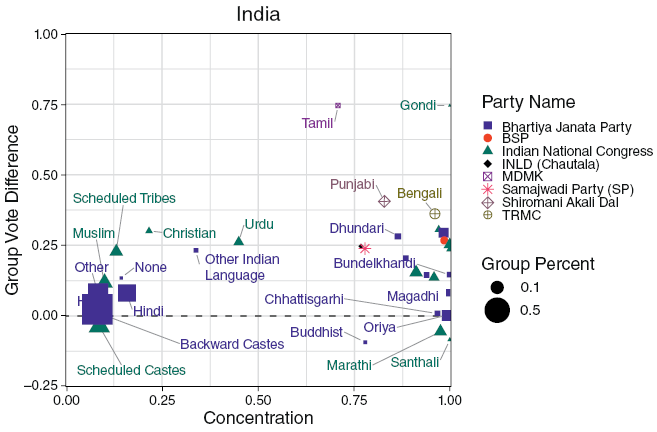
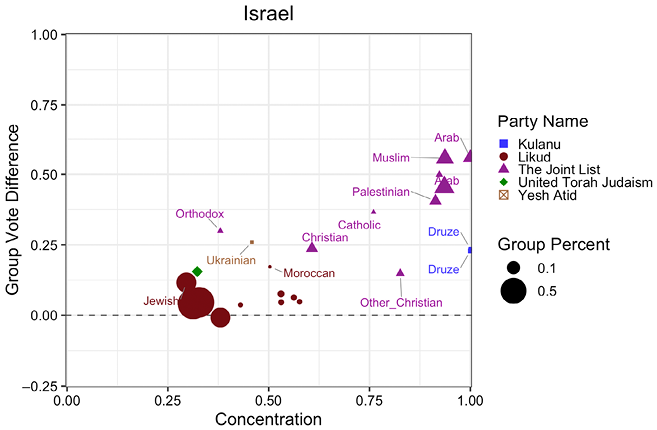
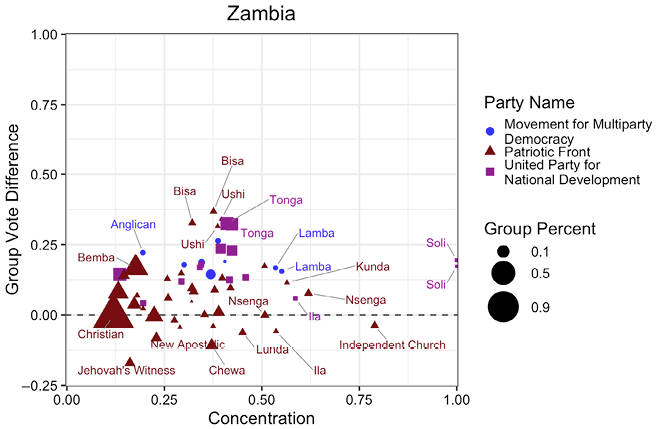
Section 4 turns to the methodological approach and data collection, with special attention paid to how bloc voting is measured and how the crosscutting identity variables are constructed. With the dataset in hand, Section 5 presents four illustrative mini-case studies in which ethnic identities have played important roles in politics – Bosnia and Herzegovina, India, Israel, and Zambia. The descriptive statistics are not meant to test certain propositions but aid the reader in understanding the dataset.
Sections 6 and 7 conduct the main statistical analyses to evaluate the key predictors of bloc voting. First, Section 6 presents the base findings, including descriptive statistics, the predictors of why ethnic groups attach to different political parties, and the correlates of bloc voting without interactions across group characteristic variables and country conditions. Section 7 delves into the interactions between group size and political institutions, crosscutting and political institutions, and then all three dimensions. Section 8 summarizes the findings in light of the four theoretical propositions.
2 The Politics of Ethnic Identities
Social identification entails the cognitive awareness of and affiliation with a group of persons. This attachment provides personal value, involves emotional investment, and enables the categorization of others, resulting in perceived differences between social groups (Tajfel, Reference Tajfel1982; Ashford and Mael, Reference 85Ashford and Mael1989). While social group identities may reflect physical features, social scientists generally consider all social identities to be created and reshaped by humans (Bourdieu, Reference Bourdieu1987; Jenkins, Reference Jenkins2014; Turner et al., Reference Turner, Hogg, Oakes, Reicher and Wetherell1987). The terms “social group” or “identity” encompass a broad range of possible expressions. The groups analyzed in this Element fall under the term “ethnicity,” which Chandra (Reference Chandra2006, Reference Chandra2012) argues should more narrowly apply to ancestry-based social attributes. While all social identities are unique, a rich scholarly tradition has sought to tease out patterns and underlying logics around how ethnic identities are formed, persist, or shift, and how they are leveraged or expressed in politics.
2.1 Social Identity Theory
Social identities are ubiquitous across time and space because, despite the negative manifestations of racism, exclusive nationalism, and religious extremism, they provide people with a mental categorization tool to reduce uncertainty as they navigate the world (McAuliffe et al., Reference McAuliffe, Jetten, Hornsey and Hogg2003; Abrams and Hogg, Reference Abrams and Hogg2006; Hogg, Reference 92Hogg, Schwartz, Luyckx and Vignoles2007). More specifically, social categories “fulfill individual and societal needs for order, structure, simplification, and predictability” (Akerlof and Kranton, Reference Akerlof and Kranton2000). Individuals regularly traverse the world through the categorization of both themselves and others into social identity groups, each with specific meanings (Allport, Reference Allport1954; Tajfel, Reference Tajfel1982; Chaiken, Reference Chaiken, Chaiken and Trope1999).
Social identity groups do not exist formally in most cases, though there are notable and often disastrous examples of repressive regimes codifying and integrating social hierarchy formally into society. Instead, most social scientists recognize identification with a particular social group as a psychological state (Tajfel, Reference Tajfel1981; Akerlof and Kranton, Reference Akerlof and Kranton2000). In most cases, the idea of a social group is formed and reinforced through symbolic boundaries, resulting in “imagined communities” (Anderson, Reference Anderson2006). As Bourdieu (Reference Bourdieu1987) states, “Groups are not found ready-made in reality … they are always the product of a complex historical work of construction” (9). The ideas and concepts that define social groups are thus the results of both everyday practices from the bottom up as well as elite actions from the top down (Brubaker Reference Brubaker2004; Barth Reference Barth1969).
The exercise of categorizing oneself and other people appears to be a basic function of the human mind, the drive to compare various objects or persons working to discern similarities and differences between them (Fryer and Jackson, Reference Fryer and Jackson2008). Humans often then work to place themselves in relation to other objects or persons, focusing on the perceived degree of similarity (Terry, Hogg, and White, Reference Terry, Hogg and White1999; Jenkins, Reference Jenkins2014). When examining others, this nearly always involves stereotyping (Jenkins, Reference Jenkins2014; Zerubavel, Reference Zerubavel1997).Footnote 1 The categorization of oneself and others into these social categories inevitably results in ingroup favoritism among those who share membership (Tajfel, Reference Tajfel1982; Balliet et al., Reference Balliet, Wu and De Dreu2014; Koch et al., Reference Koch, Imhoff, Dotsch, Unkelbach, Alves and Nelson2016).
In-group favoritism and feelings of trust are partially driven by reciprocity and the expectation of cooperation (Balliet and Van Lange, Reference Balliet and Van Lange2013; Balliet et al., Reference Balliet, Wu and De Dreu2014). The similarity in experiences breeds stronger connections between people, and factors such as kinship, heritage, beliefs, and geography create more interactions and feelings of connection. Social networks and personal connections influence behaviors (McPherson, Smith-Lovin, and Cook, Reference McPherson, Smith-Lovin and Cook2001) and help overcome coordination or “free-rider” problems (Hechter and Okamoto Reference Hechter and Okamoto2001; Simpson and Macy Reference Simpson and Macy2004). One study from Uganda shows that in-group favoritism manifests through perceiving comembers as being more likely to be part of one’s social network, which would, in turn, enable greater monitoring and sanctioning between members (Habyarimana et al., Reference Habyarimana, Humphreys, Posner and Weinstein2007).Footnote 2 Other experimental research shows that knowing that a group is composed of persons from your social group (ethnicity), increases cooperation over situations of not knowing or knowing that they are from a different group (Chuah et al., Reference Chuah, Santana-Gonzalez, Hunt and Garretsen2014).
The categorization of others, however, commonly reinforces negative assumptions and stereotypes, leading to bias (Wilder, Reference Wilder and Berkowitz1986). As observed in countless historical instances, the favoring of those who identify as the same social group often generates social inequalities, and power imbalances have resulted in justification for colonization, discrimination, oppression, slavery, and violence. Despite growing social equality in many places over the past centuries and rising levels of income and education, analyses indicate that citizens can easily identify different types of social identities within their society and consistently rank which groups are more or less powerful in wealthy countries like the United States (Koch et al., Reference Koch, Imhoff, Dotsch, Unkelbach, Alves and Nelson2016; Zou and Cheryan, Reference Zou and Cheryan2017). Exclusion, even artificial or temporary, generates negative emotions, and individuals associated with excluded groups may conform more to group norms due to a heightened salience of identity (Picket and Brewer, Reference Pickett, Brewer, Abrams, Hogg and Berkowitz2005).
While the specific manifestations of social identities are idiosyncratic, shaped by geography and history as well as countless more immediate social, economic, and political forces, many scholars studying social identity view the underlying dynamics as broadly generalizable. As two leading scholars conclude, “Even if social identity is manifested differently cross-culturally, the extent and underlying processes of social identification seem to be the same” (Abrams and Hogg, Reference Abrams, Hogg, Hogg and Cooper2010, 184). Thus, while direct comparison between social groups across societies and countries will always omit some important contextual information, the continual formation, sorting, application, and assessment of social identities across human history points to a widespread, enduring phenomenon that is not likely to abate any time soon.
2.2 Ethnicity
Many studies on social identities focus on one type of identity at a time (Stoll, Reference Stoll2008); for example, studying the effects of linguistic diversity on economic growth across countries. Still, nearly all scholars recognize there exist multiple salience forms or dimensions of social identities among a group of people (Tajfel and Turner, Reference Tajfel and Turner1979; Huddy, Reference Huddy2001; Kang and Bodenhausen, Reference Kang and Bodenhausen2015), and individuals simultaneously hold and evaluate these in concert, sometimes referred to as “intersectionality” (Cho, Crenshaw, and McCall, Reference Cho, Crenshaw and McCall2013; Davenport, Reference Davenport2018; Collins and Bilge, Reference 88Collins and Bilge2020). Social identities around gender, sexuality, class, income, education, region, and occupation, among others, also play salient roles in social and political life in many places around the world. Which types of social identities are the most salient is thus highly contextualized, though in seemingly all cases, multiple salience identity dimensions are recognized.
A central category of social identities is “ethnicity.” Establishing what groups or attributes should be included under the heading of ethnicity remains unsettled, but a meaningful consensus has formed around Chandra’s (Reference Chandra2006, Reference Chandra2012) definition, which clarifies an approach similar to Horowitz’s (Reference Horowitz2000) – that ethnicity should be considered a broad umbrella term for attributes related to heritage. For Horowitz (Reference Horowitz2000) this includes “group deafferented by color, language, and religion; it covers ‘tribes’, ‘races’, ‘nationalities’, and ‘castes’” (p. 53). Chandra (Reference Chandra2012) specifically defines ethnicity as requiring “decent-based attributes” (p. 51), which range in their stickiness (ability to shift), personal salience (activation), and visibility (physically or verbally observers). Notably “decent-based attributes” may be “acquired through genetic inheritance … or through cultural and historical inheritance … or in the course of one’s lifetime as markers of such an inheritance” (p. 59). This means that nongenetic attributes should be included, such as cultural traditions, language, or religious beliefs passed from parents to children. Thus “ethnicity” used in this broad way may include identities described as “religion, sect, language, dialect, tribe, clan, race, nationality, region, and caste of one’s parents and ancestors” (Chandra, Reference Chandra2012, p. 61). In many cases, both major religions and religious sects or denominations are included under the heading of ethnic identities (Alesina et al., Reference Alesina, Devleeschauwer, Easterly, Kurlat and Wacziarg2003; Fearon, Reference Fearon2003).
Like social identities more broadly, most scholars do not view ethnic identities as fixed in that individuals never change or deactivate membership (Barth, Reference Barth1969; Posner, Reference Posner2004a; Brubaker, Reference Brubaker2004). At the same time, ethnic identities should be considered “sticky” or difficult to change over the short term (Chandra, Reference Chandra2012; Ferree Reference Ferree2012). Increasingly, key scholarship argues that ethnic identities range in their salience among members (Chandra, Reference Chandra2007; Harris, Reference Harris2022), and even membership identification may be influenced by political dynamics. This includes the type of political institutions (Posner, Reference Posner2005), as well as whether politicians emphasize other certain identities or seek to reconstruct ethnic identities to their advantage (Kasfir, Reference Kasfir1979; Chandra and Boulet, Reference Chandra and Boulet2012).
2.3 Crosscutting
The configuration of various social identities, including ethnicity, is sometimes referred to as “crosscutting” (Simmel, Reference Simmel1955; Allport, Reference Allport1954; Gaertner and Dovidio, Reference Gaertner and Dovidio2000). When multiple identity dimensions are taken into account, one may begin to measure differing degrees of similarity and difference for any particular group. When several identity dimensions are aligned for a group of persons, the more likely they are to experience increased feelings of belonging and self-esteem among this constellation, leading to stronger in-group favoritism (Bornschier et al., Reference Bornschier, Häusermann, Zollinger and Colombo2021). On the other hand, a mosaic of identities that do not perfectly overlap allows individuals to experience both similarity and distinctiveness (Brewer, Reference Brewer1991). The process of social categorization, then, is often frustrated by the complexity of not only shifting cultural norms and identity boundaries, but the multifaceted nature of social identities and overlapping membership pools (Crisp and Hewstone, Reference Crisp, Hewstone and Zanna2007).
Geographic location is an important variable for determining patterns of crosscutting (Blau, Reference Blau1977), including the self-sorting of populations based on salient identities (Bishop, Reference Bishop2009; Mason, Reference Mason2018). While social identity groups do rely on the abstract “imagined” communities concept, identities are strengthened and become more important when they are more apparent in everyday life (Anderson, Reference Anderson2006). Thus, several scholars point to situations in which members of a social identity group, say ethnicity or race, are geographically concentrated and have much higher rates of social interaction and integration through occupation, civic groups, neighborhoods, and schools (Beck et al., Reference Beck, Dalton, Greene and Huckfeldt2004; McKenzie, Reference McKenzie2004; Pietryka and DeBats, Reference Pietryka and DeBats2017). These social networks are essential to determining whether individuals follow the norms and patterns of their perceived social group, through actions like bloc voting.
Several scholars have argued that crosscutting identities can help stabilize democracies (Horowitz, Reference Horowitz2000; Reilly, Reference Reilly2001). When partisanship or political affiliations become closely tied to a highly salient social dimension, political polarization may rapidly increase (Mason, Reference Mason2018), resulting in regression away from democracy through discrimination and oppression and/or political violence (Lipset, Reference Lipset1959; Blau, Reference Blau1977; Coser, Reference Coser1998; Chandra, Reference Chandra2007). Horowitz (Reference Horowitz2000) further argues that political institutions, such as the boundaries of regional governments or constituencies, should be designed to increase the degree of crosscutting and thus reduce ethnic-political salience. Internal group political fragmentation has also been shown to encourage candidates toward broader cross-ethnic support, resulting in more equitable public goods (Goa, Reference Gao2016).
Another line of research has sought to measure and test how the degrees of crosscutting relate to pertinent political and economic outcomes (Selway, Reference Selway2011a). Selway (Reference Selway2011b) recalculates ethnic diversity using the two crosscutting dimensions of religion and language over a large number of countries and demonstrates that this new measure is more robust than fractionalization scores in predicting economic growth, as well as an important predictor of civil war onset. Bormann, Cederman, and Vogt (Reference Bormann, Cederman and Vogt2017) combine linguistic and religious dimensions, finding that groups that are both linguistically and religiously distinct are more likely to be involved in an onset of civil war.
Intuitively, crosscutting patterns of ethnic and social identities should affect rates of bloc voting. At the most basic level, greater crosscutting generates “cross-pressures” on individuals given their various identities, which decreases group coordination (Almond, Reference Almond1956; Taylor and Rae, Reference Taylor and Rae1969; Roccas and Brewer, Reference Roccas and Brewer2002; Dunning and Harrison, Reference Dunning and Harrison2010). More recent regional tests also confirm this. Houle (Reference Houle2019) finds that greater homogeneity within African ethnic groups is associated with greater bloc voting. When examining European countries, Dassonneville (Reference Dassonneville2023) shows that social cross-pressuring defuses partisan attachments and increases political ambivalence.
2.4 Ethnic Group Coordination and Political Parties
Ethnic identities commonly serve as vehicles for political mobilization and representation to overcome collective action problems, aggregate interests, and consolidate trust (Birnir, Reference Birnir2007; Stubager, Reference Stubager2009; Livny, Reference Livny2020). Shared beliefs, experiences, cultures, and language among individuals may more easily translate to coordination of political party support (Gubler and Selway, Reference Gubler and Selway2012; Habyarimana et al., Reference Habyarimana, Humphreys, Posner and Weinstein2007; Rosenzweig, Reference Rosenzweig2024). In this way, social identities resemble party identification as both provide a heuristic, or tool, that enables individuals to coordinate their voting power around a shared concept (Downs, Reference Downs1957; Conover, Reference Conover1988; Popkin, Reference Popkin2000; Huddy, Reference Huddy2001; Collet, Reference Collet2005; Chandra, Reference Chandra2007).
In many countries, the ethnic identity of citizens, and those thought to be members of their group, represents an important factor influencing their political behavior and party or candidate support (Stubager, Reference Stubager2009). The degree to which ethnicity influences vote choice has been studied closely in Sub-Saharan Africa. Studies from Uganda (Carlson, Reference Carlson2015), Ghana (Lindberg and Morrison, Reference Lindberg and Morrison2008), South Africa (Ferree, Reference 90Ferree2006), and Benin (Adida et al., Reference Adida, Gottlieb, Kramon and McClendon2017), as well as those covering multiple countries (Koter, Reference Koter2016; Bratton, Bhavnani, and Chen, Reference Bratton, Bhavnani and Chen2012), show that in settings with recognized ethnic group-party attachments, individuals tend to balance both the ethnic identity of the candidate or party most closely associated with one’s group, with other key considerations such as governing performance, economic condition, and policy platforms.Footnote 3 The conclusion from this literature is that there is a wide range of settings in both social identities and nonsocial evaluations combined to inform vote choice.
Identities with weak social and/or political salience as well as identities with weak definitions or symbolic boundaries, should experience declining political coordination along this identity (Conover and Feldman, Reference Conover and Feldman1984; Harris, Reference Harris2022). When examining survey respondents from Kenya and Malawi with mixed ethnic backgrounds, Dulani et al. (Reference 89Dulani, Harris, Horowitz and Kayuni2021) show that their political party affiliation is much less predictable than respondents with parents of the same ethnicity, who are more likely to support the party with which their ethnic group is most aligned. Another social factor thought to influence the degree of bloc voting is the nature of identity “visibility” (Hale Reference Hale2004). Visibility refers to the degree of ease in categorizing and sorting other people into social identity groups. In settings where patronage and clientelism are pervasive, more visible social identifiers may incentivize stronger social group-party support because it is easier to discern between in- and out-group members (Chandra, Reference Chandra2006). Robinson (Reference 98Robinson2024) measures ethnic visibility in Malawi, showing that it is strongly and positively correlated with bloc voting. Visibility may be one reason why language is shown to have the most pronounced influence on bloc voting across Sub-Saharan Africa (Müller-Crepon and Bormann, Reference Muller-Crepon and Bormann2024).
The broader literature on social identities also points to local settings and degrees of contact as being very important for how individuals view themselves, their group, and non-group members (Allport, Reference Allport1954; Pettigrew, Tropp, Wagner and Christ, Reference Pettigrew, Tropp, Wagner and Christ2011; Enos, Reference Enos2017). In such cases, local geography may spur or deter bloc voting (Lublin, Reference Lublin2017). Studies from the United States show that local racial composition affects the strength of bloc voting, in particular, with more socially diverse localities being associated with lower block voting (Bullock, Reference Bullock1984; Stephanopoulos, Reference Stephanopoulos2016; Grofman, Handley, and Lublin, Reference Grofman, Handley and Lublin2000). Enos (Reference Enos2017) further shows that segregation between racial groups increases feelings of difference and negative stereotypes, driven by a lack of meaningful social engagement. In Ghana, where multiple types of salient social identities overlay in complex patterns, scholars have found that ethnic-political salience is weaker in more socially diverse local settings (Nathan, Reference Nathan2016), and that this also results in weaker bloc voting across more ethnically diverse constituencies (Ichino and Nathan, Reference Ichino and Nathan2013).
Social group members and political leaders surely have bidirectional effects on one another when it comes to bloc voting. On one hand, partisanship has been increasingly viewed as a form of social identity itself (Huddy, Reference Huddy2001; Bankert et al., Reference Bankert, Huddy and Rosema2017; Finkel et al., Reference Finkel, Bail, Cikara, Ditto, Iyengar, Klar and Druckman2020). There are numerous works highlighting the role of political elites in signaling appeals and seeking out specific support from social groups in the United States (Hutchings and Valentino, Reference Hutchings and Valentino2004; Nicholson, Reference Nicholson2012; Fraga, Reference Fraga2018) and from around the world (Wantchekon, Reference Wantchekon2003; Chandra, Reference Chandra2007; Telles, Reference Telles2014). On the other hand, block voting does not disappear in the absence of these political elite cues and courting. Studies detailing situations where there is no or little meaningful political party mobilization or competition, such as a single-party rule (Posner, Reference Posner2005), nonpartisan municipal elections (Pomper, Reference Pomper1966), and open primaries (Voss and Lublin, Reference Voss and Lublin2001) show that the nature of social group bloc voting may present differently, but does not disappear.Footnote 4 Still, bloc voting is influenced by the candidate options – if and how close candidates align to a voter’s ethnic identities (Horowitz, Reference Horowitz2019).
2.5 Party Systems and Political Institutions
Bloc voting outcomes are the result of both strategic decisions among group members, the salience to specific identities, and the institutional environment (Posner, Reference Posner2005; McLaughlin, Reference McLaughlin2007; Harris, Reference Harris2022). Ethnic identities, political parties, and the political institutions that guide elections and the application of power are all interactive forces.Footnote 5 Significant research has gone into the connection between ethnic/social cleavages, the nature of party systems, and how these interact with electoral and institutional rules. Both the central executive government type (presidential or parliamentary) as well as the election type (proportional or plurality), are argued to shift the incentives for group members according to their size and other key characteristics (Duverger, Reference Duverger1959; Rae, Reference Rae1967; Lijphart, Reference Lijphart1994; Reilly, Reference Reilly2001; Benoit, Reference Benoit2007).
The key point is whether an observable threshold exists for winning, making such rules more “restrictive.” In situations where a party or candidate needs to achieve 50% of the vote to gain power, social group members face a trade-off in this restrictive system between their preference ordering and the likelihood of being part of the winning coalition (Cox, Reference Cox1997; Helbling and Jungkunz, Reference Helbling and Jungkunz2020). Practically speaking, this might mean a small social group of say 5% (if acting uniformly) has the collective choice between forming their own political party that represents them and only receiving 5% of the vote, or seeking to join with other social groups to form a party coalition of 50% and win the election. This logic is much stronger in countries with restrictive institutions – presidential systems and plurality or first-past-the-post election rules. In such cases, the party represented by the 5% social group has essentially no chance of its candidate winning the executive office without engaging in coalition building. Thus, larger groups appear advantaged, and therefore their members are more incentivized, in threshold systems (see Section 4).
Horowitz (Reference Horowitz2000) and Linz (Reference Linz1990) argue that the restrictive institutions of plurality/majoritarian elections and presidential executives incentivize social groups to compete harder in a winner-takes-all setting (Ordeshook and Shvetsova, Reference Ordeshook and Shvetsova1994; Huber, Reference Huber2012). Norris (Reference Norris2004) finds that in restrictive systems, parties are incentivized to behave as “catch-all” parties attempting to draw in different voting blocs to form a winning coalition. Degrees of crosscutting identities may also impact how groups combine to form such coalitions.
On the other hand, institutions without thresholds are more “permissive,” and are expected to reflect the underlying social nature of society and its preferences more straightforwardly. Parliamentary systems and elections with proportional rules are said to be more “consociational” (Lijphart, Reference Lijphart1999) and “representative” (Norris, Reference Norris2004; Dancygier, Reference Dancygier2014), meaning that while identity salience in politics might be high, there should be lower ethnic tensions and lower risks of violence along ethnic-political lines (Reilly, Reference Reilly2001; Horowitz, Reference Horowitz2000). In permissive systems, especially parliamentary, parties are more often characterized as clearly aligning with a single social or ethnic group (Horowitz, Reference Horowitz2000; Clark and Golder, Reference Clark and Golder2006; Selway and Templeman, Reference Selway and Templeman2012).Footnote 6
The restrictive versus permissive institutions have also been strongly tied to a country’s party systems, or the number of parties.Footnote 7 Duverger’s (Reference Duverger1959) theory that presidential systems (restrictive) result in two main political parties, while parliamentary systems (permissive) result in many competitive parties is a powerful finding in political science (Li and Shugart, Reference Li and Shugart2016). At the same time, there is a growing recognition that the underlying arrangement of ethnic and social cleavages does have some influence on party systems (Neto and Cox, Reference Neto and Cox1997; Dickson and Scheve, Reference Dickson and Scheve2010; Moser and Scheiner, Reference 96Moser and Scheiner2012; Singer, Reference Singer2013; Ferree et al., Reference Ferree, Powell and Scheiner2014; Milazzo, Moser, and Scheiner, Reference Milazzo, Moser and Scheiner2018; Bouton and Ogden, Reference Bouton and Ogden2021; Lublin, Reference Lublin2017). How “diversity” is measured significantly influences the results of such analyses, and whether or not crosscutting or multiple forms of identity are accounted for.Footnote 8 Clark and Golder (Reference Clark and Golder2006) aptly argue that scholars should focus on how the size and other characteristics of social groups interact with electoral rules and the party systems to inform bloc voting. All of this implies complex and bidirectional relationships between the array of ethnic groups, political party representation, and political institutions.
2.6 Summary of the Literature
This vast literature on social identities is complex and reaches across disciplines. It is not the objective here to develop a new theoretical take on the definition, processes of formation, or dissipation of social identities. Previous work, however, provides several key points moving forward. First, social identities are both psychological constructs and informed through social interactions, where individuals often categorize themselves and others into groups across a wide range of dimensions. Within the overarching concept of social identities are ethnicities, socially categorizations informed by descent. They range in salience from context to context and often include not only genetically based attributes, but also other descent-related attributes such as language, region, and religion. Ethnic memberships are not permanent but are typically considered difficult to change over the short term. It’s also vital to recognize that all individuals hold multiple dimensions of identity, raising the issues of whether group identifiers are aligned or cross-pressured when considering multiple dimensions.
A sizable literature has also sought to understand how ethnic identities relate to political parties, political institutions, and voting patterns. Ethnic groups are often considered potential vehicles for coordinating or aggregating interests to seek political power and representation. If there is a conclusion from this literature, it is that the interactions between group characteristics, parties, and political institutions are complex and multidirectional. Still, restrictive institutions, especially presidential systems, are expected to reduce the number of parties and create different incentives for individuals on how to have their vote represented as part of the winning coalition. Section 3 overviews different expectations around how group characteristics, especially size, are expected to relate to bloc voting.
3 Group Size and Bloc Voting
Many of the theories and findings regarding which conditions incentivize bloc voting tend to center around one indicator – the proportional size of the group within a given population. This section first reviews the theories that imply smaller-sized groups should demonstrate higher rates of bloc voting before discussing two other literatures that emphasize greater salience among medium-sized groups. Very large groups, proportionally, are less interesting as they approach encompassing the entire population. Note that there is no consensus on the boundaries between small, medium, and large groups. As detailed in Section 2, scholars have good reasons to also expect that the dynamics around group size unfold differently in restrictive versus permissive political systems, though these dynamics are not necessarily discussed in theoretical traditions based in nonpolitical disciplines.
3.1 Small Groups – Collective Action
The first school of thought directly related to social group size focuses on how scale affects coordination. The theory of “collective action” has played a central role in economics, business management, social psychology, and social movements, centering on how the number of group members influences their behavior by shifting coordination incentives. Olson (Reference Olson1965) argued that as groups or organizations increase in size, it becomes increasingly difficult for them to accomplish their collective goals voluntarily. Ostrom (Reference Ostrom1990) followed in this path as she demonstrated that smaller groups with greater social cohesion can overcome tragedies of the commons through enhanced coordination and monitoring. Numerous scholars have built on these works by testing the mechanisms of decreased individual responsibility, reduced accountability, lower individual payoffs, and incentives to free ride on collective action (Dawes, Reference Dawes1980; Stroebe and Frey, Reference Stroebe and Frey1982; Brewer and Kramer, Reference Brewer and Kramer1986).
Section 2 highlighted the important role of location, contact, and social networks for group cohesion (McPherson, Smith-Lovin, and Cook, Reference McPherson, Smith-Lovin and Cook2001; Hechter and Okamoto, Reference Hechter and Okamoto2001; Simpson and Macy, Reference Simpson and Macy2004; Habyarimana et al., Reference Habyarimana, Humphreys, Posner and Weinstein2007). As groups increase in number, contact and social connections weaken, making the emotional mechanism of belonging and group definition more fragile as well as the instrumental mechanisms of monitoring, sanctioning, and reciprocity. Thus, the overall size of group members and clarity of group boundaries are all correlated and thought to influence the ability of members to coordinate.
The social mechanisms related to expected and actual contact between group members correlate not just with a group’s size, but also with physical concentration. Prominent scholars of political party systems have argued that geographic concentration is expected to increase voter coordination along identity lines (Rae, Reference Rae1967; Sartori, Reference Sartori1976). Subsequent research has shown that concentrations of ethnicity or other forms of social identity, in an overall diverse population, increases bloc voting (Ichino and Nathan, Reference Ichino and Nathan2013; Mozaffar et al., Reference Mozaffar, Scarritt and Galaich2003; Dancygier, Reference Dancygier2014).
While some of the mechanisms encouraging ethnic group bloc voting may be positive or neutral to group members, scholars have also noted more pernicious effects such as heightened feelings of difference and animosity toward out-group members (Hale, Reference Hale2004; Mason and Wronski, Reference Mason and Wronski2018; Hodler et al., Reference Hodler, Srisuma, Vesperoni and Zurlinden2020), exacerbating clientelism and unequal distribution of public goods (Miguel, Reference Miguel2004; Keefer and Khemani, Reference Keefer and Khemani2005; Ejdemyr et al., Reference Ejdemyr, Kramon and Robinson2017), and a stronger likelihood of localized ethnic conflict and violence (Hodler et al., Reference Hodler, Srisuma, Vesperoni and Zurlinden2020).
While first applied to formal organizations like companies, the negative relationship between group magnitude and coordination should also hold for ethnic group members working to coordinate their voting power. Holding all else equal, ethnic groups with more members should experience lower levels of coordination and higher incentives for free-riding when pursuing a group-oriented goal. In the context of political contestation, collective action theory implies that smaller ethnic groups should experience an enhanced ability to engage in bloc voting. It’s unclear whether ethnic identity groups, however, which in the cases number in the tens or hundreds of thousands, if not millions, within a country, can truly experience these coordination benefits given such large numbers.
3.2 Small Groups – Fractionalization and Inequality
The idea that having a larger number of smaller-sized ethnic groups leads to higher social-political salience and a range of negative economic and political outcomes was popularized by scholars propagating the Ethno-Linguistic Fractionalization (ELF) index. The index takes the proportions of all ethnic groups within a country and then calculates the chance that two randomly selected individuals belong to different groups, meaning a higher score represents more diversity (Alesina et al., Reference Alesina, Devleeschauwer, Easterly, Kurlat and Wacziarg2003). In short, high fractionalization is a summary measure of diversity. Using country-level data, scholars have shown that greater ethnic and religious diversity is correlated with an increased likelihood of violence, lower economic growth, poorer governance, and less equal distribution of public goods (Easterly and Levine, Reference Easterly and Levine1997; Alesina, Baqir, and Easterly, Reference Alesina, Baqir and Easterly1999; Alesina et al., Reference Alesina, Devleeschauwer, Easterly, Kurlat and Wacziarg2003). While this line of research has garnered tens of thousands of scholarly citations, the approach suffers from both theoretical and methodological deficiencies when applied to the question of bloc voting.
First, the most distinctive implication of fractionalization theory lies in the presumption that a greater number of cleavages (group count) produces greater tensions between social identity group members, and thus heightened salience between them (Houle, Park, and Kenny, Reference Houle, Park and Kenny2019). The specific underlying explanation for the connection between diversity and salience, however, is not entirely clear. Perhaps the most clearly articulated reason given by scholars is that a greater number of groups increases competition and creates more opportunities for smaller groups to be oppressed. As Alesina et al. (Reference Alesina, Devleeschauwer, Easterly, Kurlat and Wacziarg2003) write, “In more fragmented societies, a group imposes restrictions on political liberty to impose control on the other groups. In more homogeneous societies, it is easier to rule more democratically since conflicts are less intense” (173).
A methodological concern with the ELF approach is the assumption that the degree of competition and conflict increases with every new social group cleavage, while in reality, it is unclear whether the relationship between the number of groups and the level of social tension should be linear or nonlinear. An array of scholars has drawn attention to flaws within fractionalization theory and with the ELF index. For instance, critics have pointed out that index fails to account for multiple identities, variations in political relevance, differing spatial distributions, or the fact that groups change over time (Laitin and Posner, Reference 94Laitin and Posner2001; Posner, Reference Posner2004a; Cederman and Girardin, Reference Cederman and Girardin2007; Chandra and Wilkinson, Reference Chandra and Wilkinson2008).
On the other hand, many scholars, though not all (Fearon and Laitin, Reference Fearon and Laitin2003), have found a connection between the discrimination, repression, and exclusions of smaller ethnic groups and an increased likelihood of violence and even civil war (Toft, Reference Toft2002; Hale, Reference Hale2004; Østby, Reference 97Østby2008; Cederman, Wimmer, and Min, Reference Cederman, Wimmer and Min2010; Desmet et al., Reference Desmet, Orturt and Wacziarg2012).Footnote 9 The heightened salience driven by discrimination or exclusion results not only in grievances against those in power but an enhanced sense of “uniqueness” and feelings of difference (Brewer, Reference Brewer1991).
Forms of exclusion and discrimination may be observed through the creation of a perceived social hierarchy, but also manifest in tangible ways through which ethnic groups lack political representation, are targeted by the state, or experience higher rates of poverty relative to other citizens of the country. These forces of discrimination tend to go together. In addition to access to political power (Cederman, Wimmer, and Min, Reference Cederman, Wimmer and Min2010), measuring the economic inequality between groups is also confirmed to increase the likelihood of social-based conflict (Cederman, Weidmann, and Gleditsch, Reference 87Cederman, Weidmann and Gleditsch2011). Economic inequality has also been directly tied to a higher degree of bloc voting (Houle, Park, and Kenny, Reference Houle, Park and Kenny2019).Footnote 10 All of this suggests that individuals belonging to smaller ethnic groups will be more likely to vote together because they experience a heightened sense of group salience, driven by fears or experiences of domination and exclusion.
Institutional features, like rules that block or greatly discourage political representation of smaller ethnic groups, can both increase salience and enhance feelings of exclusion that lead to conflict (Wimmer, Reference Wimmer2013; Lublin, Reference Lublin2014). For example, in majoritarian electoral systems, power differences and economic inequality increase the salience of ethnic identities in voting, as tested in India at the state level (Huber and Suryanarayan, Reference Huber and Suryanarayan2016). Scholars have thus proposed particular institutional arrangements as tools to help alleviate concerns of permanent exclusion and inequality (Horowitz, Reference Horowitz2000; Lubin and Bowler, Reference Lublin and Bowler2018). To better represent social minority group interests, Lublin (Reference Lublin2014) asserts decentralization and federalism, proportional representation with larger district magnitudes, and lowering legislative threshold drive better representation for smaller social groups that may be marginalized otherwise (see Hale, Reference Hale2004).Footnote 11 Thus, political institutions appear important in mediating the expected higher identity salience of smaller groups into bloc voting.
3.3 Medium Groups – Polarization
Alongside fractionalization theory – that countries with many small ethnic groups experience heightened salience and subsequent economic and political ills – other scholars have drawn on examples where it seemed competition between social identity groups was most pronounced when a few, medium-sized groups struggled for political power. The polarization theory of social groups posits that members of groups that feel both very different and most threatened by one another will experience the strongest incentives to engage politically (Esteban and Ray, Reference Esteban and Ray1994). As Reynal-Querol (Reference Reynal-Querol2002) theorizes, polarization is represented by a “situation that leads to the point of maximum tension … when there are two social groups with the same size” (32). Brewer (Reference Brewer2001) also hypothesized that the feelings of difference between social group members would be strongest in the case of two groups. The idea is that the largest two groups are important for determining this level of tension, as groups that increase in size over 50%, are expected to split support toward two candidates (Dickson and Scheve, Reference Dickson and Scheve2010).
Such ideas are reminiscent of Marx, but have also been highlighted in American politics with Key (Reference Key1949) comparing size-based rivalries between white and black populations in the South and connecting this to subsequent political restrictions or violence against rival group members (nearly always white on black) (also see Leader, Mullen, and Abrams, Reference Leader, Mullen and Abrams2007). Comparative politics scholars have also argued that a small number of social groups, proximate in size, generate strong feelings of rivalry, competition, and even violence (Horowitz, Reference Horowitz2000; Collier, Reference Collier2001; Cederman and Girardin, Reference Cederman and Girardin2007). In contrast to fractionalization theory, polarization theory argues that it is the comparative strength between groups that motivates rivalry and increases coordination behavior.
Conditions with a few large ethnic groups where difference is fueled by elite rhetoric and other inequalities seem to be highly destabilizing (Ellingsen, Reference Ellingsen2000; Houle, Park, and Kenny, Reference Houle, Park and Kenny2019). Several well-known examples of severe ethnic-based crises and violence include either two or three groups: religion in India and Sri Lanka, religious denomination in Northern Ireland, ethnicity in Rwanda and Burundi, and ethnolinguistic divisions in Nigeria and the former Yugoslavia. Much of the research within the polarization literature has focused on war and conflict as the primary outcome of interest (Horowitz, Reference Horowitz2000; Reynal-Querol, Reference Reynal-Querol2002; Cederman and Girardin, Reference Cederman and Girardin2007; Desmet et al., Reference Desmet, Orturt and Wacziarg2012).
The central idea of polarization theory is that when a social group that is relatively large (powerful) is directly confronted by a group of similar size (power), tensions increase as members from both groups feel increasingly threatened. In addition to the proximate size groups, however, Esteban and Ray (Reference Esteban and Ray1994) argue that scholars should take into account the degrees of difference or character between groups when measuring polarization. In their view, the most polarizing situation is where two groups of equal size have very homogeneous within-group populations but very different between-group feature sets. According to this line of thinking, two strong social groups should experience higher rates of bloc voting, driven by feelings of competition.
3.4 Medium Groups – Coalition Partners
Another theory that infers medium-sized groups experience greater incentives to coordinate and coalesce their votes is explicitly tied to political institutions. The coalition theory considers how social groups align with political parties or electoral coalitions. If a central motivation of social group members is to win power through elections (Bates, Reference Bates1987), then identifying with a larger group may incentivize members to engage in bloc voting because the group has greater potential coalition power. Members of especially small social identity groups should experience lower coordination incentives due to their meager contribution to a minimum winning coalition, often represented by the 50% threshold observed in more restrictive political and electoral systems (Posner, Reference Posner2005; Chandra and Boulet, Reference Chandra and Boulet2012; Stoll, Reference Stoll2013). This adheres to the tenet that voters base their decision not only on individual preference but on the likelihood of their supported candidate or party winning (Duverger, Reference Duverger1959; Cox, Reference Cox1997). Some scholars also point out that politicians strategically seek to mobilize or activate ethnic identities to form a winning coalition (Bormann Reference 86Bormann2019; Chandra and Boulet, Reference Chandra and Boulet2012).
Examples can be found across political science dealing with the logic of coalition placement. Dahl (Reference Dahl2005) argued that as immigrants with a particular ethnic heritage grew as a larger proportion of the area population, they increasingly engaged in local government bloc voting, accessing more political power (also see Cho et al. Reference Cho, Gimpel and Dyck2006). In Chandra’s (Reference Chandra2007) analysis of ethnic parties in India, she finds more pronounced caste-based voting only where particular caste groups were large enough to meaningfully contest for power at the regional level. Perhaps the clearest example of the coalition argument comes from Posner’s (Reference Posner2004b) comparison of the same ethnic groups across Zambia and Malawi. His central argument is that the “political salience of a cultural cleavage will depend on the sizes of the groups that it defines relative to the size of the arena in which political competition is taking place” (529).
Furthermore, when it comes to public goods and resources, two articles find that in Zambia at least, more ethnically diverse districts seem to get more government budget allocated, and improved educational and health outcomes (Gibson and Hoffman, Reference Gibson and Hoffman2013; Gisselquist et al., Reference Gisselquist, Leiderer and Nino-Zarazua2016). The theorized mechanism is the need to build broad coalitions to receive the most votes in a winner-takes-all electoral system; thus, ethnically diverse areas are more likely to be viewed as “swing” or competitive electoral areas for which politicians compete more fiercely. Overall, the coalition theory implies a meaningful interaction between political institutions, especially whether they are more permissive or restrictive (with winning thresholds), ethnic group size, and other characteristics like crosscutting, which may be used to activate certain identities and coalesce group members (Bormann Reference 86Bormann2019; Laitin and Van der Veen, Reference Laitin and Van der Veen2012). In summary, medium-sized groups are thought to be the most motivated to vote together, in majoritarian election settings at least, motivated by the likelihood of being the leading group in a winning electoral coalition.
3.5 Summary of Expectations
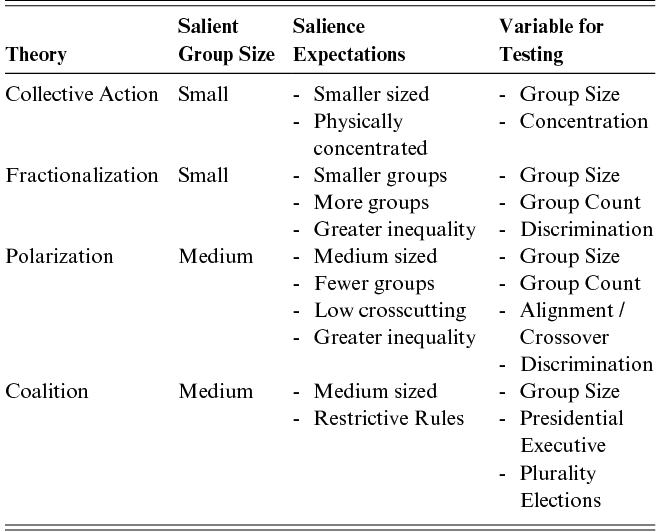
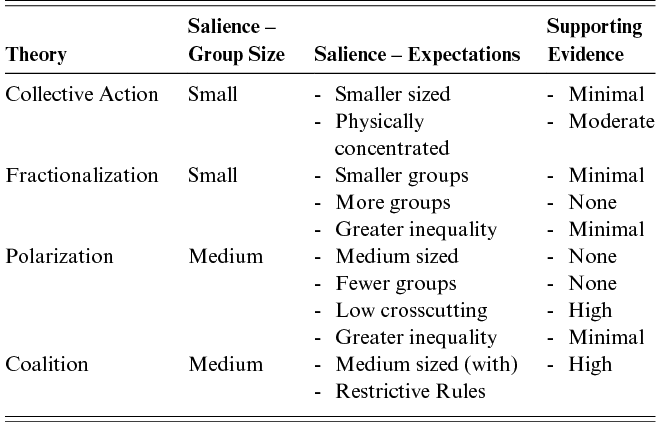
These literatures point to a fundamental quandary – do smaller- or medium-sized ethnic groups, on average, have higher rates of bloc voting? Furthermore, there are many secondary puzzles – how do other group characteristics such as discrimination and crosscutting affect bloc voting, and which, if any, of these findings are dependent on specific political institutions? Each of the four theories described in the section has a somewhat different set of exceptions. The theories, their expectations, and the variables used to test each are summarized in Table 1.
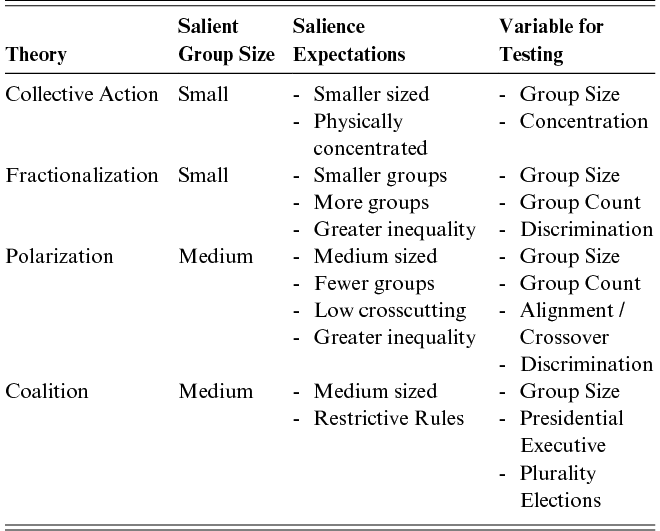
Table 1 Long description
Data mentioned are as follows. The table is titled “Summary of Expectations by Theory.” The columns are labeled Theory, Salient Group Size, Salience Expectations, and Variable for Testing.
Collective Action. Salient group size is small. Salience expectations include smaller-sized groups and physically concentrated groups. Variables for testing are group size and concentration.
Fractionalization. Salient group size is small. Salience expectations include smaller groups, more groups, and greater inequality. Variables for testing are group size, group count, and discrimination.
Polarization. Salient group size is medium. Salience expectations include medium-sized groups, fewer groups, low crosscutting, and greater inequality. Variables for testing are group size, group count, alignment or crossover, and discrimination.
Coalition. Salient group size is medium. Salience expectations include medium-sized groups and restrictive rules. Variables for testing are group size, presidential executive, and plurality elections.
First, Collective Action argues that smaller groups will achieve more unified outcomes compared to larger groups due to coordination or logistical challenges, and this is aided by physical concentration and increased contact. Thus, the variables leveraged to test this proposition are the size of groups (proportion after controlling for country population) and the geographic concentration of members. Smaller and more concentrated groups should have the highest rates of bloc voting.
Second, Fractionalization theory also views smaller groups and/or a higher number of groups as generating conditions for higher bloc voting incentivized through greater feelings of competition over resources and fear of discrimination and exclusion. In the analysis, three variables are included to test this hypothesis: group size, the number of competition groups or group count, and whether a group has experienced significant political and societal discrimination. The hypothesis is that smaller groups, with more competing groups, and those that experience discrimination should have the highest bloc voting rates.
On the other hand, polarization theory views medium-sized groups with significant differences and power imbalances as the situation inducing the greatest identity salience. To test, the variables included in the model are group size, group count, the crosscutting measures of alignment and crossover, and discrimination to account for power imbalances. According to the polarization hypothesis, ethnic groups that are medium sized, have one or a few competing groups (lower group count), less crosscutting, and higher discrimination should demonstrate the highest bloc voting rates.
Finally, because the coalition theory is primarily oriented around bloc voting, it also emphasizes the role of political institutions. According to this theory, medium-sized groups should be more motivated than smaller groups, though only in restrictive political systems. This is because members seek out identities that may serve as key coalition partners that have the greatest chance to win under plurality election rules and/or in a presidential system, to achieve meaningful influence over governance. Testing this requires an interaction between group size and the institutional features of executive systems and electoral rules.
4 Data and Methodology
Testing political behavior across ethnic identities entails serious challenges around scale and measurement (Laitin and Posner, Reference 94Laitin and Posner2001; Fearon, Reference Fearon2006). There is a range of approaches that all have advantages and drawbacks. Should the coordination of votes be tested at the individual, social group, political party, or country level? Furthermore, how ethnic “diversity” is measured has been shown to significantly influence the results (Stoll, Reference Stoll2008), resulting in confusion and some contradictory findings. Many analyses on ethnic cleavages, especially during the 1990s and 2000s, were conducted either at the country level, by leveraging summary indicators such as ethnic fractionalization or polarization scores. Other studies test at the group level using datasets such as Minorites at Risk (Minorities at Risk, 2009) or Ethnic Power Relations (Cederman, Wimmer, and Min, Reference Cederman, Wimmer and Min2010). Still others test the effects of group identification at the individual level using survey data that measure identification with a particular group (usually the largest) as an independent variable.
While helpful for some research agendas, using country-level social diversity scores is not appropriate for the study of bloc voting. First, the actual measurement of voting cohesions should correspond to each group individually. Second, the theories related to group size and characteristics demonstrate the importance of taking these data into account, group by group. Several scholars in related studies have thus relied on social groups as the unit of study (Fearon and Latin, Reference Fearon and Laitin2003; Østby, Reference 97Østby2008; Huber, Reference Huber2012; Ishiyama, Reference Ishiyama2012; Houle, Reference Houle2019).
Another critical issue related to measurement is capturing information about members within each group. This is essential for estimating the proportion of support for political parties and for the calculation of crosscutting measures by taking into account the different social identities by individuals (Selway, Reference Selway2011a; Selway, Reference Selway2011b; Moser, Scheiner, and Stoll, Reference Moser, Scheiner and Stoll2018). This project conducts testing at the group level, but based upon individual-level information and controlling for and interacting with political party and country-level variables. To reliably capture group-level observations, representative survey data are aggregated into group statistics.
4.1 Data Sources
Some research projects have employed the method of building group-level observations based on representative survey data, including Østby (Reference 97Østby2008) and Gershman and Diego (Reference Gershman and Diego2018) who aggregate DHS survey data, Selway (Reference Selway2011b) and Houle (Reference Houle2019) who collect respondent data from multiple major survey series, and Müller-Crepon and Bormann (Reference Muller-Crepon and Bormann2024) who rely on Afrobarometer data to measure the degree of bloc voting. Building a dataset of group observations based on survey data entails several advantages. First, ethnic identities are self-identified by the respondents, thus confirming the presence of a psychological state of identity categorization (Livny, Reference Livny2020). Second, individual-level data allow for the calculation of crosscutting variables across various identity dimensions. Third, identities and political support can be directly linked through capturing the past or hypothetical voting intentions of each respondent.
The question of which ethnic identities to capture is an open one.Footnote 12 The ethnic groups collected for this project tend to focus on two important worldwide types that, in general, have well-recognized boundaries – heritage and religion. These are also the primary identity types included in other global measurement projects such as the Ethno-Linguist Index (ELF) and the Ethnic Power Relationship (EPR) dataset. Using an innovative methodology to compare the salience of a range of social identities on bloc voting across the African continent, Müller-Crepon and Bormann (Reference Muller-Crepon and Bormann2024) show that linguistic ethnicity is by far the strongest identity type.Footnote 13 Religion is often considered a second key dimension of identity globally, with a deep impact on society and politics.Footnote 14 Both of these fit under Chandra’s (Reference Chandra2012) definition of “ethnicity.”
Of course, numerous social dimensions might be included as group observations, such as gender, sexuality, educational attainment, age, geography, income, class, and occupation. While including these in the analysis would surely improve it, there are three challenges. The first is that some of these social dimensions do not have recognized group boundaries, making it difficult for the researcher or individuals to sort respondents into groups based on, say, level of monetary income. The ethnic groups examined here have, not absolute, but generally recognizable boundaries. This is an essential point for this analysis since the investigation is centrally concerned with group size. If the boundaries are unclear to many, such as with income level, then the researcher asserts boundaries that are not widely recognized by individuals.Footnote 15 Boundaries, belonging, and activations of identity within ethnic groups can also change, of course, but they are more obvious and stable relative to most other social identities in most circumstances.
Second, not all the survey series on which the dataset is built have such questions dealing with most of these identities. Not only are ethnic identities or attributes the most widely recognized as important for political alignment, but they are also regularly captured on international surveys. Third, I limit the total number of identities per individual to four for computing purposes. This is, of course, a simplification of reality, but with each type of social dimension added, the calculations related to crosscutting become exponentially complex.
In order to gather a meaningful worldwide sample, I accessed survey data from seven respected cross-national survey series as well as a handful of country-specific surveys. For two of the survey series, I gather all countries from one wave or round, and the countries that are unique to a subsequent round. The surveys are accessed from series including Afrobarometer (Round 6), Afrobarometer (Round 9), World Values Survey (Wave 6), World Values Survey (Wave 7), Arab Barometer (Wave 3), Asian Barometer (Wave 4), Latinobarometer (2017), International Social Survey Programme (ISSP, 2016), and the European Values Survey (EVS, 2017). Certain larger countries are excluded from these survey series, and thus, I gathered additional individual country surveys for Austria (AUTNES), Canada (CES), and France (FES).
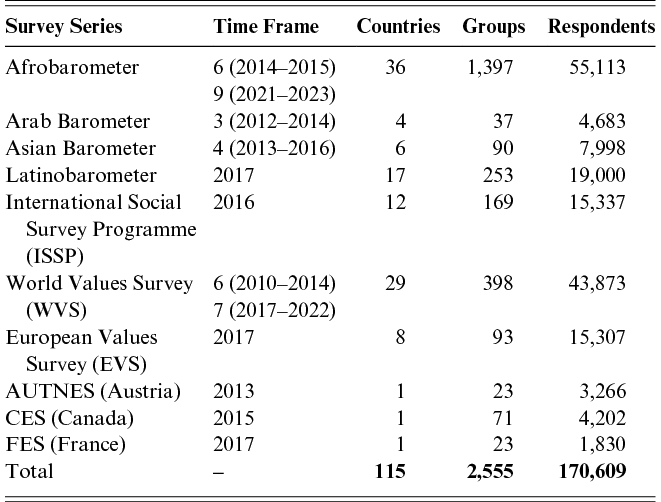
The number of countries, social groups, and respondents by survey series are shown in Table 2. Through the aggregation process, these combined surveys generated a total of 2,555 ethnic groups with adequate data coverage across 115 countries, and based on an estimated 170,609 survey respondents. Ethnic groups must have at least ten respondents from the sample to be included in the dataset.Footnote 16 I also exclude group observations that are coded as “other” from the final dataset.
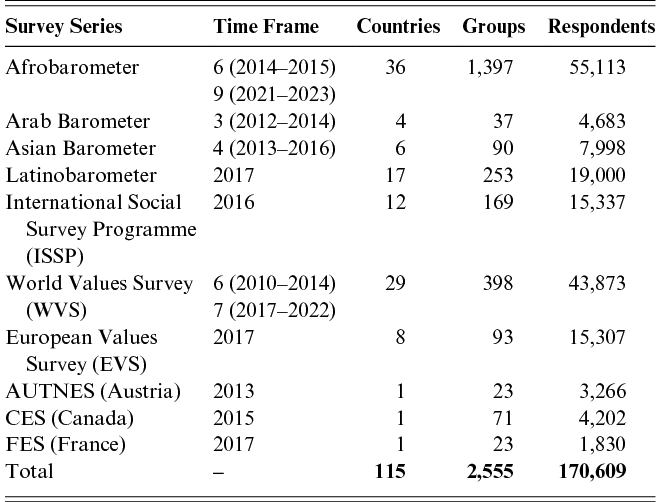
Table 2 Long description
Data mentioned is as follows. The table contains columns labeled Survey Series, Time Frame, Countries, Groups, and Respondents. It summarizes the survey datasets used in the study and reports the number of countries, groups, and respondents represented in each source.
Afrobarometer. Time frames: Round 6 (2014–2015) and Round 9 (2021–2023). Countries: 36. Groups: 1,397. Respondents: 55,113.
Arab Barometer. Time frame: Round 3 (2012–2014). Countries: 4. Groups: 37. Respondents: 4,683.
Asian Barometer. Time frame: Round 4 (2013–2016). Countries: 6. Groups: 90. Respondents: 7,998.
Latinobarometer. Time frame: 2017. Countries: 17. Groups: 253. Respondents: 19,000.
International Social Survey Programme (ISSP). Time frame: 2016. Countries: 12. Groups: 169. Respondents: 15,337.
World Values Survey (WVS). Time frames: Round 6 (2010–2014) and Round 7 (2017–2022). Countries: 29. Groups: 398. Respondents: 43,873.
European Values Survey (EVS). Time frame: 2017. Countries: 8. Groups: 93. Respondents: 15,307.
AUTNES (Austria). Time frame: 2013. Countries: 1. Groups: 23. Respondents: 3,266.
CES (Canada). Time frame: 2015. Countries: 1. Groups: 71. Respondents: 4,202.
FES (France). Time frame: 2017. Countries: 1. Groups: 23. Respondents: 1,830.
Total across all survey series: 115 countries, 2,555 groups, and 170,609 respondents.
This dataset represents significant coverage of ethnic group bloc voting. Out of 240 possible worldwide countries/jurisdictions, 207 are either member states of the United Nations or non-microstates (population greater than 100,000 individuals). From this, fifteen are excluded due to a lack of multiparty elections over the past two decades – Bahrain, Brunei, China, Cuba, Eritrea, Eswatini, Laos, Macau, North Korea, Oman, Qatar, Saudi Arabia, South Sudan, United Arab Emirates, Vietnam, and Western Sahara. I also exclude several countries for which survey data is available, but which lack meaningful elections and have Electoral Democracy scores under 0.25 at the time of survey collection– Azerbaijan, Belarus, Egypt, Jordan, Iran, Kazakhstan, Palestine, Republic of the Congo, Sudan, Uzbekistan, Venezuela, and Yemen. Overall, this is a lenient approach that includes many hybrid and autocratic-leaning regimes.Footnote 17 A motivation for including countries with mediocre elections is to increase global coverage and statistical power on the country level to ensure variation in institutional arrangements.
The world’s total population estimate for 2024 is 7.96 billion. Among the 201 countries that are widely recognized, the population was closer to 7.88 billion. If the possible universe of countries is reduced to only those with de jure multiple-party elections, this results in 186 countries composed of 6.24 billion people. The sample covers 66.8% of eligible countries with minimal electoral competition. Because many of the missing countries have small populations, however, the sample covers populations totally 5.36 billion, representing 90.4% coverage of the eligible total.
For each country, four ethnic dimensions are selected based on available survey data. The ethnic identity dimensions include Race, Caste, Language, Nation, Tribe, Religion, and Sect. Note that conceptual boundaries between these group types may be contested. For example, the difference between Race and Nation or Nation and Tribe may be blurred depending on the approach used by the survey designers and the regional cultural dynamics. The term “tribe,” which is viewed negatively in some settings, is used here because it is based on the survey question from the Afrobarometer on which the data are gathered.Footnote 18 The term “nation” in this context is used not necessarily in the sense of citizens belonging to a specific nation-state, but as Chandra (Reference Chandra2012) describes it – any large-scale, descent-oriented group concentrated within a geographic area.
I separate the heritage-centric dimensions of Race, Caste, Language, Nation, and Tribe from the religious-centric dimensions of Religion and Sect. For each country, two of the heritage-centric dimensions are selected alongside the two religion ones.Footnote 19 Note that in some situations, combinations of language, nation, or tribe overlap almost entirely. For religion, surveys provide differing degrees of fidelity in their response options, though most include a range of both Christian and Muslim denomination/sect options. Based on these more fine-grained religious denominations, I sort them into major religions to create two separate identity dimensions.Footnote 20 Some religions do not have variation across sects; however, the incorporation of the religious dimension at two levels helps represent degrees of difference.Footnote 21
The observational level is the ethnic group, as captured at the time of the survey in a particular country. This means that several specific ethnic groups actually appear multiple times across different countries, especially more globalized or overarching identities such as French Language speakers or Catholic Sect identifiers. The dataset thus includes 2,555 total ethnic groups for analysis, but only 1,154 unique groups. In Table 3, the total number of observations by ethnic dimension is included along with how many unique options this actually entails. There are in total fifteen unique racial group options and nine different major religious groups that are represented across a wide array of countries. On the other hand, smaller ethnic dimensions tend to be unique to a country setting.Footnote 22
| Identity Types | Mean Size | Total Groups | Unique Groups |
|---|---|---|---|
| Race | 30.0% | 185 | 15 |
| Caste | 24.5% | 4 | 4 |
| Language | 16.5% | 639 | 490 |
| Nation | 19.9% | 189 | 133 |
| Tribe/Clan | 6.5% | 451 | 405 |
| Major Religion | 35.7% | 320 | 9 |
| Religious Denomination/Sect | 14.8% | 767 | 98 |
| Total | – | 2,555 | 1,154 |
4.2 Dependent Variable
To capture bloc voting, the political support of survey respondents is sorted for each ethnic group. The political support data differs according to each survey but follows one of three options. First, in some surveys, respondents were asked which party they would vote for in a hypothetical election held today. Second, some respondents were asked which party they voted for in the most recent election, and third, other respondents were asked which party they are most supportive of or attracted to at the time of the survey. This third option, more closely capturing partisanship, is only used for a handful of cases when the other two are not available.
The question of how to measure or operationalize bloc voting remains unsettled. Part of the issue is the level of observation. The most common approach among scholars who study block voting has been to create a fractionalization score (Alesina et al., Reference Alesina, Devleeschauwer, Easterly, Kurlat and Wacziarg2003) at the group level, capturing the configuration of support of political parties (Huber, Reference Huber2012; Ishiyama, Reference Ishiyama2012; Houle, Reference Houle2019). This provides a single measure of how consolidated or dispersed political support is across a number of parties. In this way, the strategy leverages a commonly used measure in the social sciences and summarizes the data into a single score.
Using within-group fractionalization to measure bloc voting, however, has several drawbacks. First, in any survey question on political party support, there exists the option for respondents to select a nonresponse. This includes answers like “Don’t Know,” “Other” without further specifying which party, or refused to answer the question. Across the entire dataset, around one-third of respondents indicate one of the “nonresponse” options. This raises the question of whether to exclude them from the fractionalization calculation or treat them as a separate political group, neither of which is desirable.
Second, fractionalization scores are not especially intuitive to report or describe, as it is difficult to discern what a “high” or “low” block voting score should be. Third, and most importantly, if bloc voting is understood as the degree to which group members coordinate their votes toward a single political party (or candidate) as a vehicle for accessing political power, then the measure should focus solely on the most supported party. In this respect, fractionalization scores capture uninteresting noise by taking into account the vote distribution of parties aside from votes intended for the most popular party.
To illustrate, Figure 1 [A:D] present four hypothetical examples of how group members might relate to four political parties. In all examples, there are four party options for members to coalesce around (H, I, J, and K), but respondents can also select the nonresponse option of “None.” To illustrate how the measurement approach changes the bloc voting score, I calculate the opposite of the fractionalization score (simply F) so that a higher value represents greater vote consolidation (less diversity) for comparison purposes. The first measure takes the nonresponses into account as a fifth option for support, and the second measure removes the nonresponses and then calculates the bloc voting score. The third-row measure shows the proportion of group members supporting the most supported party, the approach used here. The resulting bloc voting scores are shown in Table 4.
(A:D): Hypothetical Examples for Calculating Bloc Voting
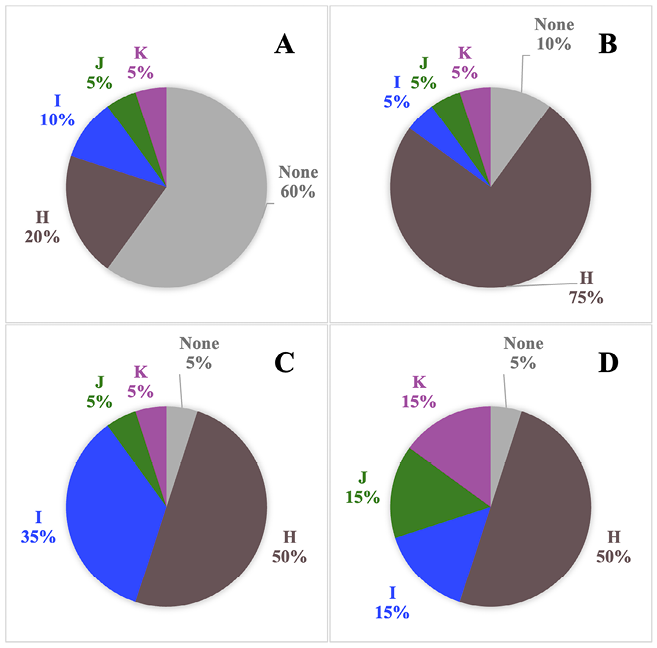
| Measure | Example A | Example B | Example C | Example D |
|---|---|---|---|---|
| Opposite Fractionalization with Nonresponses | 0.41 | 0.58 | 0.38 | 0.30 |
| Opposite Fractionalization without Nonresponses | 0.34 | 0.70 | 0.42 | 0.35 |
| Largest Party Proportion | 0.20 | 0.75 | 0.50 | 0.50 |
Example A presents a situation where the majority of group members are not attached. In such cases, the largest party proportion indicates a low degree of bloc voting of 0.20, and the fractionalization scores are somewhat higher. All the measures show a higher bloc voting value in example B, but the largest party proportion measure is the highest at 0.75. In examples C and D, the largest party proportion measure remains fixed at 0.50. Only the second, third, and fourth parties shift their support levels. This is simply to reiterate that the fractionalization scores move even when the largest party support remains the same. I argue that this change in score introduces noise into the measure, as the difference does not reflect a meaningful change in the degree of bloc voting.
In light of this, the analysis focuses on the proportion of support for only the most supported party among ethnic group members, leaving all other parties and nonresponses aside. The main dependent variable is labeled as Group Vote, representing the proportion of votes for the group’s most supported party, ranging from 0.012 to 1, with a mean of 0.374. To control for party popularity, the overall national popularity of the largest political party for that group is included as a control variable in all statistical models. For descriptive analysis, I rely on the measure Group Vote Difference to capture block voting, which is Group Vote – Most Supported Party Percent. This variable ranges from −0.449 to a maximum of 0.757, with a mean of 0.076. For example, if an ethnic group supports Party A at 60%, but the overall population support for Party A is 30%, this results in a Group Vote Difference of +30% or 0.30.
4.3 Key Independent Variables
The central independent variable of interest is Group Size, calculated by the number of respondents indicating membership in a social group over the entire sample size. This measure may differ slightly from group proportions reported based on census data. Because, for any social identity, respondents may state don’t know or refuse to answer, the combined percentage of all social groups by country does not typically sum to one. In addition, I calculate the number of ethnic groups per type-country for the variable Groups Count.
Crosscutting is measured in two ways: the similarity of group members across dimensions (within-group) and the similarity of group members to non-group members (across-group) (see similar approaches from Selway, Reference Selway2011a; Houle, Reference Houle2019). Note that in this analysis, the crosscutting measures take into account four ethnic dimensions compared to Selway (Reference Selway2011a) who calculates using two, and then generates multiple indices for each identity dimension pairing.
The first crosscutting measure, Alignment, captures within-group homogeneity across the remaining three cross-dimensions. Several studies of ethnic bloc voting have measured and found effects for diversity within a specific group across other dimensions, or “cross-pressures” (Dunning and Harrison, Reference Dunning and Harrison2010; Dassonneville, Reference Dassonneville2023). To calculate Alignment, the most common set of the three cross-dimensions is found. Next, each member of the group is scored 0.33 for meeting each one of these most common cross-group alignments and 0 if they do not. An Alignment score of one indicates that all members share the same three crosscutting identities.
Second, the measure Crossover captures the degree to which group members share a similar identity palette compared to the non-group population. For each of the three cross-dimensions, the proportions of various groups are compared between the group that is being calculated for and the reference population. For each cross-dimension option, the minimum proportion is taken and then aggregated by dimension. Finally, these statistics are averaged across the three cross-dimensions. A Crossover score of one occurs when the profile of the three cross-dimensions for any group is the same as the non-group population. This is essentially the same as Selway’s (Reference Selway2011b) “crosscutting” measure.
Geographic Concentration represents the degree to which members of a particular social group are physically clustered or dispersed. Because no survey data are geocoded in the dataset, regions are used.Footnote 23 The calculation is proximate to a reverse fractionalization score of group members across space. For each group, members are first counted by each region. The group’s proportions by region are then calculated by dividing by the total number of group members. The proportions from each region are then squared and summed. A concentration of one (maximum) occurs when all group members are contained within a single region. Because the calculation is influenced by the number of regions and geography, a control variable for the number of regions per country – Regions – is included in all models, as well as the variable Land Size, the logged number of square kilometers of the country, standardized between 0 and 1.
To measure Discrimination against an ethnic group, I leverage the Ethnic Power Relations (EPR) dataset that rates ethnic groups by their power status including the categories of excluded, discriminated, partner, dominant, or monopoly (Cederman, Wimmer, and Min, Reference Cederman, Wimmer and Min2010). I identify groups from my dataset that appear in EPR as either discriminated or excluded, which should result in heightened feelings of difference and resentment. This process yields 174 ethnic group matches. Since the EPR specifically focuses on one dimension of ethnicity per country, I then assess whether other ethnic dimensions in my dataset are predominantly composed of members from a discriminated-against ethnic group. For example, a religious group that is not included in EPR, but whose membership is composed of a majority of the members from a linguistic group that is included as discriminated or excluded, results in an additional 114 group matches. Both are combined into the discrimination variable.
Table 5 presents the summary statistics for the key variables used in the analysis. Group Size ranges from 0.03% to 100% with a mean of 17%. On average, there are around twelve ethnic groups for each dimension, though this varies significantly by country and group type, from one to fifty-three. Crossover and Alignment demonstrate significant variation but have higher means of 0.61 and 0.76, respectively. Concentration also ranges with a lower mean of 0.39. Finally, for Discrimination, a dichotomous variable, about 9% of ethnic groups are coded as experiencing significant exclusion from power. The table also reports the average support for political parties ranging from 0.3% to 66% of the entire population, and as many as twelve parties are included.
| Key Variables | Min | Mean | Median | Max |
|---|---|---|---|---|
| Group Size | 0.003 | 0.174 | 0.043 | 1.00 |
| Groups Count | 1 | 12.3 | 9 | 53 |
| Crossover | 0.001 | 0.606 | 0.607 | 1.00 |
| Alignment | 0.171 | 0.755 | 0.762 | 1.00 |
| Concentration | 0.021 | 0.387 | 0.292 | 1.00 |
| Discrimination | 0 | 0.093 | 0 | 1 |
| Party Percent | 0.003 | 0.298 | 0.270 | 0.660 |
| Party Rank | 1 | 1.51 | 1 | 12 |
| Group Vote | 0.012 | 0.374 | 0.348 | 1.00 |
| Group Vote Difference | −0.449 | 0.076 | 0.046 | 0.757 |
4.4 Crossover and Alignment Calculation Example
To illustrate how the key crosscutting measures are created, this section follows the construction for a single group from the dataset to ensure transparency. The example tracks religion in Brazil and calculates Alignment (within-group) and Crossover (across-group) for Christian identifiers. To start with, respondents are sorted by religion according to their responses and the available major religion options. In the case of Brazil, three major religious groups are represented with at least ten respondents, the minimum for inclusion in the dataset: Christian, Traditional, and None. Table 6 shows that for Christian identifiers, there are 973 respondents, of which 883 have complete data across the other ethnic dimensions used for this country: Race, Language, and Sect.
| Religion | Respondents | With Full Data | Sets | Mode Race | Modal Language | Modal Sect | Modal Set Respondents |
|---|---|---|---|---|---|---|---|
| Christian | 973 | 883 | 40 | White | Portuguese | Catholic | 299 |
| None | 171 | 157 | 10 | White | Portuguese | None | 58 |
| Traditional | 12 | 11 | 3 | White | Portuguese | Umbanda | 6 |
First, the crossover score calculation creates sets of options across the four ethnic dimensions. Among the respondents who identified as Christian, there are forty unique sets across the cross-dimensions.Footnote 24 The modal, or most common, among Christians is White-Portuguese-Catholic, with 299 respondents reporting this combination. Next, respondents are split between Christians (n = 883) and non-Christians (n = 168) identifiers who have full data across each dimension. The Crossover measure then seeks to assess how similar these two populations are across the other three dimension options. This requires calculating the proportions across each of the possible group types, over the three dimensions, and searching for the degree to which specific membership is shared. This is accomplished by comparing the proportion by ethnic group and taking the minimum from each, representing shared membership.
The proportions and calculations are shown in Table 7 for Christians in Brazil. First, examining the proportion of racial identification reveals broad, but not uniform, similarity to the non-Christian population. The reported aggregate shared proportion comes to 0.897, a high Crossover score between Religion and Race. Next, the exercise is repeated for Language. Because the Brazilian population speaks almost entirely Portuguese, there is a very high shared linguistic score of 0.991. On the other hand, the third dimension of Sect, by virtue of its nested nature within religion, indicates a shared membership population of 0, meaning that the Christian sects and non-Christian sects do not overlap. The Crossover score is calculated by averaging these three cross-dimension scores: (0.897+0.991+0)/3 = 0.629. This implies moderate to high Crossover between Christians and non-Christians in Brazil. On one hand, Racial and Linguistic palettes are highly similar; however, specific belief systems represented by sects are totally dissimilar.
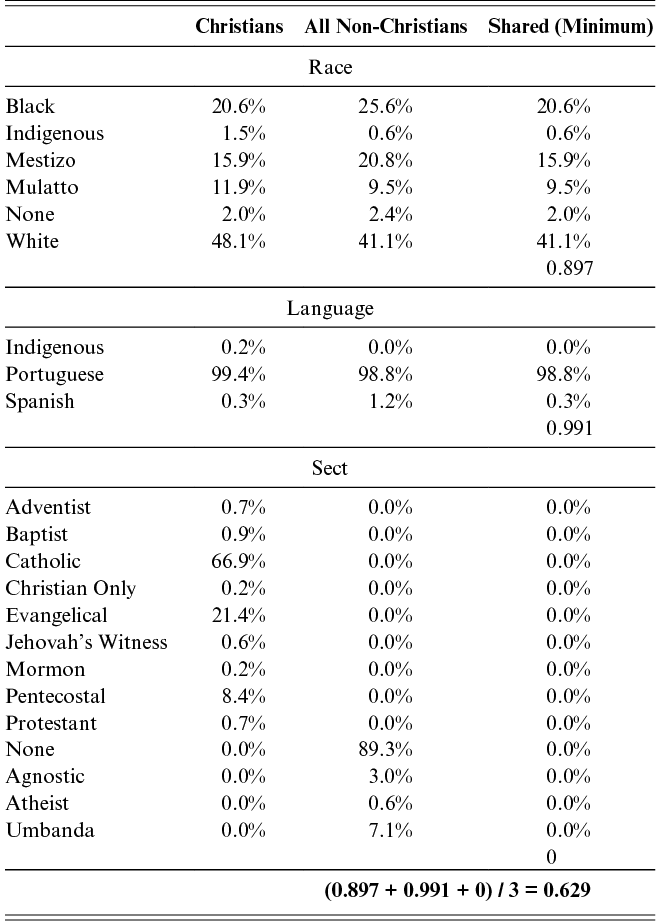
Table 7 Long description
This table has three sections. The goal of the table is to show how the crossover score is calculated, using the example of for the group “Christian” from Brazil. The first part of the table shows the distribution of racial identities for Christians and non-Christians in two columns and the shared value for each racial group in the third column. These shared overlaps are then aggregated into the value 0.897. The second section shows the values for Language. The aggregated shared minimum across the three language is 0.991, very high similarity. The third section shows Sect. Since Sect is a sub-type of Religion, there is no shared minimum across Christian and non-Christian, resulting in a score of 0. To find the Crossover score, the three values are averaged to achieve the value 0.629.
Next, Table 8 demonstrates how Alignment is calculated for Christians in Brazil. Alignment seeks to capture how similar or diverse Christian identifiers are as a unit by taking into account the other three dimensions. In line with the “modal” or “center” ideals of what represents an ethnic group, the Alignment score first finds the modal set and measures how close the entire group membership is to this combination. As shown in Table 6, the modal combination for Christians in Brazil is White-Portuguese-Catholic (set 1), which represents 34% of the group. The calculation thus assesses each existing set and weighs it by how similar it is to the modal set, represented by the column “Proportion Aligned.” Sets where two out of three groups are similar to the modal thus receive a weight of 0.667, and one out of three receives a 0.333. The size of the set is multiplied by the proportion aligned, and then all sets (rows) are added together. After all forty sets are weighed and added (not shown due to space), the value is divided by the group count: 631.3/883 = 0.715. This medium-high alignment represents the fact that nearly all Christians in Brazil tend to speak Portuguese, and many are Catholic, though there is still meaningful racial diversity.
| Set | Race | Language | Sect | Count | Core Race | Core Lang | Core Sect | Proportion Aligned | Alignment Score |
|---|---|---|---|---|---|---|---|---|---|
| 1 | White | Portuguese | Catholic | 299 | 1 | 1 | 1 | 1 | 299 |
| 2 | Mestizo | Portuguese | Evangelical | 29 | 0 | 1 | 0 | 0.333 | 9.67 |
| 3 | Black | Portuguese | Evangelical | 50 | 0 | 1 | 0 | 0.333 | 16.67 |
| 4 | Mestizo | Portuguese | Adventist | 1 | 0 | 1 | 0 | 0.333 | 0.33 |
| 5 | None | Portuguese | Evangelical | 4 | 0 | 1 | 0 | 0.333 | 1.33 |
| 6 | Mulatto | Portuguese | Catholic | 75 | 0 | 1 | 1 | 0.667 | 50 |
| 7 | Black | Portuguese | Mormon | 1 | 0 | 1 | 0 | 0.333 | 0.33 |
| 8 | Black | Portuguese | JW | 1 | 0 | 1 | 0 | 0.333 | 0.33 |
| 9 | Indigenous | Portuguese | Evangelical | 3 | 0 | 1 | 0 | 0.333 | 1 |
| 10 | Mestizo | Portuguese | Catholic | 85 | 0 | 1 | 1 | 0.667 | 56.67 |
| …40 | — | — | — | — | — | — | — | — | — |
| — | — | — | — | — | — | — | — | Total | 631.33 |
| — | — | — | — | — | — | — | Score | 631.33/883 | = 0.715 |
4.5 Political Institutions and Contextual Variables
The relationship between ethnic group characteristics and bloc voting rates should manifest differently depending on a range of country-level variables, especially the restrictiveness or permissiveness of political institutions. I track three key features of political institutions that range in permissiveness that should incentivize voters and politicians to build electoral coalitions to differing degrees. The first is the Executive System. Because there are numerous variations on executive systems, most scholars divide them into three groups: Parliamentary, Semi-Presidential, and Presidential. The dataset covers thirty-five countries with Parliamentary systems, thirty-five with Semi-Presidential, and forty-five with Presidential. Second, Legislative Electoral Systems captures the electoral rules for the lower house of the country’s legislature, and is categorized as Proportional (62), Mixed (27), or Plurality (26). For these two variables, I rely on Bormann and Golder’s (Reference Bormann and Golder2013)Footnote 25 classification; however, they are missing data for twenty-three countries. For these remaining countries, I consult the World Bank Political Institutions dataset (Beck et al., Reference Beck, Clarke, Groff, Keefer and Walsh2001) and encyclopedic knowledge on prior elections before survey collection to sort countries into the relevant categories. See the appendix for a list of countries and their key institutional variables.
I also coded the Executive Electoral System, sorted into three categories – Indirect, Two-Round, and Plurality. For countries in which the chief executive is not directly elected, I code the system as indirect, including virtually all parliamentary systems. For countries with direct executive elections, usually for president, I sort countries into whether they have a two-round or run-off system, which does not punish voting for less popular candidates, or first-past-the-post or plurality rules, which incentivize coalition building and party consolidation. In total, the dataset includes forty countries with indirect executive selection, sixty countries with a two-round system, and fifteen with a plurality electoral rule.Footnote 26 I also include two other institutional variables, the number of legislative houses – Unicameral (47% of countries) or bicameral (53% of countries), and whether the legislature has a Party Threshold requirement of 5% or more, as accessed from Beck et al. (Reference Beck, Clarke, Groff, Keefer and Walsh2001).
In addition to the institutional rules of accessing and yielding power, the nature of the political regime surely has significant effects on the degree to which voters seek to participate in elections, their likelihood of supporting opposition parties, and their willingness and ability to coordinate around an ethnic identity. The model includes four indices from the Varieties of Democracy (V-Dem) dataset (Coppedge et al., Reference Coppedge, Gerring, Knutsen, Lindberg, Teorell, Altman and Bernhard2024). The first is the Electoral Democracy Index, which includes information on freedom of association, cleanness of elections, freedom of expression, whether officials are elected, and adult suffrage. The second is a measure of decentralization, the Division of Power Index, which captures whether the country has directly elected local and regional officials and their level of autonomy from the central government, which may influence ethnic salience, and the degree of representation (Horowitz, Reference Horowitz2000; Lublin, Reference Lublin2014).
The Clientelism Index from V-Dem works to capture the extent to which access to resources is contingent upon political support. Clientelism has been tied to ethnic politics by numerous scholars, including Alesina et al. (Reference Alesina, Baqir and Easterly1999), who argue that more ethnic diversity encourages patronage seeking, leading to lower effective public service delivery. On the other hand, others have also observed that existing patronage patterns seem to make ethnic attributes more salient (Caselli and Coleman, Reference Caselli and Coleman2013; Chandra, Reference Chandra2007).
Violence and discrimination are intimately connected to social identities. Members of groups that are actively discriminated against may feel less incentivized to vote by increased fear and pessimism (Cederman et al., Reference Cederman, Wimmer and Min2010; Aldama et al., Reference Aldama, Vuez-Cort and Young2019). State-led repression has been shown by scholars to decrease political participation among ethnic minorities and opposition party supporters through increased fear and pessimism (Aldama et al., Reference Aldama, Vuez-Cort and Young2019; Young, Reference Young2019). On the other hand, past ethnic violence can also solidify and strengthen identity and group coordination (Hadzic et al., Reference Hadzic, Carlson and Tavits2020). To account for these dynamics, I include the Physical Violence Index (V-Dem), which represents the freedom from political killings and torture.
The level of modernization within a country has been argued to reduce the salience of ethnic identities in the political process (Lipset, Reference Lipset1959; Melson and Wolpe, Reference Melson and Wolpe1970; Norris, Reference Norris2004). In developing countries, scholars have observed that citizens rely more heavily on social identities because of lower average levels of education and access to information (Birnir, Reference Birnir2007; Conroy-Krutz, Reference Conroy-Krutz2013). Within such environments, ethnic attributes are typically the easiest way to identify political allies (Chandra, Reference Chandra2007). To account for economic development, I include a logged version of the country’s GDP Per Capita in the year of survey collection. In addition, I gather information on Land Area and Population using World Bank data to control for the number of persons and logistics around coordination. The three variables are logged and then standardized between 0 and 1 for ease of interpretation.
In addition, dummy variables are included for attachment to the top two most popular parties – First Party and Second Party. This helps account for the likelihood of attaching to a party that has a high likelihood of achieving power, especially in majoritarian systems. Lastly, two sets of fixed effects are included in all analyses. Group Type, which includes categories for all identity dimensions (with Caste combined into Race), as these likely vary in systematic and unknown ways. Second, Survey Fixed Effects are included to help account for the idiosyncrasies of question wording and sampling across the diverse set of surveys included.
4.6 Correlations between Independent Variables and Group Size
Prior to the main analysis of bloc voting, it’s important to assess the relationships between group size and the other group characteristic variables. In Figures 2–4, Group Size is compared to Alignment, Crossover, and Concentration. Each point represents an ethnic group, and a line of fit using Loess smoothing is shown in red along with 95% confidence intervals.
Figure 2 plots the relationship between Alignment and Group Size. The Pearson correlational coefficient for the two variables is 0.072 (T = 3.62). This very weak correlation highlights the finding that within-group homogeneity is not heavily concentrated among smaller groups. The correlation between Crossover and Group Size is more dynamic. The overall Pearson correlation between Crossover and Group Size is 0.170 (T = 8.73). As shown in Figure 3, the most dynamic part of the relationship is observed among very small groups, between less than 1% and around 10%. Moving from a smaller to a larger size within this range results in a meaningful increase in Crossover score. Between 10% and 99% of the population, there is very little difference. This highlights that groups smaller than 10% have, on average, greater differentiation when using the Crossover measure.
Alignment-Group Size Correlation
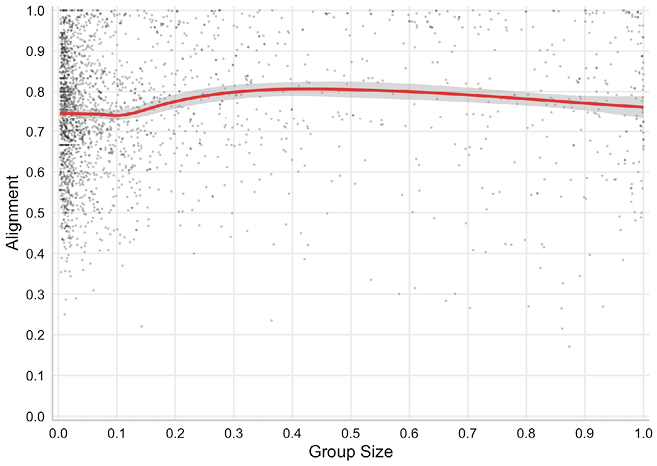
Crossover-Group Size Correlation
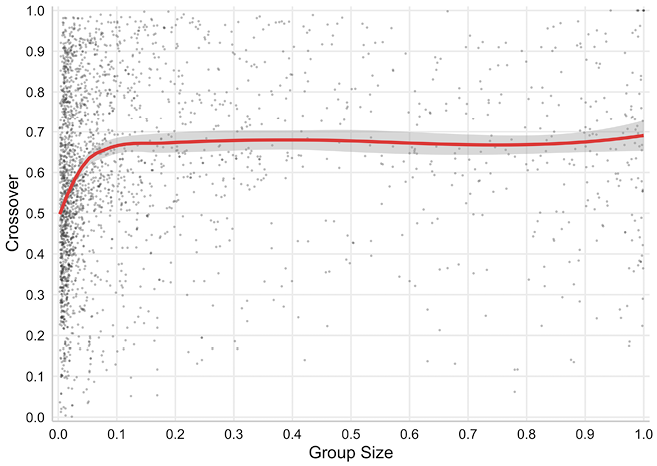
There is a much stronger negative correlation between the variables Group Size and Concentration, with a Pearson’s coefficient of −0.337 (T = −18.09). Figure 4 highlights that this strong negative relationship is again focused among groups between less than 1% and 25% of the population, after which the negative fit line is very gradual. This affirms the intuitive logic that small social groups are, on average, much more likely to be geographically clustered.
Concentration-Group Size Correlation
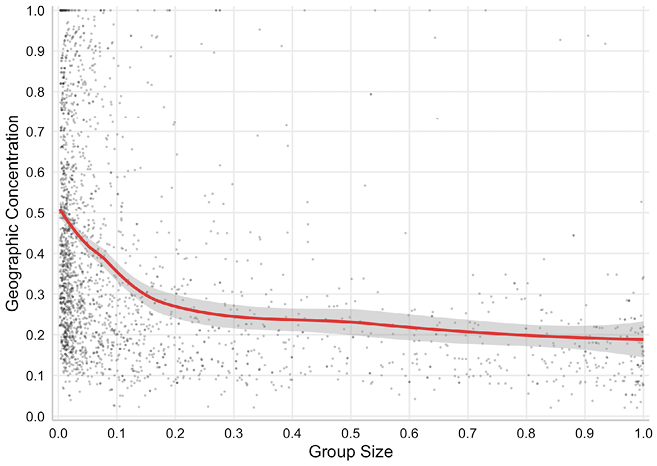
While not shown, the relationship between the dichotomous Discrimination measure and Group Size is overall negative and a weak Pearson’s coefficient of −0.075 (T = −3.79). The data show that the vast majority of discriminated against ethnic groups fall between 5% and 10%, and there are very few examples of discriminated groups greater than 25%.
4.7 Study Limitations
The approach to testing laid out in this section is not without its limitations or drawbacks. First, the use of survey data introduces potential biases associated with survey research more generally, such as social desirability bias, question wording, or fixed response options. For example, respondents may have provided misleading or false information on their ethnic identities or political support, particularly in countries where such issues are more sensitive. Because data are pulled from a variety of different sources, question wording and response options also differ across sets of countries. The appendix lists all question wording and response options available for each survey series. These issues are partially controlled for by including survey series controls in all statistical analyses. While gathering information on multiple types of identities is an important aspect of social group research, this analysis is, of course, not exhaustive in the types of social identities examined.
Sections 2 and 3 also point to the fact that ethnic identities are not fixed, and there are multidirectional interactions between identity expression and the political environment. Individuals sorted into ethnic groups through the surveys range in their degrees of salience or activation – some individuals are “distant” from the ideal type and may change expression. The analysis relies on sorting respondents into defined categories, though scholars rightly recognize that even more stable identities like most ethnicities are fluid and individuals may feel closer or farther away from the group ideal (Harris, Reference Harris2022). Thus, this analysis of bloc voting assumes that individuals are self-identified and know something about who is associated or not with their ethnic group (Harris and Findley, Reference Harris and Findley2014). A useful feature to include in the analysis would also be a measure of the strength or salience of each identity held by the survey respondent; however, such a question is not included for most of the surveys used to create this dataset. In some surveys, options like “mixed” ethnicities are included as standalone groups, which may help mitigate situations where many people do not feel close to a particular core ethnic identity. Still, data aggregation necessitates overlooking such nuances.
The study does not include nonethnic social identities that are important in many contexts of electoral politics such as gender (Giger, Reference Giger2009; Inglehart and Norris, Reference Inglehart and Norris2000; Iversen and Rosenbluth, Reference Iversen and Rosenbluth2006), sexuality (Turnbull-Dugarte, Reference 100Turnbull-Dugarte2020; Smith and Boas, Reference Smith and Boas2024), urban and rural locations (Mettler and Brown, Reference Mettler and Brown2022; Huijsmans and Rodden, Reference Huijsmans and Rodden2025), education (Stubager, Reference Stubager2013; Attewell, Reference Attewell2022) or income (Han, Reference Han2016; Jansen, Evans, and De Graaf, Reference 93Jansen, Evans and De Graaf2013). The types of identities selected for each country are significantly informed by the inclusion of questions by the survey creators. These selections rely on regional expertise but are not standardized. It is likely that more idiosyncratic, but important, social identities are omitted from the analysis by focusing solely on ethnicity.
The environment and circumstances, including political institutions (Chandra, Reference Chandra2007; Posner, Reference Posner2005) and the ethnic group that controls them (Green, Reference Green2021), can reshape who identifies as a member of a group. While this project seeks to understand how political institutions influence bloc voting across ethnic group characteristics, there is evidence that political institutions also affect underlying group characteristics, especially group size, over the medium to long term.
There are also drawbacks concerning the level of testing and how to engage with political institutions. Some analyses evaluate social group dynamics at the electoral district level, which provides a more precise estimation regarding the relationship between the electoral system and social groups. However, this information is not broadly available and is beyond the scope of this project. Political institutions are also not distributed randomly, but influenced by outside actors, colonial legacies, and existing social cleavages, among other reasons (Blais and Massicotte, Reference Blais and Massicotte1997; Kitschelt et al., Reference Kitschelt, Mansfeldova, Markowski and Toka1999; Golder and Wantchekon, Reference 91Golder and Wantchekon2004; Rovny, Reference Rovny2014). Benoit (Reference Benoit2007) argues that, to some degree, party systems, electoral systems, and social cleavages are all endogenously related (see Section 2). There are also important choices and strategies undertaken by political parties around how they engage with members of particular social groups on a country-by-country basis. While controlling for general political conditions, idiosyncratic relationships between prominent members of social groups and political parties are not accounted for in this analysis.
5 Illustrative Cases
To better understand the dataset and group characteristic variables, this section presents four well-known country cases where ethnic identities are considered highly salient in politics. These countries were not selected to test a hypothesis; they simply present the group-level data and a supporting narrative to help comprehend bloc voting trends. In selecting the cases, I have prioritized geographic/regional diversity as well as countries of significant scholarly interest. The section briefly overviews examples, and which specific social groups and identity dimensions demonstrate the highest rates of bloc voting. The data are gathered from one single point in time, and the bloc voting rates per social group undoubtedly shift over time based on numerous societal factors, not to mention the composition and alignment of the party system. Also note that ethnic group names may appear multiple times in the figures under different dimensions, for example, “Jewish” is captured as a race, nation, major religion, and sect in the Israeli case.
5.1 Bosnia and Herzegovina
Following economic decline during the 1980s, the Yugoslav federation began to break apart in 1991, resulting in a complex and identity-centered civil war, and the eventual creation of six new nation-states. Conflict in the territory that is now Bosnia and Herzegovina was considered the deadliest, with over 100,000 estimated killed and two million displaced (UN, 2025). The conflict ended in 1995 through the Dayton Agreement. This past conflict and other historical circumstances have greatly reinforced social identity markers in Bosnia and Herzegovina, where the population continues to suffer from past trauma (Bringa, Reference Bringa1995).
In Bosnia and Herzegovina, the most prominent social identity cleavages center around three ethnic-national groups – Bosniaks, Serbs, and Croats – that also strongly correlate with language. In addition to these linguistic and ethnic identities, there is a strong pattern of alignment (differentiation) across religious affiliations – Muslim, Christian Orthodox, and Christian Catholics. Thus, these three dimensions of difference – ethnicity, language, and religion – have often been viewed as reinforcing feelings of group identity and difference from members of other groups (Velikonja, Reference Velikonja2003; Ramet, Reference Ramet2018).
Given the past ethnic conflict and the young age of the country, it’s not surprising that national identity and social cohesion remain weak (Džankić, Reference Džankić2015; Keil and Perry, Reference Keil and Perry2016). The resulting disunity and distrust between social group members have been blamed for impeding economic development and the application of social justice (Hulsey, Reference Hulsey2010). As is the case for many divided societies, the largest ethnic group – Bosniaks – has sometimes sought to transplant their own cultural identity into the national ethos (Džankić, Reference Džankić2015).
Scholars have also observed that the political settlement and systems established through the Dayton Agreement have reinforced or institutionalized ethnic identity (O’Leary, Reference O’Leary2005; Keil and Perry, Reference Keil and Perry2016). This can be observed through the presupposition that politics would function as a power-sharing arrangement between ethnic groups and is expressed practically through features like the electoral system mandating ethnic quotas that encourage political party-ethnic alignment (Bieber, Reference Bieber2006; Kapidžić, Reference Kapidžić2015). Political leaders have also commonly leaned on these salient identities to mobilize constituencies, and the central ethnic divisions are so salient that ethnic group bloc voting is often thought of as the expected and rational thing to do in order to protect the interests of the group (Mujkić and Hulsey, Reference Mujkić and Hulsey2010).
According to the survey data, the largest linguistic group is Bosnian at 65%, followed by Serbian (24%) and Croatian (11%). The population is also divided along religion and sect. Bosnians are primarily Muslim (43% of the total population), while Serbs and Croats are majority Christian (53% of the total population). Furthermore, Serbs are majority Orthodox, while Croatians are majority Catholics. This results in a situation of lower crosscutting within the population, measured by overall very high Alignment within groups and moderate levels of Crossover.
Figure 5 shows the ethnic groups, their size, and political party attachment plotted across the variables Concentration and Group Vote Difference, as measured from survey data collected in 2017. The Group Vote Difference measure is the proportion of group member that support their most supported party minus the proportion of the entire population supporting that party. All social groups, aside from European race (almost the entire population), demonstrate medium or high degrees of bloc voting. Catholics (16% of the population) exhibit the strongest bloc voting rate, with 41% supporting the Croatian Democratic Union political party, which only boasted 7% nationally. Muslim and Bosnian group members supported the largest party (27% of respondents overall), and demonstrated somewhat lower, though still above average, bloc voting rates. Serbian speakers and Orthodox identifiers tended to support the second largest party – the Alliance of Independent Social Democrats. Thus, for each of the main aligned social groups, each predominantly supports a different political party whose rank corresponds with that of the group. In general, smaller and more concentrated groups have a higher bloc voting score.
Bosnia and Herzegovina Bloc Voting Analysis
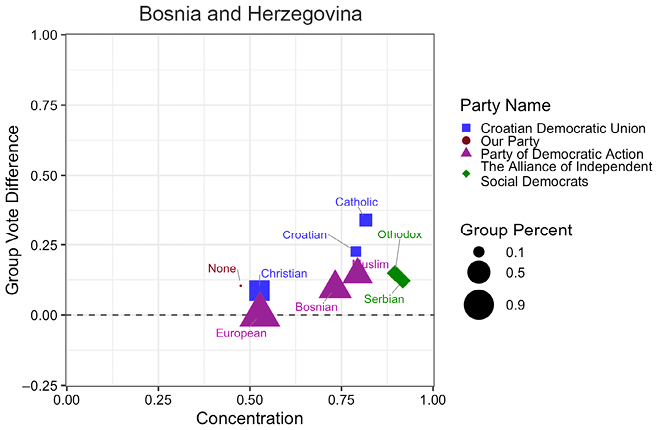
Figure 5 Long description
About ten plot points are shown, which range in size, group type. Most groups have high concentration. In this case, religious sect such as Catholic and Orthodox have higher Group Vote Difference. Among the three largest parties, Catholic and Croatian speaker support one party, Orthodox and Serbian speakers support a second, and Muslim and Bosnian speakers support a third.
5.2 India
India is considered the largest and most socially diverse democracy with a current population of around 1.4 billion people. A range of different types of social identity dimensions have played key roles in society and politics, especially religion, ethnicity, and caste. Given the country’s size and federalized system, the localized combinations of social identities and proportions of various groups have direct impacts on state-level politics and rates of bloc voting at this level (Chandra, Reference Chandra2007). Not only do ethnicity, language, and religion vary regionally, but caste, class, and occupation do as well (Yadav and Palshikar, Reference Yadav and Palshikar2009). High social diversity, a very large population, and a parliamentary system have resulted in highly complex bargaining and coalition formation of governments (Ruparelia, Reference Ruparelia2015). It’s also important to remember that the formal political institutions were largely established first by British colonial rulers prior to national independence (Chatterjee, Reference Chatterjee1993; Verghese, Reference Verghese2016).
Perhaps the most studied and commented on ethnic dimension in contemporary analysis has been religion. In the survey data, 81% of respondents identified as Hindu, 11% as Muslim, 1.5% as Christian, and less than 1% as Buddhist and no religion. Scholars have documented a long history of social tensions between the majority Hindu population and the Muslim minority, especially in border communities (Brass, Reference Brass2011; Varshney, Reference Varshney2003). Episodic violence has been part of the story, going back to Partition in 1947, which reinforced religious differences, resulted in up to 1 million deaths, and uprooted the lives of many more millions (Roy, Reference Roy2018). In recent years, observers of Indian politics have noted the leveraging of “Hindu nationalism” as a potent political vehicle for securing power led by the Bhartiya Janata Party (BJP) and Prime Minister Narendra Modi (Anderson and Longkumer, Reference Anderson and Longkumer2018; Andersen and Damle, Reference Andersen and Damle2019; Chatterji, Hansen, and Jaffrelot, Reference Chatterji, Hansen and Jaffrelot2019). This builds on a history of politicians strategically mobilizing ethnic identities, especially religious ones, for political gains (Wilkinson, Reference Wilkinson2006).
In addition to religious cleavages, twenty-five linguistic groups are included in the sample as well as four generalized Caste groupings. In the case of linguistic groups, the largest is Hindi at 24% of the sample, and the mean size is only 4%. The majority of ethnic groups were aligned with one of the two major parties at the time – the BJP or the Indian National Congress (INC). In terms of religion, Hindu identifiers were somewhat more supportive of BJP, while Muslims and Christians were aligned with INC. Note that in Figure 6, religious and caste groups are quite geographically dispersed. Overall, linguistic, religious, and caste groups vary significantly in their degree of bloc support for either party.
India Block Voting Analysis
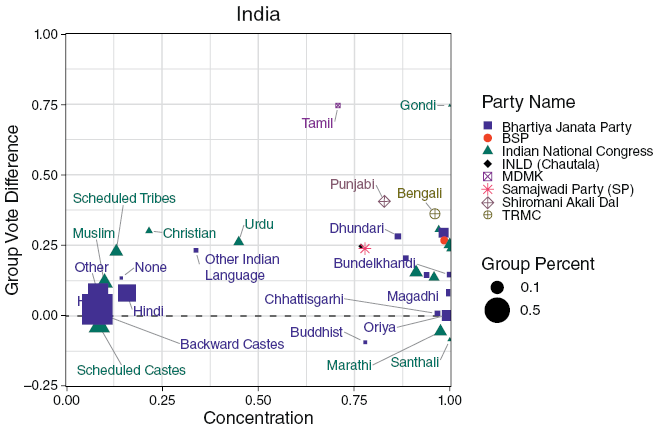
Figure 6 Long description
In this figure, dozens of symbols are plotted, representing different Castes, Religions, Sects, and Language ethnic groups. Groups are attached to eight different political parties. Some are very dispersed geographically, other are concentrated. A select number of smaller ethnic identities are highly aligned with smaller parties, especially Tamil speakers and Gondi speakers.
Among a handful of linguistic groups, however, members strongly supported a smaller political party, resulting in a high Group Vote Difference score. The most prominent example is the Tamil speakers from southern India, 77% of whom reported voting for the small regionalist Party MDMK, which in total only garnered 1.7% of the national vote. Other linguistic groups that primarily supported a small party included Punjabi speakers (43% support for SAD at 1.7% of the national total), Bengali speakers (39% vote for TRMC at 2.6% of the national total), Awadhi (31% support for BSP at 4.1% of the national total), Haryanavi speakers (26% for INDL at 1.5% of the national total), and Bhojpuri speakers (29% for SP at 5.1% of the national total). Many of these groups maintain a strong ethnic-regional identity and have been significantly impacted by political events such as Partition in regions like Punjabi and Bengali.
Urdu speakers, who represent 3.1% of the sample, are the only linguistic group to report being majority Muslim. The group demonstrates a high rate of bloc voting for the INC, supported by 52% of group members relative to 25% across the sample. Muslim adherents, and therefore Urdu speakers, are categorized as discriminated against by the EPR dataset. Thus, while this likely increases bloc voting, there are also numerous examples of relatively small linguistic groups that heavily support a localized party to enhance representation more generally. Clearly, though, India’s parliamentary system allows for smaller political parties strongly supported by smaller ethnic groups instead of necessarily attaching to one of the two largest parties.
5.3 Israel
Another renowned example of politicized ethnic identities is the case of Israel. Like other similar situations, salient identities in Israeli politics are significantly informed by its controversial establishment and unresolved social and economic inequalities, resulting in numerous conflicts with its territory as well as with neighboring states (Kelman, Reference Kelman1999; Kimmerling, Reference Kimmerling2008; Adler, Reference Adler2012). Israel, while boasting liberal institutions and free and fair elections during its history, has also lacked pluralism and equal rights for all social groups, resulting in deep feelings of resentment (Smooha, Reference Smooha1997; Ghanem, Reference Ghanem1998). Scholars have also commented on how geographic segregation between social groups has helped to solidify perceived differences and reduce positive modes of contact (Yiftachel, Reference Yiftachel2001).
Ethnic identities play a central role in political party support, including the dimensions of race (Jewish, European, or Arab options), religion, and ethnicity-nation. Again, many of these salient dimensions tend to align with one other group type, resulting in weak crosscutting, especially for Arab and Palestinian Muslims or Christians. In the survey, ethnic-national groups Arab and Palestinian, as well as Muslim adherents, are all considered separate, and each of these groups is coded as being Discriminated against according to EPR data. Not only do the primary ethnic dimensions differ for Palestinians living in Israel related to language and religion, but discrimination and class inequality further deepen feelings of antipathy (Anderson and Yaish, Reference Andersen and Yaish2003; Lewin-Epstein and Semyonov, Reference Lewin-Epstein and Semyonov2019).
Another source of social division is between more liberal-secular ethnic Jews and those who are more orthodox or conservative (Fischer, Reference Fischer2016). Here, the category of ethnicity or nation (which reflects these religious-political ideological differences) becomes salient and creates diverse political constituencies within the larger Jewish population, which comprises about 78% of the sample. Among the ethnic Jewish identifiers, there are also differences around the region of origin (Smooha, Reference Smooha2019).
Israel maintains a parliamentary executive with proportional elections and a party threshold of 3.25%. Interestingly, some scholars have noted that past changes in the electoral rules did not significantly influence bloc voting across ethnicity, class, and religious identification (Anderson and Yaish, Reference Andersen and Yaish2003). Still, these more permissive institutional structures should encourage smaller social groups and strongly supported political parties. The election prior to these survey data being collected was held in March 2015, in which ten parties reached the threshold marker and gained representation in parliament, resulting in a fractured and diverse party system. The Joint List was a political alliance of four Arab-majority political parties, which received an estimated 82% of the Arab vote in Israel with a significantly higher turnout compared to the previous election (Solomon, Reference 99Solomon2015).
The survey data confirm high levels of bloc voting for the Joint List among Arabs, Muslims, Palestinians, and to a lesser extent, Christians, as highlighted in Figure 7.Footnote 27 Compared to the 10% overall support for the Joint List, Arab ethnic identifiers supported the alliance at 66%, Muslims at 66%, Arab racial identifiers at 56%, and Christians at 34%. It’s also worth noting that all of these social groups have much greater geographic concentration relative to others in the population. The largest social groups – Jewish ethnicity and race – supported the Likud party, though with lower bloc voting rates, meaning their vote was fairly split across the top two parties. Some small social groups also support smaller parties, demonstrating moderate levels of bloc voting, including Ukrainian ethnic identifiers supporting Yesh Atid (33% support compared to 7% overall), Druze religious adherents supporting Kulanu (28% compared to 5% overall), and Ashkenazi identifiers supporting the United Torah Judaism party (19% compared to 4% overall). Overall, the Israeli political system is characterized by high rates of bloc voting, particularly non-Jewish ethnic, racial, and religious groups, many of which are discriminated against. The Israeli case reiterates the general findings on the importance of ethnic distinction, including patterns of discrimination, low crosscutting, and geographic concentration.
Israel Block Voting Analysis
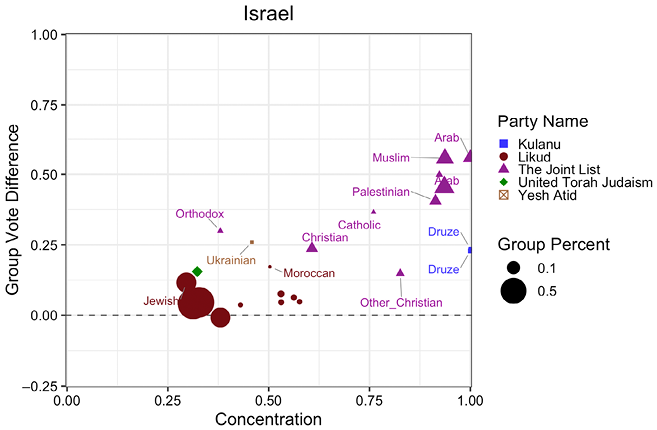
Figure 7 Long description
About twenty-five symbols are shown for the Israel figure. The group types cover Nation, Race, Religion, and Sect. In this figure, the larger groups are less concentrated and have lower Group Vote Performance scores, especially the Jewish/Israeli identities. However, Arab, Muslim, and Palestinians are highly concentrated and have high bloc voting rates for a different party.
5.4 Zambia
Ethnicity has been a central factor in vote choice in Zambia since national independence (Erdmann, Reference Erdmann2007; Scarritt, Reference Scarritt2006; Kim, Reference Kim2017; Gondwe, Reference Gondwe2018), though its nature has shifted over time (Erdmann, Reference Erdmann2007; Osei-Hwedie, Reference Osei-Hwedie1998), including a more significant emphasis on tribal or/and smaller identity groups during the single-party era (Motelo, Reference Molteno1974; Posner, Reference Posner2005). Overall, however, linguistic groups have remained the primary identity of political salience. The highly diverse linguistic landscape includes over seventy recognized languages, but these may be aggregated into seven language clusters or families (Ohannessian and Kashoki, Reference Ohannessian and Kashoki2017; Gondwe, Reference Gondwe2018). Language use and education, as devised during colonial rule, has had a significant influence in consolidating these ethnolinguistic distinctions (Kashoki, Reference Kashoki1978; Posner, Reference Posner2005).
Posner (Reference Posner2004b) argues that the larger ethnolinguistic cleavages, compared to smaller languages or ethnic identities, have become the most politically salient due to their relative size and therefore usefulness in being part of a winning electoral coalition. Coalition building in Zambia is thus a balancing act between retaining core ethnic constituencies and not alienating citizens from other ethnolinguistic groups (Posner, Reference Posner2005; Scarritt, Reference Scarritt2006). The intersection of ethnicity with economic sector/interests/urban has been one way to build a larger coalition in Zambia (Kim, Reference Kim2017; Resnick, Reference Resnick2013), and researchers have found that ethnically diverse areas are correlated with higher government expenditure in Zambia, probably as coalition coalition-building electoral strategy (Gibson and Hoffman, Reference Gibson and Hoffman2013).
The Round 6 Afrobarometer survey was conducted during a period of political flux in Zambia, in which ethnolinguistic constituencies were realigning with political parties (Friesen, Reference Friesen2019). Between 1991 and 2011, the Movement for Multiparty Democracy (MMD) held power but lost to Michael Sata and the Patriotic Front (PF) in 2011, with MMD coming in second. President Sata, however, suddenly died while in office in October 2014, prompting an early presidential election in January 2015. With the MMD not running a candidate, the main challenger to the PF’s candidate – Edgar Lungu – came from the United Party for National Development (UPND), who narrowly lost. The survey data were collected shortly after in October 2015.
At the time of the survey, the ruling PF held 35% support among respondents, 19% supported UPND, and 8% supported MMD. Though a presidential system with plurality house election rules, and thus being highly restrictive, all the elections from 2001 to 2011 had three or more competitive parties, where each received between 10% and 45% of the vote. Since 2015, however, PF and UPND have been electorally dominant, more closely resembling a classic two-party system. In 2015, a remaining ethnic core of constituents in Eastern Province continued to support MMD – Chewa, Ndebele, Lenje, and Lamba ethnic groups and Ngoni language speakers.
Figure 8 shows that the major linguistic group of Tonga speakers, along with a range of other ethnic-based groups primarily centered in the southern and western parts of the country, strongly supported UNDP. Tonga speakers supported UPND at 51%, compared to the party’s national average of 19%. On the other hand, the largest linguistic group – Bemba – supported the PF at 52% relative to the party’s 35% national average. Since the vast majority of the Zambian population identifies as Christians, there is no real variation on the religious dimension, and denominational differences do not appear to be salient. Again, this displays a pattern similar to Bosnia and Herzegovina, where three of the largest ethno-linguistic groups (here also centered on region) supported three different parties, with various small- or medium-sized groups exhibiting higher rates of bloc voting.
Zambia Bloc Voting Analysis
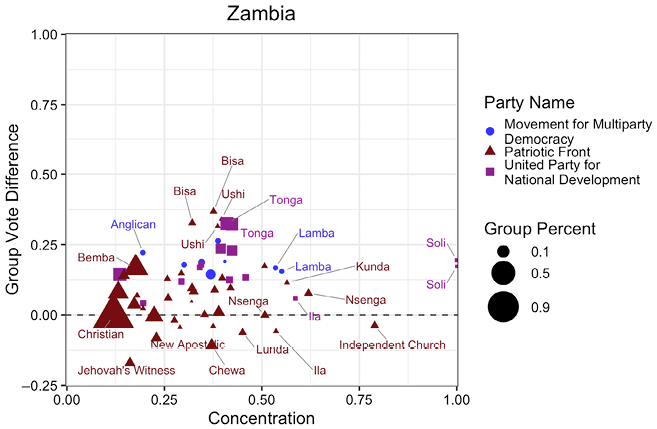
Figure 8 Long description
About thirty symbols are plotted for Zambia covering Religion, Sect, Language, and Tribe ethnic group types. Most have lower geographic concentration. The largest identities support the larges parties and have low Group Voter Performance scores. However, smaller Linguistic and Tribal group types support to rival parties, which demonstrate medium to high Group Vote Performance
5.5 Top Bloc Voting Groups
Tables 9a–9c presents the top fifty ethnic groups ranked by bloc voting (Group Vote Difference) within the sample. The vast majority of groups are less than 5%, though this is also true of the entire dataset. Note that ethnic group types that perfectly overlap are included together, for example, Eggon identifiers in Nigeria across both language and tribe dimensions.
| Country | Name | Dimension | Size | Alignment | Crossover | Concentration | Discriminated | Group Vote | Group Vote Difference |
|---|---|---|---|---|---|---|---|---|---|
| Ethiopia | Tigirigna | Language | 6.3% | 0.99 | 0.32 | 0.91 | 1 | 0.808 | 0.757 |
| Ethiopia | Tigraway | Tribe | 6.8% | 0.97 | 0.34 | 0.79 | 1 | 0.759 | 0.708 |
| Kenya | Pokot | Tribe | 1.0% | 0.79 | 0.45 | 0.92 | 0 | 0.760 | 0.682 |
| Kenya | Pokot | Language | 1.1% | 0.78 | 0.46 | 0.93 | 0 | 0.731 | 0.653 |
| Ethiopia | Derashigna | Language | 0.5% | 0.78 | 0.37 | 1.00 | 0 | 0.667 | 0.625 |
| Kenya | Luo | Language + Tribe | 10.8% | 0.74 | 0.55 | 0.49 | 1 | 0.814 | 0.547 |
| Ethiopia | Dershe | Tribe | 0.6% | 0.78 | 0.37 | 1.00 | 0 | 0.571 | 0.529 |
| Kenya | Kikuyu | Language | 20.2% | 0.75 | 0.53 | 0.41 | 0 | 0.855 | 0.49 |
| Kenya | Kalenjin | Tribe | 9.5% | 0.72 | 0.57 | 0.88 | 0 | 0.559 | 0.481 |
| Kenya | Kikuyu | Tribe | 20.5% | 0.75 | 0.53 | 0.40 | 0 | 0.845 | 0.48 |
| Tanzania | Washirazi | Tribe | 1.5% | 0.77 | 0.27 | 0.24 | 1 | 0.528 | 0.463 |
| Ethiopia | Baptist | Sect | 0.8% | 0.74 | 0.42 | 0.46 | 0 | 0.500 | 0.461 |
| Malawi | Qadiriya Brotherhood | Sect | 0.9% | 0.91 | 0.22 | 0.69 | 0 | 0.591 | 0.452 |
| Ethiopia | Kembata | Tribe | 0.8% | 0.65 | 0.42 | 0.37 | 0 | 0.842 | 0.441 |
| South Africa | Swazi | Language | 2.5% | 0.86 | 0.74 | 0.77 | 0 | 0.883 | 0.438 |
| Kenya | Presbyterian | Sect | 2.1% | 0.73 | 0.58 | 0.28 | 0 | 0.800 | 0.435 |
| Mozambique | Xitsua | Tribe | 0.6% | 0.57 | 0.50 | 1.00 | 0 | 0.929 | 0.432 |
| Mozambique | Nhungue | Tribe | 0.7% | 0.69 | 0.48 | 0.78 | 0 | 0.562 | 0.423 |
| Country | Name | Dimension | Size | Alignment | Crossover | Concentration | Discriminated | Group Vote | Group Vote Difference |
|---|---|---|---|---|---|---|---|---|---|
| Cote d’Ivoire | Gnanboua | Language | 0.8% | 0.70 | 0.45 | 0.58 | 0 | 0.900 | 0.708 |
| Nigeria | Eggon | Language + Tribe | 0.7% | 0.94 | 0.28 | 1.00 | 0 | 1.000 | 0.606 |
| Nigeria | Kagoma | Language + Tribe | 0.6% | 0.81 | 0.30 | 1.00 | 0 | 1.000 | 0.606 |
| Nigeria | Yala | Language + Tribe | 0.6% | 0.79 | 0.25 | 1.00 | 0 | 0.929 | 0.535 |
| Nigeria | Tarok | Language | 0.8% | 0.89 | 0.34 | 1.00 | 0 | 0.895 | 0.501 |
| Nigeria | Tarok | Tribe | 0.8% | 0.91 | 0.34 | 1.00 | 0 | 0.889 | 0.495 |
| Nigeria | Nwangavul | Language + Tribe | 0.6% | 0.79 | 0.37 | 1.00 | 0 | 0.867 | 0.473 |
| Nigeria | Juku | Tribe | 0.9% | 0.75 | 0.49 | 0.57 | 0 | 0.857 | 0.463 |
| Sierra Leone | Sherbo | Language | 1.2% | 0.79 | 0.61 | 0.46 | 0 | 0.786 | 0.448 |
| Nigeria | Jukun | Language | 0.8% | 0.75 | 0.49 | 0.52 | 0 | 0.833 | 0.439 |
| Togo | Peulh | Language | 1.0% | 0.89 | 0.15 | 0.85 | 1 | 0.833 | 0.420 |
| Cote d’Ivoire | Sénoufo | Language | 7.3% | 0.69 | 0.51 | 0.18 | 0 | 0.693 | 0.414 |
| Country | Name | Dimension | Size | Alignment | Crossover | Concentration | Discriminated | Group Vote | Group Vote Difference |
|---|---|---|---|---|---|---|---|---|---|
| India | Tamil | Language | 0.4% | 0.82 | 0.85 | 0.71 | 0 | 0.765 | 0.748 |
| India | Gondi | Language | 0.3% | 1.00 | 0.60 | 1.00 | 0 | 1.000 | 0.747 |
| New Zealand | Indigenous | Nation | 2.6% | 0.58 | 0.49 | 0.68 | 0 | 0.909 | 0.659 |
| New Zealand | Indigenous | Language | 1.4% | 0.72 | 0.37 | 0.72 | 0 | 0.833 | 0.583 |
| Israel | Arab | Nation | 8.3% | 0.84 | 0.12 | 1.00 | 1 | 0.660 | 0.559 |
| Israel | Muslim | Religion + Sect | 12.4% | 0.80 | 0.10 | 0.94 | 1 | 0.658 | 0.557 |
| Romania | Hungarian | Language | 8.0% | 0.81 | 0.68 | 0.15 | 1 | 0.600 | 0.55 |
| Austria | Turkish | Nation | 1.1% | 0.87 | 0.14 | 0.40 | 0 | 0.730 | 0.502 |
| Israel | Muslim | Nation | 2.0% | 0.97 | 0.15 | 0.92 | 1 | 0.600 | 0.499 |
| Pakistan | Khappi | Language | 0.8% | 1.00 | 0.96 | 1.00 | 0 | 0.600 | 0.495 |
| Pakistan | Sindhi | Language | 14.2% | 0.83 | 0.85 | 0.91 | 0 | 0.712 | 0.492 |
| Romania | Protestant | Sect | 2.9% | 0.95 | 0.73 | 0.18 | 0 | 0.535 | 0.485 |
| Pakistan | Barahvi | Language | 2.8% | 1.00 | 0.96 | 1.00 | 0 | 0.485 | 0.463 |
| Israel | Arab | Race | 16.9% | 0.61 | 0.05 | 0.94 | 1 | 0.555 | 0.454 |
| Taiwan | Indigenous | Nation | 1.0% | 0.86 | 0.28 | 0.49 | 1 | 0.750 | 0.441 |
| Austria | Turkish | Language | 2.5% | 0.79 | 0.25 | 0.44 | 0 | 0.659 | 0.431 |
| Romania | Christian Reformed | Sect | 4.6% | 0.92 | 0.74 | 0.14 | 0 | 0.478 | 0.428 |
| Burma/Myanmar | Maw Shan | Nation | 1.4% | 1.00 | 0.64 | 0.77 | 1 | 0.435 | 0.423 |
| Norway | Muslim | Religion + Sect | 1.2% | 0.67 | 0.34 | 0.42 | 0 | 0.667 | 0.416 |
| Austria | Muslim | Religion + Sect | 3.5% | 0.73 | 0.39 | 0.51 | 0 | 0.643 | 0.415 |
6 Party Attachment and Bloc Voting
Before turning to models on how group characteristics interact with political institutions to generate differing patterns of bloc voting, this section overviews the descriptive data, explores the correlations around which parties (by ranking) ethnic groups primarily align with, and then presents the base model for predicting bloc voting. Together, these more straightforward analyses lay the groundwork for the more complex models presented in Section 7.
6.1 Descriptive Trends
Understanding bloc voting requires accounting for group characteristics in concert with party dynamics and political institutions. This section presents the descriptive data related to the Group Vote Difference (Group Vote – Party Percent) across group size, crosscutting measures, and ethnic dimensions. Group Vote Difference measures whether the ethnic group overperforms or underperforms their most supported party’s popularity.
First, how does Group Size relate to Group Vote Difference before the introduction of model controls? Figure 9 shows the resulting correlation using loess smoothing for each ethnic dimension across Group Size. Because of the outcome, larger groups begin to approach a score of zero as they approach the entire population. Across all Group Percentages, however, some ethnic groups overperform and underperform. Across the dimensions, Language and Tribe tend to have somewhat higher bloc voting groups than other dimensions. Figure 9 draws attention to two potential findings. First, very small groups (<2%) tend to have the highest bloc voting rates. On the other hand, bloc voting seems to increase between about 5% and 20% for select dimensions.
Group Vote Percentage by Group Type
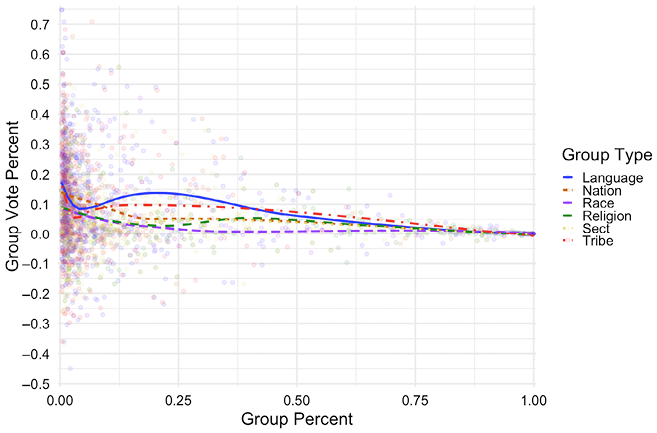
Next, Figure 10 plots the two crosscutting variables with ethnic groups shaded depending on their Group Vote Difference score. A loess fit line demonstrated the relationship between these three variables. The distribution of groups demonstrates that relatively few ethnic groups have low Alignment scores, but Crossover is highly distributed. Visually, most of the highest bloc voting groups are concentrated in the middle and left side of the plot. If ethnic group distinctiveness or difference is salient for bloc voting, we would expect the loess fit line to exhibit a negative correlation, which is indeed the case, except for the far-left side, which has few observations. The plot area with the highest Group Vote Difference is then low Crossover (around 0.25) and high Alignment.
Group Voter Performance by Crossover and Alignment
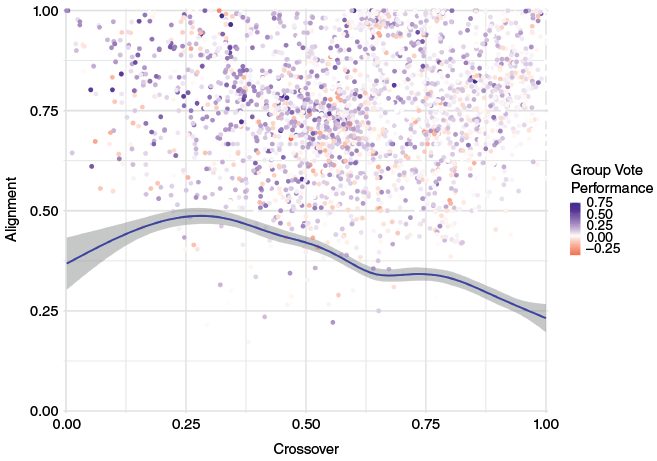
Figures 9 and 10 highlight significant variation across the dataset for the outcome variable, as well as group size and crosscutting measures. Still, extremely small- and medium-sized groups, as well as those with lower Crossover, seem to be associated with greater bloc voting.
6.2 Predictors of Party Attachment
Because of the vital roles of political parties when measuring bloc voting, a deeper understanding of how the characteristics of ethnic groups influence which party they become aligned with is useful. In line with the literature, political institutional arrangement is strongly predictive of the number of “effective” parties, which in turn should affect how ethnic group members coordinate their vote. Across the entire dataset, the vast majority of ethnic groups align with either the first or second-ranked political party. In fact, 72% of ethnic groups primarily support the country’s most popular party, 18% support the second most popular, and the remaining 10% support the third largest or smaller. Like the outcome of bloc voting, political institutions and ethnic group size should interact to inform party attachment.
To understand which social group characteristics are influential in determining which party they attach to, I run a multinomial logistic regression model, where support of the first and second-ranked parties is calculated relative to the remaining groups that support a third-ranked or smaller party. Attaching to one of the top two parties implies a strong motivation to seek power, compared to supporting a smaller, more representative party of the group’s interests, which has a lower likelihood of achieving power. Of course, which parties may be included in government differs between presidential and parliamentary systems, but attaching to a larger party suggests that members of an ethnic group are primarily concerned with being part of a winning coalition.
Two models are run, with and without a polynomial for Group Size.Footnote 28 The coefficients reported in Tables 10a–10c point to several informative connections between Group Size and party rank attachment. Unsurprisingly, the larger the ethnic group, the more likely it is to support one of the top two parties, especially the first. Interestingly, after controlling for a range of factors, the Crossover and Alignment variables are not statistically significant for determining which party, by rank, each group attaches to. On the other hand, Discrimination is found to correlate with a lower likelihood of attaching to the first party, and geographic concentration is correlated with being less likely to attach to either of the top two parties.
There are also significant country-level effects. There is no immediate difference between executive system types, with Parliamentary systems serving as the reference, and the electoral system findings for plurality are different at the legislative and executive levels. On the other hand, larger countries by land size tend to increase the likelihood of attachment to either of the top two parties. When it comes to regime, more competitive elections and higher clientelism seem to increase the likelihood of attaching to the second party compared to the third-ranked or small parties. A highly democratic electoral system is associated with a lower attachment to the largest party and an increasing likelihood of attaching to the second largest party.
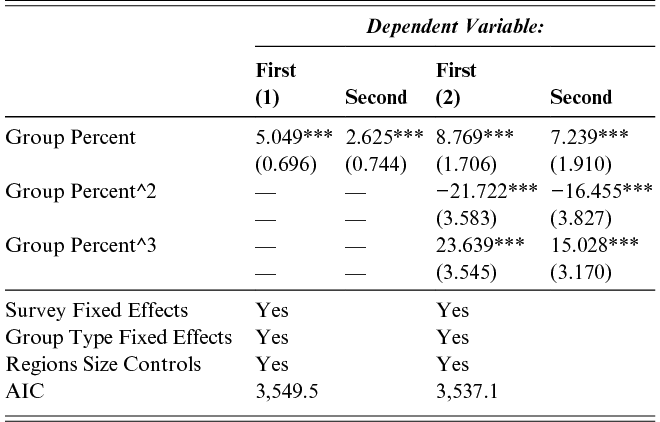
Table 10a Long description
This table shows regression coefficients for a large number of variables to show the likelihood of each identify group primarily supporting the first most popular party, second most popular, or third and small party. Because it is a multinomial regression, Third and smaller is the reference category and each model shows two columns, one for the category First, and the other category Second. There are two models, on without and one with polynomial terms for the Group Percent variable. Survey Fixed effects, Group type fixed effects and Region size controls are run for each model but no shown in the table. The AIC statistic is smaller in the second model indicated improved fit. The key predictors of party rank attachment are then graphed in Figures 11 to 14.
Note: *p < 0.1; **p < 0.05; ***p < 0.01.
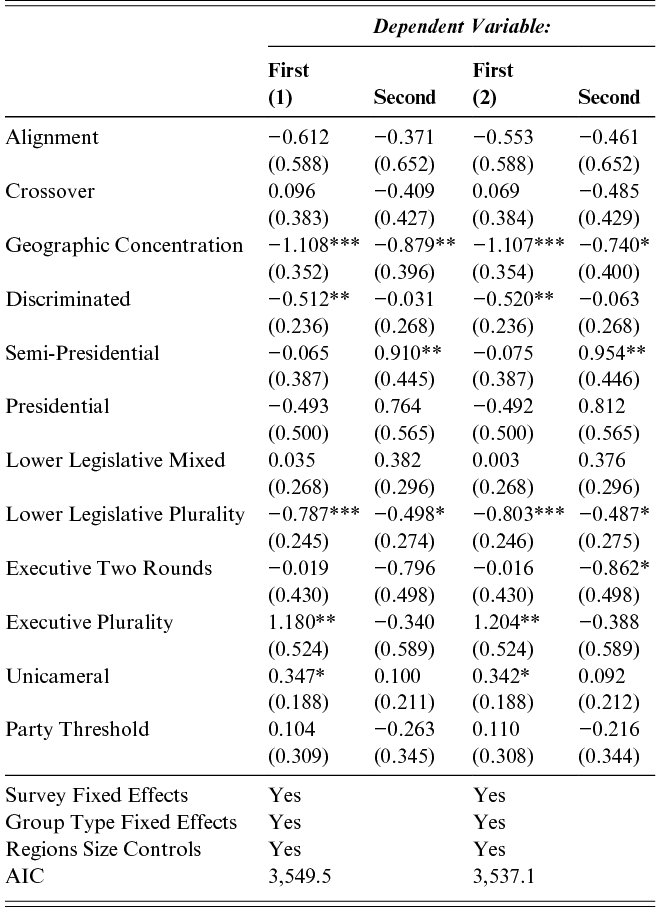
Table 10b Long description
This table shows regression coefficients for a multinomial logistic regression analysis examining how group characteristics and institutional factors influence the likelihood of an identity group primarily supporting the first most popular party, second most popular party, or a third and smaller party. Because this is a multinomial regression, Third and smaller is the reference category, and each model contains two columns representing the categories First and Second. The predictors include measures of alignment, crossover behavior, geographic concentration, discrimination, regime type, electoral system characteristics, legislative structure, and party thresholds. Two models are presented, with the second model corresponding to the specification that includes polynomial terms for Group Percent. Survey fixed effects, group type fixed effects, and region size controls are included in both models but are not shown in the table. The AIC statistic is lower in the second model, indicating a modest improvement in model fit. These results help identify which group characteristics and institutional arrangements are associated with party rank attachment.
Note: *p < 0.1; **p < 0.05; ***p < 0.01.
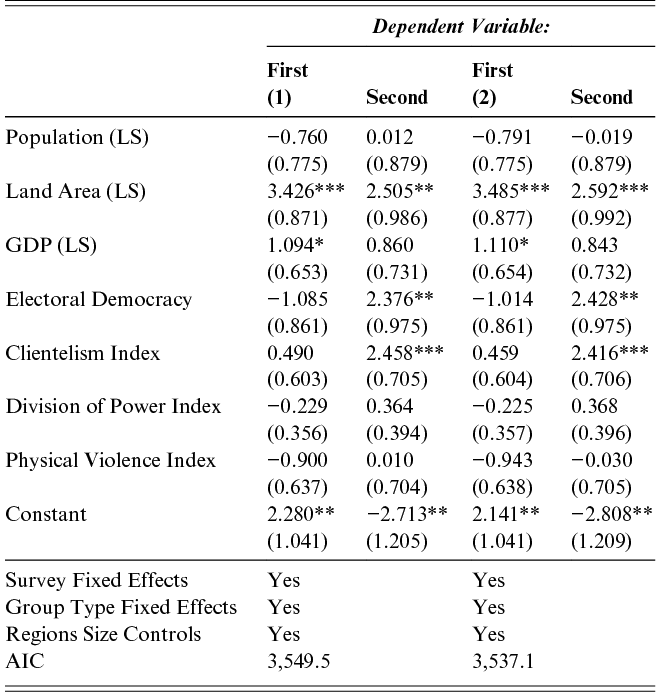
Table 10c Long description
This table shows regression coefficients for a multinomial logistic regression analysis examining how country-level characteristics influence the likelihood of an identity group primarily supporting the first most popular party, second most popular party, or a third and smaller party. Because this is a multinomial regression, Third and smaller is the reference category, and each model contains two columns representing the categories First and Second. The predictors include population size, land area, gross domestic product, electoral democracy, clientelism, division of power, and physical violence. Two models are presented, with the second model corresponding to the specification that includes polynomial terms for Group Percent. Survey fixed effects, group type fixed effects, and region size controls are included in both models but are not shown in the table. The AIC statistic is lower in the second model, indicating a modest improvement in model fit. These results assess the extent to which national-level demographic, economic, and political conditions are associated with patterns of party rank attachment.
Note: *p < 0.1; **p < 0.05; ***p < 0.01.
Since the logistic coefficients are difficult to interpret, the key relationships uncovered in Tables 10a–10c are shown as predicted probabilities in the following figures. First, Figure 11 shows the likelihood of attachment to the first largest party, second, and third or smaller across Group Size. Attachment to the largest party is the most common, starting at 70% likelihood for the smallest groups and approaching 100% likelihood as the group itself encompasses the entire population. Supporting a party that is the second most popular overall is relatively uncommon, at around 20% for the smallest ethnic groups. Though there is little difference in the likelihood between 1% and 30% group sizes, it significantly declines afterward. The smallest ethnic groups are the ones most likely to support parties that rank third or lower, as expected.
Party Rank Attachment by Group Size
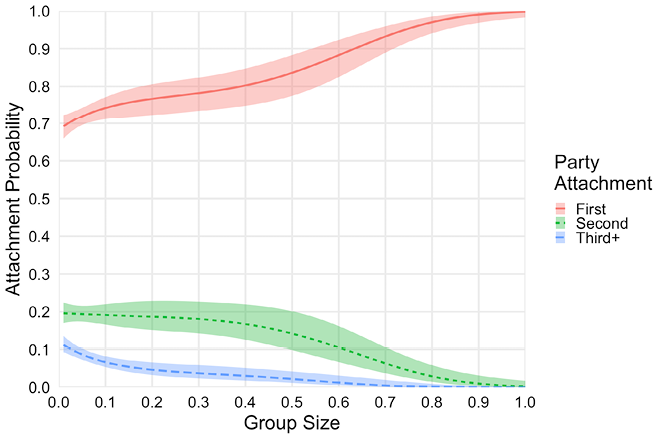
Figure 12 shows how geographic Concentration, after controlling for Group Size and other covariates, affects which party groups most strongly support. As anticipated, greater concentration is correlated with attachment to the second and smaller parties. The effects are primarily located among ethnic groups that are completely dispersed and those with moderate concentration. This moderate concentration (0.50 score), relative to minimal concentration, reduces the likelihood of attaching to the largest party from 86% to 71%, while the likelihood of attaching to all other parties increases. Thus, moderately to highly dispersed groups tend to support the most popular party more than those that are more concentrated.
Party Rank Attachment by Concentration
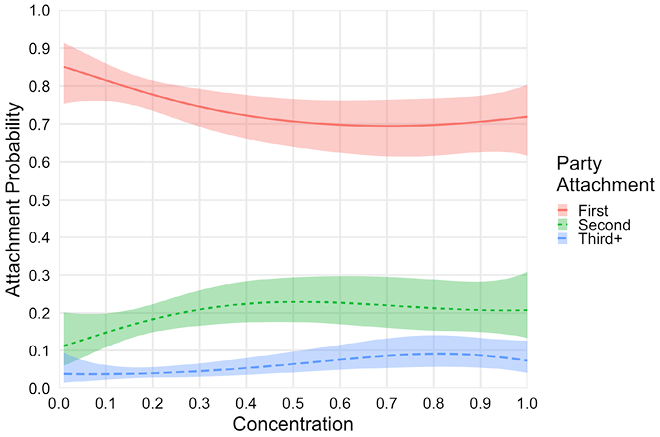
One of the more dramatic effects that informs which party groups attach to, however, is the quality of elections. The predicted probabilities of attachment are presented in Figure 13. Holding high-quality elections significantly increases the likelihood of ethnic groups choosing not to support the most popular party in their country, which is often the party in power. The analysis confirms that among more autocratic countries, it is rare for any ethnic group not to primarily support the most popular party. Figure 13 shows that the likelihood of attaching to the second-largest party increases from around 3% among the most autocratic countries to around 43% in the most democratic countries. These findings emphasize the importance of electoral competition.
Party Rank Attachment by Electoral Democracy
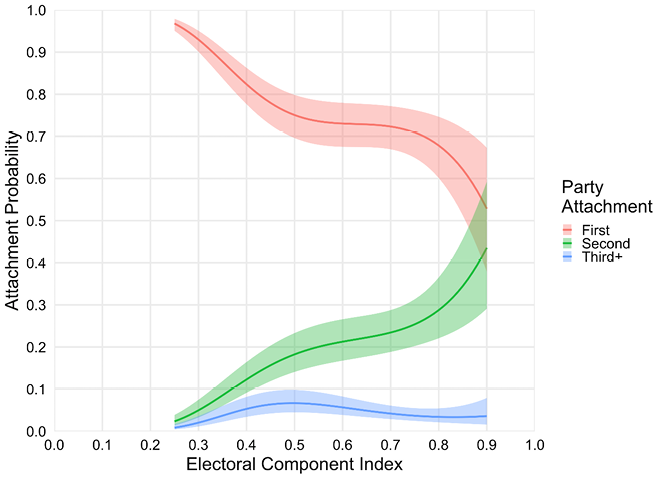
Finally, in addition to these base models from Table 7, I also investigate whether political institutions influence which political party ethnic groups support through an interaction with Group Size. According to the coalition theory reasoning, medium-sized groups are especially motivated to contest elections and engage in bloc voting in restrictive systems and should be much more likely to attach to one of the two largest parties, in line with Duverger’s theory. While both the Executive Electoral System and the Legislative Electoral System variables do not produce very robust effects, Executive System does.Footnote 29 Figure 14 plots the predicted attachment likelihoods when Group Size is interacted with Executive System. As expected, semi-presidentialism and especially presidentialism greatly incentivized medium-sized groups to align with the second-largest party.
Party Rank Attachment by Executive System
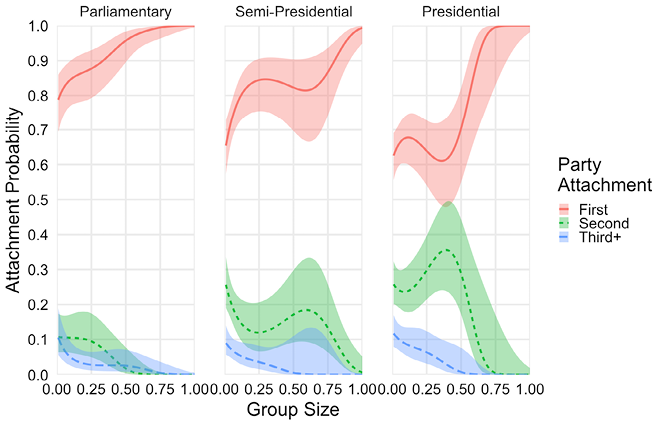
Figure 14 Long description
This figure includes three sub-figures showing the likelihood of party attachment across group size, calculated separately for Parliamentary, Semi-Presidential, and Presidential executive systems. In Parliamentary systems, first party attachment is very high and increases steadily with group size. In Presidential systems, both first and second party attachments are high, with second party attachment peaking at about 40% group size, after which first party attachment is very high. Semi-Presidential systems represent a blend of these two trends.
The differences are especially dramatic for groups comprising between 25% and 50% of the population. For example, an ethnic group that is 40% of the population has a 37% likelihood of supporting the second largest party in a Presidential system, a 14% likelihood in a Semi-Presidential system, and a 5% likelihood in a Parliamentary system. For majority ethnic groups, the likelihood of supporting the most popular party quickly approaches one for Parliamentary systems and eventually reaches the same as in semi-presidential and presidential systems. Supporting a third or small party is low overall, but the most likely among the smallest ethnic groups. Thus, the most significant difference is how likely smaller-sized, and especially medium-sized ethnic groups, are to support the second most popular parties in presidential compared to parliamentary systems.
6.3 Predictors of Bloc Voting
With a basic grasp of how group characteristics, particularly group size, correlate with Group Vote, as well as the important influence of executive system type and level of democracy over which party groups attach to the analysis turns to a more rigorous assessment of the predictors of bloc voting. The main outcome of interest – Group Vote –is the proportion of votes (or support) for the most popular party among ethnic group members.Footnote 30
Testing is conducted using multi-level linear regression with country-level random effects across model specifications. Also not shown but included in the models are fixed effects for the survey series, the ethnic dimension, and the number of regions by country. Tables 11a and 11b presents the coefficients from four models that increase in sophistication. In model 1, only Group Size and the basic party and fixed effects controls are shown, with a robust negative correlation between Group Vote and Group Size. Model 2 includes a quadratic, but this is not found to be significant. Next, model 3 includes all of the country-level and institutional variables, and the Group Size coefficient is largely the same as in model 1. In model 4, all the group characteristic variables are introduced. Here, the effect size of Group Size decreases to just 0.026. The predicted rates of Group Vote are shown in Figure 15 based on models 3 and 4. Both show the smallest groups as having a predicted Group Vote at about 0.38. When full controls are included, however, this effect declines to only about 0.35 when moving toward the largest size.
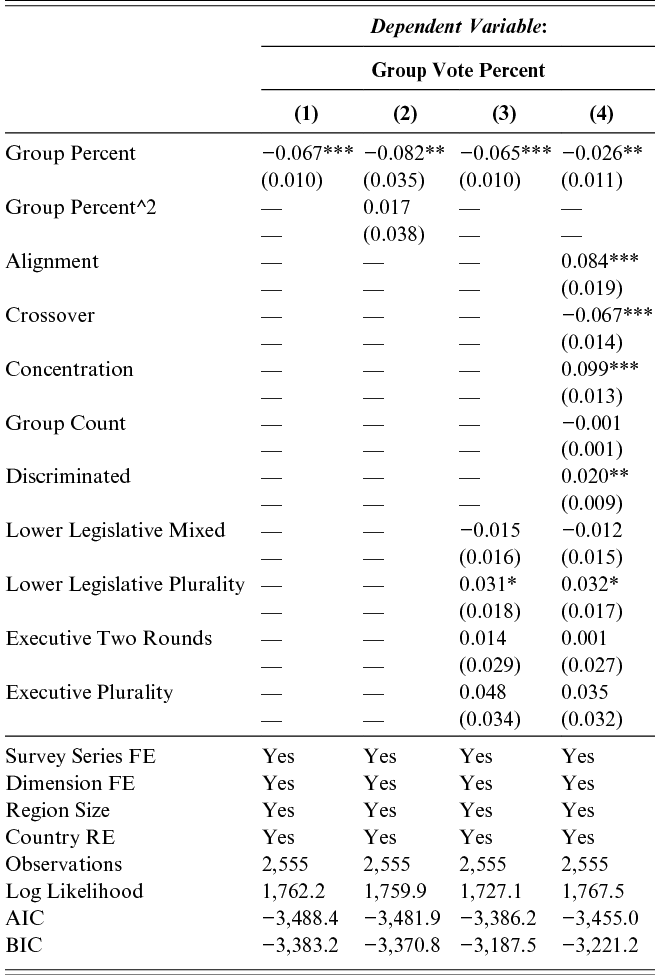
Table 11a Long description
This table shows regression coefficient using a linear model where dependent variable is Group Vote Percent. Four columns are shown as variables are introduced in a step-by-step manner, until all are included in model four. All columns show that Group Percent is negatively and statistically significantly correlated with Group Vote Percent, though the size of the effect is much smaller after the other group characteristics are introduced. The results from model four show a positive relationship between Alignment, Concentration, and Discrimination to Group Vote Percent, and a negative relationship between Crossover and the outcome of interest. All model include extensive control including party popularity and ranking, survey series fixed effects, group dimension fixed effects, region size, and country random effects, in addition to the country-level controls.
Note: *p < 0.1; **p < 0.05; ***p < 0.01.
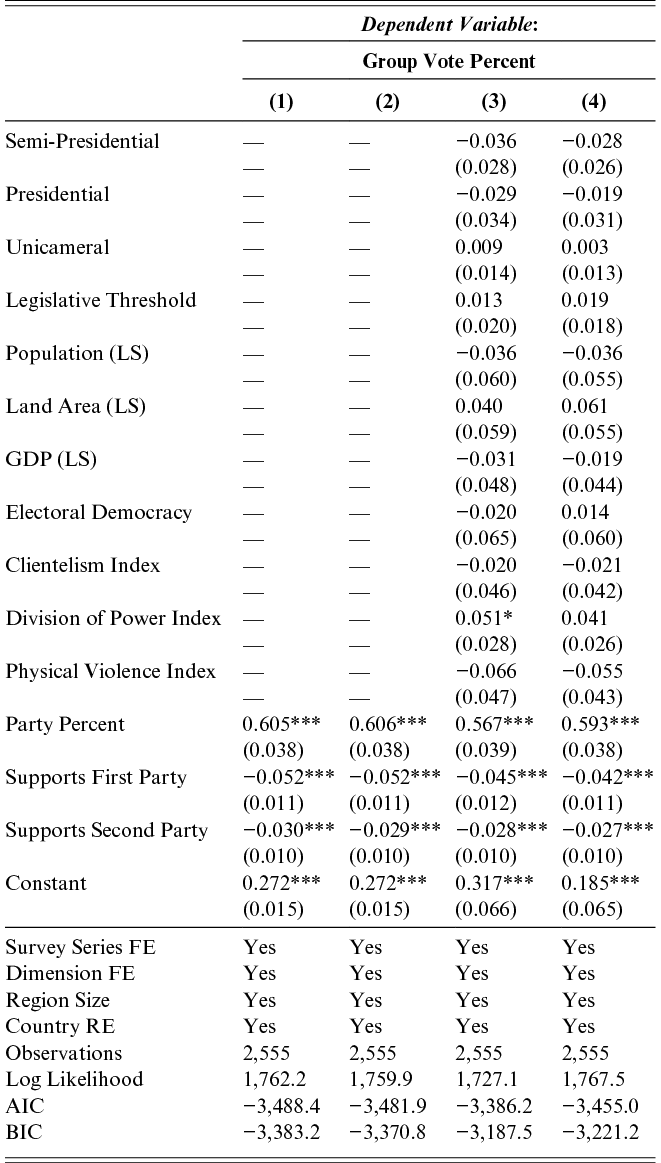
Table 11b Long description
This table shows regression coefficients from four regression models with Group Vote Percent as the dependent variable. The models examine how institutional arrangements, country-level characteristics, and party-related factors are associated with the share of votes received by a group. The institutional and country-level variables include regime type, legislative structure, party thresholds, population, land area, gross domestic product, electoral democracy, clientelism, division of power, and physical violence. The models also include party-related measures such as Party Percent and indicators for supporting the first or second party. Models 3 and 4 incorporate the institutional and country-level predictors, while all models include party-related variables. Survey series fixed effects, dimension fixed effects, region size controls, and country random effects are included in every model but are not shown in detail. The table also reports observations, log likelihood, AIC, and BIC statistics for each model. Comparison of these fit statistics allows assessment of whether the inclusion of institutional and country-level factors improves model performance in explaining variation in group vote percentage.
Note: *p < 0.1; **p < 0.05; ***p < 0.01.
Predicted Group Vote by Group Size
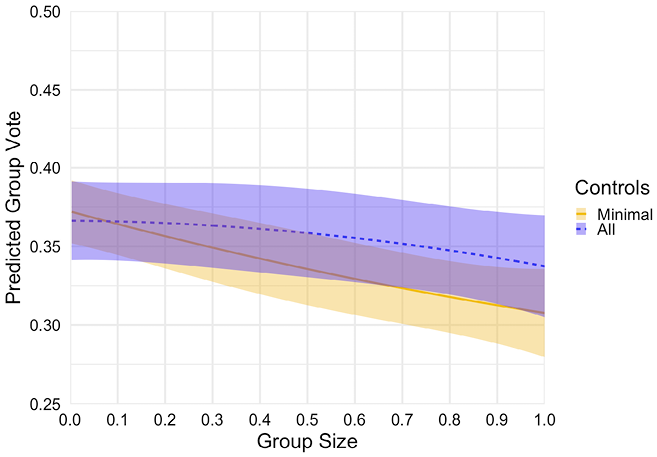
Model 4 demonstrates that four out of the five other group characteristic variables are statistically significant, three with pronounced effects. The model indicates, on average, that small and discriminated against groups indeed have higher rates of bloc voting. The more dramatic effects, however, are related to crosscutting and geographic concentration. All three of these variables spotlight the role of distinctiveness. Ethnic groups with higher Alignment (within-group similarity), lower Crossover (across-group similarity), and greater concentration are much more likely to coalesce their votes.
Models 3 and 4 also gauge the importance of the country-level variables. In fact, none are statistically significant at the p < 0.05 level. Legislative elections with plurality rules, does have a positive effect on Group Vote, but only at the p < 0.1 level. Similarly, the Division of Power index, representing power decentralization, is significantly at the p < 0.1 level in model 3. Part of this is due to the less variation at the country level compared to the ethnic group level. This does not mean, however, that political institutions do not affect bloc voting since these models do not explore interactions between the institutions and group characteristics, which is the objective of Section 7.
6.4 Summary of Findings
This section tests the predictors of two important aspects of how ethnic group members coordinate their political support. First, the likelihood of attaching to the first, second, or third and smaller ranked parties is modeled. As expected, small groups and those geographically concentrated are more likely to support less popular parties. There are also three important country-level predictors related to supporting different ranked parties: electoral quality (second-ranked party more likely), clientelism (top two parties more likely), and land size (top two parties more likely). Political institutions have weak effects until Group Size is interacted with the Executive System. In presidential systems, medium-sized ethnic groups are much more likely to support the second-largest party compared to other systems, in line with Duverger’s theory.
Next, the predictors of bloc voting are tested. In general, smaller ethnic groups have higher rates of bloc voting. Once the full controls are included, the effect of group size is reduced, and instead other group characteristics are found to be more prominent – geographic concentration, high within-group alignment, and low crossover, all indicators of distinctiveness through different measures. While the political institutional variables have relatively weak effects in the models examined, we should expect more pronounced effects to emerge when interacted with group characteristics, especially group size. Thus, judgment about the competing theories in Section 3 must wait until these relationships are examined.
7 Interactions with Institutions
Section 6 provided a foundation for understanding the basic correlates of bloc voting. In this section, the interactions between group characteristics and political institutions are probed. Special attention is given to how small- versus medium-sized groups interact with permissive and restrictive institutions. Next, the two crosscutting measures are interacted with institutional variables. Finally, all three components are brought together by examining each institutional arrangement one at a time and interacting size with the crosscutting measures. For the sake of brevity, the regression tables for these models have been moved to the appendix.
7.1 Group Size across Institutions
Does group size affect bloc voting differently across institutions? An extensive literature suggests that it does. The coalition theory specifically elevates the role of medium-sized groups within restrictive institutions – presidential systems with plurality elections. Smaller groups should exhibit high bloc voting under permissive conditions, where the rules of accessing power and the possibility of representation are more likely for them.
To test these propositions, the same general model of bloc voting (found in Table 8, model 4) is repeated for each of the three key institutional features. Since I anticipate that the effect might be different for small, medium, and larger groups, each institutional variable is interacted with Group Size and its quadratic. The first institutional variable to assess is the executive system, where countries are sorted into presidential, semi-presidential, and parliamentary types. The results of the model predictions are shown in Figure 16. Recall that without interactions, Group Size has a small negative relationship to Group Vote.
Predicted Group Vote by Group Size and Executive System
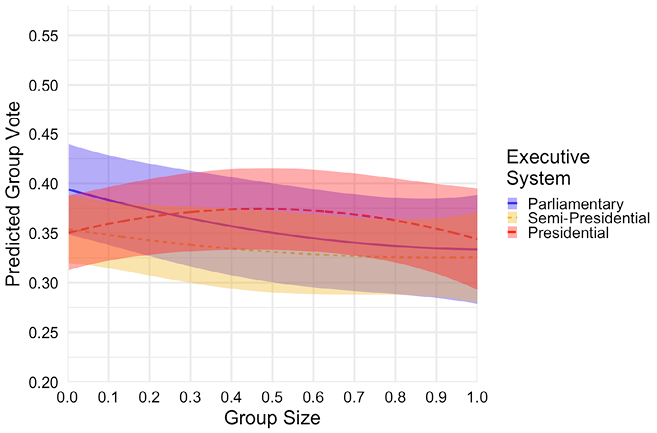
The interactive effects between the executive system and Group Size are more suggestive than determinant. There are few areas where the confidence intervals for the three executive types do not overlap. Still, in line with the Coalition theory, the smallest groups have the greatest bloc voting rates, about 0.39 in parliamentary systems, the most permissive. Also noteworthy is the curvilinear arch demonstrated by groups in presidential systems, with the highest bloc voting rates falling close to 50% Group Size, though again, the effects are modest in size.
Figure 17 shows the predicted plots for each of the three legislative house electoral systems. Similar to executive systems, the trend line of plurality elections is curvilinear, with groups around 30% experiencing the highest Group Vote scores. Also, plurality elections seem to generate the greatest bloc voting across most of the Group Sizes, but especially those that are medium sized. For example, the difference between plurality and proportional electoral systems among the smallest groups of around 1% of the population is +0.02, but closer to +0.06 at 50% Group Size.
Predicted Group Vote by Group Size and Lower House Electoral System
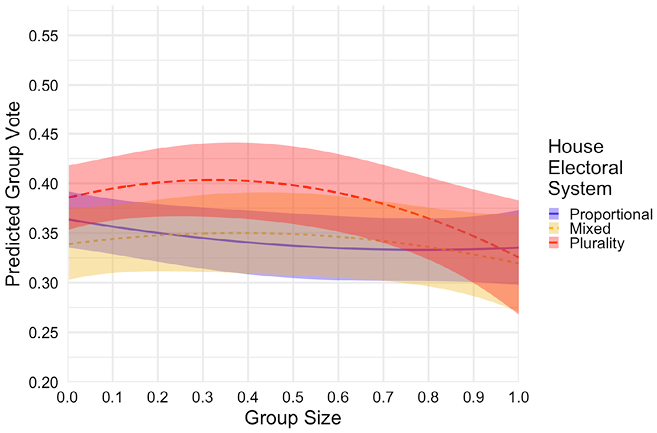
Finally, Figure 18 plots the predicted effects of the three executive electoral system categories across Group Size. Due to the large confidence intervals, there are no statistically significant effects across these institutional systems. Since indirect elections largely represent parliamentary systems, there is limited variance between the two variables. Overall, first-past-the-post or plurality elections, which represent the most restrictive, are associated with the highest rates of bloc voting. Similar to the executive system and legislative election findings, when moving from smaller- to medium-sized groups, groups in restrictive institutions do not decline like those in permissive institutional counterparts.
Predicted Group Vote by Group Size and Executive Electoral System
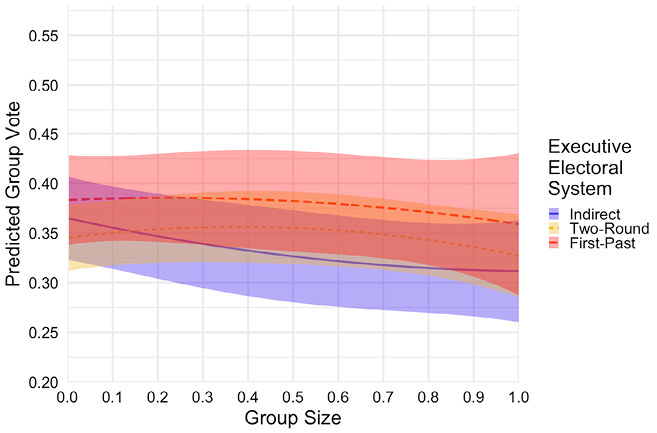
What do these findings tell us about the relationship between Group Size and political institutions? Each figure shows relatively modest, if any, differences across Group Size and the different institutional categories, but there are some important trends to note: (1) In all three cases the most restrictive institution does not demonstrated a negative-linear decline, and in two cases, increases when moving between small- and medium-sized groups, (2) for medium- and large-sized groups, restrictive institutions are associated with the higher bloc voting rates, and (3) permissive institutions largely exhibit negative linear relationships to bloc voting, especially parliamentary systems where very small groups experience the higher overall expected rates of bloc voting.
7.2 Crosscutting and Concentration Across Institutions
Next, this section scrutinizes the interactions between Alignment, Crossover, and Concentration across political institutions. Not shown here are predicted effects from models for Discrimination. There are no interactive effects between Discrimination and legislative election systems, but there is an effect between Discrimination and executive systems – groups that are discriminated against have a higher Group Vote of about 0.04 in parliamentary systems compared to presidential. Also not shown are the results for executive elections, which have been moved to the appendix. In general, the effects are not robust and have larger confidence intervals.
First, Figures 19 and 20 examine how Alignment interacts with political institutions. Recall that the baseline finding from Section 6 is that as Alignment moves from 0 to 1, it is associated with an increase in Group Vote of about 0.08.Footnote 31 The left side of these graphs should be interpreted cautiously because there are few groups with Alignment scores less than 0.5, hence the large confidence intervals. In Figure 19, there are almost no points at which a prediction line differs from the others, though, in general, parliamentary systems have the highest Group Vote scores among groups with lower Alignment. In Figure 20, both plurality and proportional prediction lines show steady increases across Alignment scores. The only area in which the lines show statistical separation is among countries with plurality legislative house elections relative to mixed and proportional, among groups with very high Alignment. In general, however, the relationship between Alignment and these intuitional arrangements is positive. In sum, for groups with the highest Alignment scores, the highest rates of Group Vote are expected to be found among countries with plurality legislative election rules in either presidential or parliamentary executive systems.
Predicted Group Vote by Alignment and Executive System
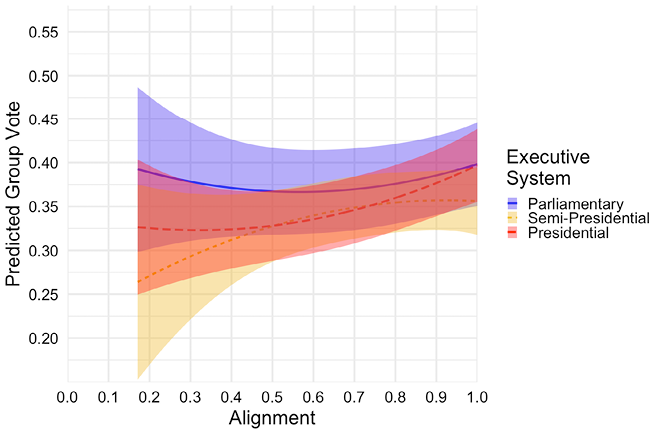
Predicted Group Vote by Alignment and Lower House Electoral System
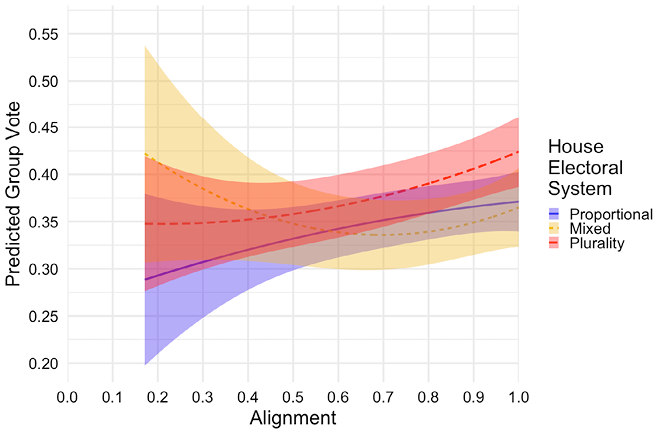
Next, Figures 21 and 22 present findings on the relationship between Crossover and institutions. The second crosscutting variable measures how similar an ethnic group is to the non-group population across the other identity dimensions. Compared to the other institutional interactions thus far, the role of Crossover is striking. A dramatic effect is revealed among ethnic groups with low Crossover, primarily within permissive institutions – parliamentary executive systems and proportional elections. Figure 21 shows that among ethnic groups with a Crossover greater than 0.5, there is little difference in bloc voting across executive systems; however, among groups with very low Crossover scores, meaning they are highly distinctive compared to the broader population across all identity dimensions, the expected Group Vote for parliamentary systems is 0.48, for semi-presidential is 0.39, and for presidential is 0.35. The same gaping difference, about 0.12 points, is also observed for low Crossover groups when interacting with legislative election rules, when comparing proportional and plurality rules. Mixed systems generate the lowest bloc voting scores. Also of note are the different curve shapes for proportional versus plurality and mixed systems.
Predicted Group Vote by Crossover and Executive System
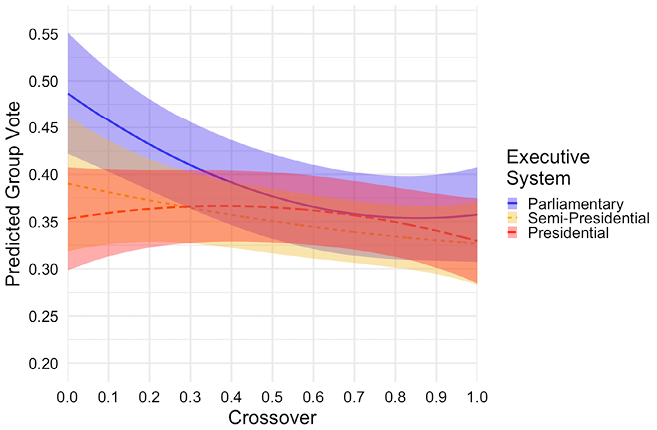
Predicted Group Vote by Crossover and Lower House Electoral System
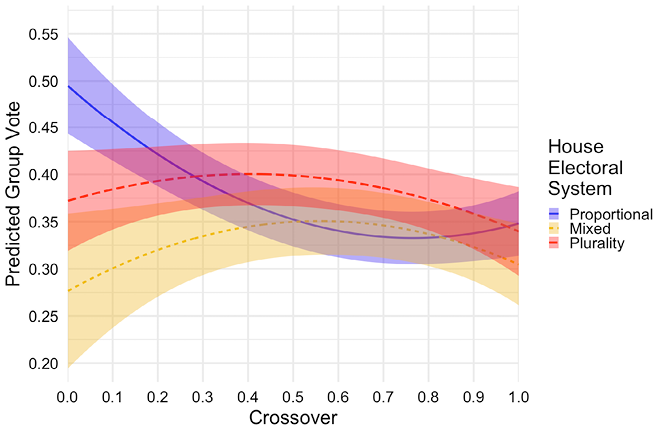
Finally, the geographic Concentration measure is modeled across political institutions in Figures 23 and 24. The baseline finding demonstrates that as Concentration increases from 0 (most dispersed) to 1 (totally concentrated within a single region), Group Vote is expected to increase by about 0.10. Figure 23 plots the predicted effects by executive system. In general, all line trajectories are positive, but there is a more meaningful difference between the intuitions once Concentration reaches above 0.5. Among groups with high Concentration, those in parliamentary systems demonstrate a statistically significantly higher rate of Group Vote compared to the semi-presidential and presidential systems. Figure 24 shows some similar trends related to legislative house elections – above 0.5, all are increasing in a positive direction, and the most permissive setting – proportional rules – is largely positive and linear. Interestingly, plurality rules generate the highest bloc voting among groups that are both highly dispersed and highly concentrated, but not in the middle.
Predicted Group Vote by Concentration and Executive System
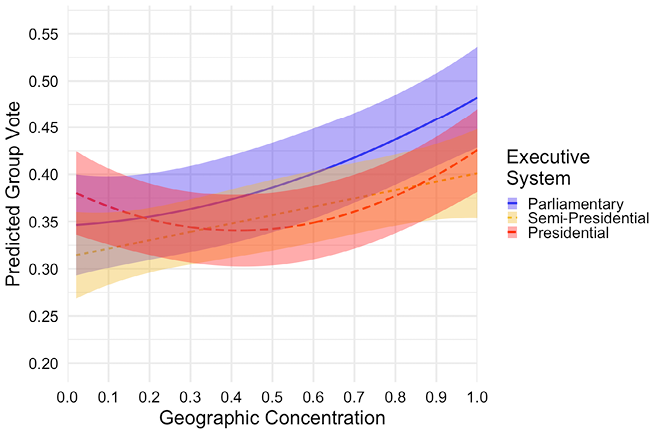
Predicted Group Vote by Concentration and Lower House Electoral System
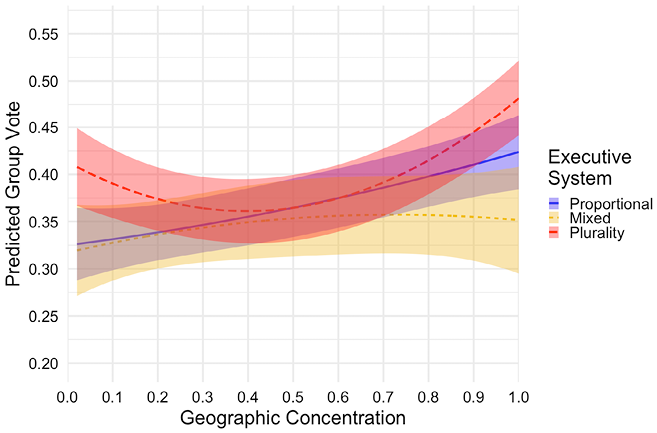
These three sets of findings point to complex results but highlight some general trends. For the Alignment measure, there are no dynamic interactions with either set of institutions. In general, groups with high Alignment scores generate the highest rates of bloc voting in either parliamentary or presidential systems paired with plurality election rules. More dramatic differences are observed when interacting Crossover and political institutions. Groups with low Crossover, which are highly distinctive, generated very high expected Group Vote scores only within the permissive institutions of parliamentary executive and proportional rules, and the differences diminish as Crossover increases. When it comes to Concentration, again, there is a robust positive relationship to Group Vote generally, and an interacting curvilinear relationship between Concentration and restrictive institutions, where either very high or very low Concentration is associated with higher bloc voting, while the permissive institutions facilitate a more stable positive relationship. Ethnic groups that are the most highly Concentrated experience the highest average Group Vote scores under parliamentary systems with plurality elections.
7.3 Group Size, Crosscutting, and Institutional Interactions
Thus far, the analysis has examined how each of the important group characteristics interacts with political institutions. When reviewing the main theories presented in Section 3, several point out that both the size and crosscutting nature of groups should impact the coordination efforts of their members. This section gauges the interaction between size and crosscutting to see if there is a third layer of interaction across political institutions. Instead of including a triple interaction term, Crosscutting and Group Size are interacted for subsets of the sample based on a specific institution. For the sake of simplicity, Alignment (inverse) and Crossover are combined into a single Crosscutting measure.Footnote 32 Crosscutting prediction lines are estimated at High (95th percentile), Medium (50th percentile), and Low (5th percentile) values. Each of the nine institutional categories is examined and plotted across different levels of Crosscutting and Group Size, but only four are shown here. The other plots can be found in the appendix.
When it comes to executive systems, there is a robust relationship found within presidential systems. As a restrictive institution, scholars suggest that medium-sized groups in presidential systems experience especially high incentives to vote together in a winner-takes-all environment. Figure 25 affirms this expectation by highlighting the large differences in expected Group Vote at around 45% of the population: for High Crosscutting (0.30), Medium (0.38), and Low (0.48). Thus, the restrictiveness of presidential systems requires one to take into account Crosscutting when examining bloc voting for medium-sized groups. When Parliamentary systems are examined in Figure 26, the trends are starkly different – linear and negative lines with smaller differences across Crosscutting levels. Notably, however, the largest differences present at the smallest group sizes. Among the smallest groups of around 1%, moving from High to Low Crosscutting is associated with an expected increase in Group Vote of about 0.07.
Predicted Group Vote in Presidential Systems by Group Size and Crosscutting
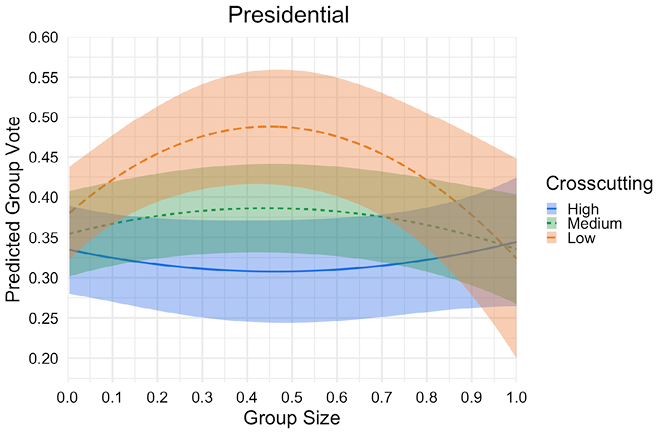
Predicted Group Vote in Parliamentary Systems by Group Size and Crosscutting
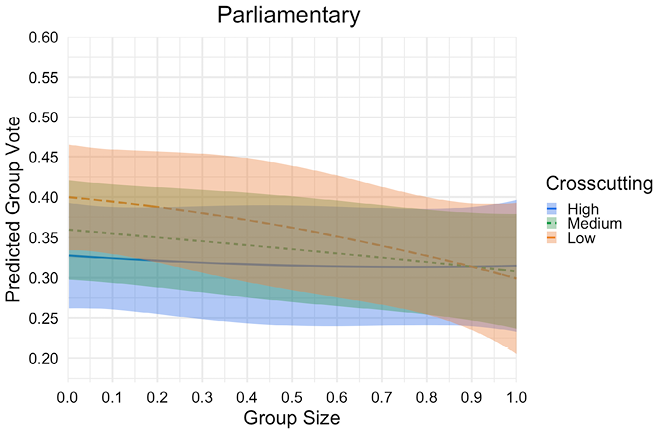
Figure 27 highlights essentially the same pattern as Figure 25 among countries with plurality legislative elections. Groups at 45% of the population demonstrate the highest bloc voting rates, but only after Crosscutting is accounted for. Among high Crosscutting groups, the size of the group has a slight, negative relationship to bloc voting, but at the 45% mark, a group with low Crosscutting is expected to generate a Group Vote of 0.50 compared to 0.36 among High Crosscutting groups.
Predicted Group Vote in Plurality Legislative Systems by Group Size and Crosscutting
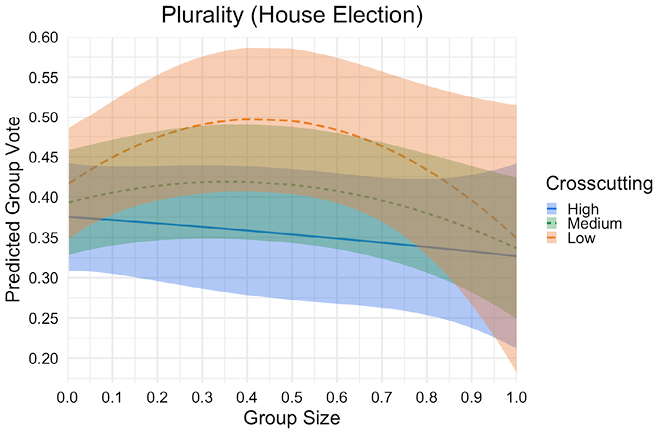
The more permissive legislative house rule of proportionality mirrors the trends of parliamentary systems, but with even more robust findings. Again, it is lower Crosscutting that generates the highest Group Vote score; however, because this is a permissive institution, it is the smallest groups that experience the highest scores. Among the smallest groups, those with low Crosscutting are expected, on average, to have a Group Vote score of 0.40 compared to a group of the same size with high Crosscutting at 0.27. The difference between Crosscutting levels then diminishes as Group Size increases (Figure 28).
Predicted Group Vote in Proportional Legislative Systems by Group Size and Crosscutting
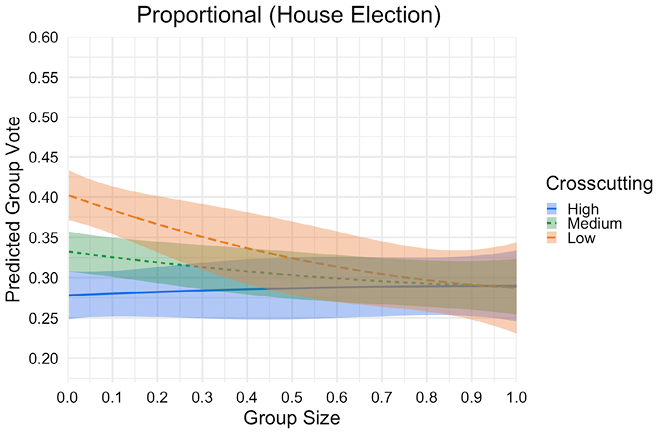
7.4 Summary of Findings
These findings paint an intriguing and complex picture of the determinants of Group Vote. While parliamentary systems with plurality electoral systems have the highest average rates of bloc voting, a handful of interactive tests demonstrate more dynamic effects. When it comes to the executive system, very small-sized groups in parliamentary systems have the highest expected rates of bloc voting. Both Alignment (within group similarity) and geographic Concentration are positively associated with bloc voting across executive institutions, though especially in parliamentary systems. Groups with very low Crossover, however, have much higher rates of bloc voting in parliamentary systems relative to presidential systems. There is an additional finding within presidential systems that only emerges when Crosscutting and Group Size interact. Across executive systems, medium-sized groups (40–50%) with low Crosscutting (higher distinction) have the highest expected bloc voting rates. The results for parliamentary systems are weaker, but point to low Crosscutting in smaller groups as generating high Group Vote.
The section also examines the role of the legislative house electoral rules, which generate many similar conclusions. In general, plurality elections incentivize bloc voting more than other rules, especially for medium-sized groups. Alignment generally contributes to greater bloc voting within plurality and proportional rules (but not mixed), and concentration is, overall, associated with stronger bloc voting across all electoral systems. Similar to executive systems, however, there are more dramatic differences for Crossover. Furthermore, the interaction between Crosscutting and Group Size generates stunning differences – very high bloc voting for medium-sized groups with low Crosscutting in plurality systems, and high bloc voting for the smallest groups with low Crosscutting in proportional systems. Groups with high Crosscutting are not generally affected by the interaction of Group Size and institutions.
8 Conclusion
The first part of this Element focused on the theoretical expectations for situations in which ethnic group members should be the most likely to become politically salient and engage in bloc voting. Section 2 discussed the scholarly landscape around social identity, ethnicity, and how these relate to political parties and institutions. Section 3 laid out four theories across a range of disciplines that examine what encourages coordination among group members. Some tenets of these theories are complementary, others contradictory. In this conclusion, the four theoretical perspectives and their expectations are reviewed in light of bloc voting outcomes for ethnic groups. Table 12 reviews these perspectives and assesses the supporting evidence for each theory.
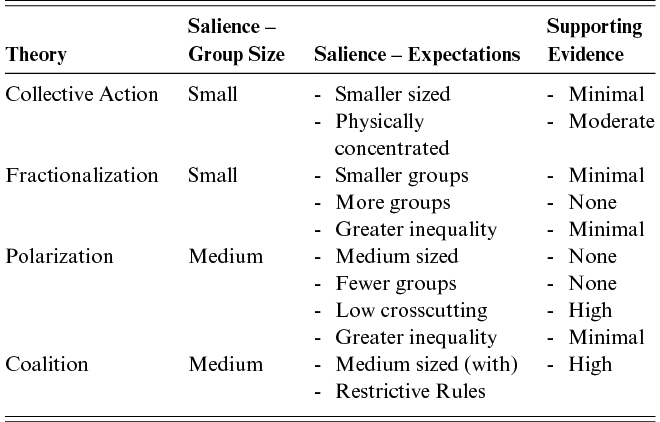
Table 12 Long description
Data mentioned are as follows. The table is titled “Review Expectations by Theory.” The columns are labeled Theory, Salience – Group Size, Salience – Expectations, and Supporting Evidence.
Collective Action. Salience group size is small. Salience expectations include smaller-sized groups and physically concentrated groups. Supporting evidence is minimal for smaller-sized groups and moderate for physically concentrated groups.
Fractionalization. Salience group size is small. Salience expectations include smaller groups, more groups, and greater inequality. Supporting evidence is minimal for smaller groups, none for more groups, and minimal for greater inequality.
Polarization. Salience group size is medium. Salience expectations include medium-sized groups, fewer groups, low crosscutting, and greater inequality. Supporting evidence is none for medium-sized groups, none for fewer groups, high for low crosscutting, and minimal for greater inequality.
Coalition. Salience group size is medium. Salience expectations include medium-sized groups with restrictive rules. Supporting evidence is high.
First, the Collective Action theory anticipated that the smallest ethnic groups with the highest amount of interaction, proxied by physical concentration, would be the most likely to experience strong coordination. To evaluate, the Group Size and Concentration measures were modeled for their effects on bloc voting. The findings show that after all controls are included, the raw effect of group size is statistically significant but quite small at around −0.03. The effect of concentration is much more robust at +0.10. This suggests that the incentives around group voting are less about the magnitude in size of groups and more about the greater physical concentration of members that undoubtedly results in increased contact and stronger social networks. Overall, the Collective Action expectations are met, though the effects are moderate, suggesting a partial confirmation.
Fractionalization scores consider both the number of competition groups as well as their size to capture the diversity of an environment. Fractionalization scores at the country level correlate with the likelihood of ethnic conflict and lower economic growth. Group coordination is driven by competition for resources among many groups, and the likelihood of inequality is expected to increase the salience of members to coordinate with one another. When it comes to the outcome of bloc voting, however, the key measurement features of fractionalization – more competing groups that are smaller in size – are not borne out. There is no effect regarding the number of competition groups, and only a small negative correlation for Group Size. There is a small positive effect for groups that are discriminated against. Overall, however, the fractionalization expectations for strong group coordination are not very persuasive for determining patterns of block voting across ethnic groups, and the evidence provides weak confirmation for these tenets.
The Polarization theory posits that the situation of having two (or a few) equally sized ethnic groups results in the greatest amount of tension and salience, which should increase coordination and bloc voting. There are several measures associated with this theory: medium-sized groups, fewer groups, greater differences between groups (measured here as low Crosscutting), and the threat of inequality or discrimination. Like fractionalization theory, the most well-known tests of these indices have been applied to study violence and economic growth. While several infamous examples from the historical record do include two or three ethnic identity groups with severe divisions, the generalized findings do not suggest that a lower number of groups and/or medium-sized groups directly results in greater bloc voting in a straightforward way. On the other hand, the issue of difference, as measured through Crosscutting, is the most powerful predictor of bloc voting. The combined effects of moving from highest to lowest Crosscutting, on average, is an increase of 0.15 in expected Group Vote, a significant increase. Like the fractionalization theory, the actual number and size of groups is much less important information, compared to crosscutting, and on the whole, this suggests a partial confirmation for the polarization theory.
Finally, out of the four theories, it is the Coalition hypothesis that is both most specifically built to study bloc voting and that garnered the most support through this analysis. The Coalition hypothesis draws out an expected interaction between size and institutions – higher coordination and bloc voting among medium-sized groups in restrictive systems, as well as smaller-sized groups in permissive settings. Indeed, across several group characteristics, small- and medium-sized groups present differing trends across institutional arrangements. After controlling for all other variables, smaller social groups have lower bloc voting rates in presidential compared to parliamentary systems. Medium-sized groups have marginally higher rates of bloc voting than smaller groups in plurality elections (+0.02) and presidential systems (+0.03), while in permissive arrangements, rates of bloc voting fall in parliamentary systems (−0.04) and proportional election rules (−0.02).
If these were the only findings related to group size and institutions, the result would be meaningful but limited in its impact. However, when distinctiveness is introduced into the relationships between institutions and group size, the results become much clearer: medium-size groups in restrictive systems outperform all other groups, but only when crosscutting is taken into account, specifically, when these groups are also quite distinct from the boarder population. Overall, evidence tends to provide strong confirmation for the expectations laid out in the Coalition theory, after this important caveat is taken into consideration.
The lesson learned from this analysis draws attention away from the raw number and size of ethnic groups, and toward correlates of their size, the most critical of which is crosscutting. This study thus validates previous work by scholars such as Selway (Reference Selway2011b) and Houle (Reference Houle2019) who, using similar methodologies, report crosscutting measures as central to the analysis of social groups’ behavior in politics. This Element also further underscores the dynamic interactions with political institutions, especially restrictive systems, in incentivizing some groups toward block voting and discouraging others based on their characteristics.
These findings represent but one attempt at untangling the complex and shifting relationships between ethnic identities and political institutions. The methodological choices made in this analysis should be scrutinized, debated, and improved upon. By taking a generalizable approach, the analysis has sought to include as many countries as possible, but this has required sacrificing nuance at several junctures. This analysis focuses solely on ethnic identities while leaving aside numerous other important identities that surely influence vote choice and would lead to a more detailed capturing of crosscutting patterns. Further debates over how to best capture concepts like bloc voting or crosscutting are also needed to advance knowledge on this topic. Overall, however, this Element emphasizes the importance of taking into account group size, crosscutting patterns, and political institutions in concert when seeking to analyze and understand how social identities relate to vote choice.
Raymond Duch
University of Oxford
Raymond Duch is the co-founder and Director of the Centre for Experimental Social Sciences (CESS) at Nuffield College University of Oxford. He established and directed similar CESS centers in Chile, China, and India. He is also co-Director of the Candour Project that assembles a global team of research scholars with expertise in behavioral economics and data analytics addressing challenging health policy issues.
Anja Neundorf
University of Glasgow
Anja Neundorf is a Professor of Politics and Research Methods at the School of Social and Political Sciences at the University of Glasgow, UK. Before joining Glasgow, she held positions at the University of Nottingham (2013–2019) and Nuffield College, University of Oxford (2010–2012). She received her PhD from the University of Essex.
Randy Stevenson
Rice University
Randolph Stevenson is the Radoslav Tsanoff Professor of Public Affairs at Rice University in Houston, Texas. Professor Stevenson works and teaches in the areas of survey design, applied statistical methods, comparative mass political behavior, comparative political psychology, and experimental design.
About the Series
This Elements series is aimed at students and researchers interested in understanding how and why the political behaviour, perceptions, attitudes, emotional responses, interest, knowledge, and identities of citizens are conditioned on the political, social, and economic contexts in which they experience the political world.