

Accounts of sexual harassment have been present in the field of archaeology for a long time, both anecdotally and in print (e.g., Browman Reference Browman2013; Lister Reference Lister1997; White et al. Reference White, Sullivan and Marrinan1999). Indeed, publications in the past have gone so far as to espouse banning women from the field (Nöel Hume Reference Nöel Hume1969). Until recently, however, no data have been gathered on the presence and frequency of sexual harassment, primarily of women, specifically in archaeology. A notable exception is the Survey of Academic Field Experiences (SAFE; Clancy et al. Reference Clancy, Nelson, Rutherford and Hinde2014), which surveyed field scientists including archaeologists about the rate of sexual harassment encountered in field settings. Other researchers (e.g., Bardolph Reference Bardolph2014; Bardolph and VanDerwarker Reference Bardolph and VanDerwarker2016; Claassen et al. Reference Claassen, O'Neal, Wilson, Arnold and Lansdell1999) have examined differences in presentation and publication rates by gender among archaeologists and Southeastern archaeologists specifically.
In 2014, the Southeastern Archaeological Conference Sexual Harassment Survey (SEAC SHS) was undertaken with two goals in mind: (1) to identify the rate and frequency of sexual harassment in Southeastern archaeology, and (2) to identify any effects of sexual harassment on women's careers in archaeology. Data that speak directly to these goals have been reported at length elsewhere (Meyers et al. Reference Meyers, Boudreaux, Carmody, Dekle, Horton and Wright2015), but here we analyze and discuss several other aspects of the data gathered as part of the SEAC SHS. These include longitudinal data about sexual harassment collected in an attempt to identify changes in sexual harassment over time. Also, data were gathered on the division of labor at field sites and within domestic settings (i.e., field camps or houses) associated with field sites in order to identify any relationship between the frequency of sexual harassment and a gendered division of labor, and data on differences in the frequency of sexual harassment in field settings with male and female supervisors. After these data are presented and discussed, we conclude with a discussion of how they could be used to inform sexual harassment policies and procedures with the intent of decreasing sexual harassment in the discipline.
BACKGROUND
Many readers might think that a sexual harassment survey in archaeology is not necessary. Studies within the last 20 years suggested that gender equity was within reach (Zeder Reference Zeder1997). However, a brief history of the discrimination of women in archaeology underscores a long-standing pattern of harassment within the discipline that is not easily overcome. Two overarching studies (Browman Reference Browman2013; Levine Reference Levine, Nelson, Nelson and Wylie1994) examined the often-ignored contributions of women archaeologists during the first half of the twentieth century, repeatedly documenting how women were actively discouraged and discriminated against within the field. For example, Marjorie Lambert (in Tisdale Reference Tisdale, Leckie and Parezo2008:80) described how male archaeologists refused to teach women excavation techniques so they could not pursue archaeology as a career. Edward Burgess used female students to babysit his children and bring him lunch during fieldwork; he required one to remit half her fellowship money to him (Browman Reference Browman2013). Other luminaries in the field (Alfred Kroeber, Fay-Cooper Cole, Alfred Tozzer, A. V. Kidder, and J. O. Brew) actively discouraged women from pursuing graduate studies (Browman Reference Browman2013:265). As a result, many women chose nontraditional paths not dominated by men. As Lister (Reference Lister1997:5) stated, the “only way to break into the discipline was to find some aspect of the fieldwork that men did not enjoy doing and then to become a specialist in it.” Another option was museum work (Levine Reference Levine, Nelson, Nelson and Wylie1994; Sullivan et al. Reference Sullivan, Braly, Harle, Koerner and Williamson Huber2011) for which women were often thought especially suited to because it was akin to housework (Browman Reference Browman2013:31). In effect, women during the early and mid-twentieth century became invisible, often unable to finish doctoral degrees, procure tenure-track positions, or work in the field.
During the 1960s and 1970s, as more women entered the profession, changes began to occur. Some backlash came with these changes—Ivor Nöel Hume (Reference Nöel Hume1969) notoriously stated women had no place in the field and were better suited to lab work. The Society for American Archaeology (SAA) formed the Committee for the Status of Women in Archaeology (COSWA) to address discrimination and increase mentoring opportunities for women. By the 1980s this effort appeared to have been successful—the SAA had a female president (Dena Dincauze) and a female editor (Patty Jo Watson). There was a sense that gender equality had been attained, and the committee was disbanded (Watson Reference Watson, White, Sullivan and Marrinan1999:294). However, as Watson (Reference Watson, White, Sullivan and Marrinan1999:294) states, “That action was reversed very shortly thereafter when a new generation of women formed a different kind of constituency within the SAA,” suggesting that gender parity had not been attained.
Specific to the Southeast, the edited volume Grit-Tempered: Early Women Archaeologists in the Southeastern United States (White et al. Reference White, Sullivan and Marrinan1999) focused specifically on women in this region working during the mid- and late twentieth century. Although this book recognized the adversities encountered by and lauded the accomplishments of women such as Margaret Ashley of Georgia and Madeline Kneberg Lewis of Tennessee, this volume is in some ways as remarkable for what it does not directly address as what it does. “Discrimination” is not even a line in the index despite evidence of it (see chapters on, among others, Adelaide Bullen, Carol Mason, Madeline Kneberg Lewis, and Elizabeth Wing), including several references to women prohibited from doing fieldwork and a discussion of the possible role discrimination played in the invisibility of large numbers of women from the earliest eras of archaeology (White et al. Reference White, Sullivan and Marrinan1999:20–23).
The introduction to Grit-Tempered noted how things had changed as of 1999 when women made up a significant percentage of the field and many institutional barriers had been dropped. Also, “since sexual harassment is no longer a hidden issue” (White et al. Reference White, Sullivan and Marrinan1999:15), the focus was on celebrating those who had survived the past and looking forward to a future where none would suffer harassment again. Indeed, contemporaneous studies, including a 1997 survey of archaeologists conducted by the SAA (Zeder Reference Zeder1997), espoused similar ideas. Although 36% of respondents were women, the gender composition of students was almost evenly split between males (49%) and females (51%). Similarly, data by Garrow and colleagues (Reference Garrow, Garrow, Thomas and Claassen1994) showed that although fewer women than men were working in private sector archaeology (40% vs. 60%), trends were moving toward a gender balance, and the authors believed that a cultural renegotiation of gender roles would be necessary to fully attain equality. Over all, examination of women in the field in the 1990s was optimistic, suggesting archaeology was past the days when women were not allowed into the field or were given low-status or non-fieldwork jobs (e.g., Nöel Hume Reference Nöel Hume1969).
In the last 20 years, multiple studies have examined differences in research output between men and women in archaeology. Claassen and colleagues (Reference Claassen, O'Neal, Wilson, Arnold and Lansdell1999:95) examined trends during seven years of SEAC meeting abstracts and Southeastern Archaeology journal articles and found that men produced more written and oral presentations of their data, despite an increase in women's membership in the organization. Men also were more likely to be invited to participate in symposia than women. Fifteen years later, Bardolph and VanDerwarker (Reference Bardolph and VanDerwarker2016) examined the role of gender in scholarly authorship in Southeastern Archaeology and found similar results: women were presenting more papers at SEAC, but there were far fewer women symposia organizers or discussants, and women published at much lower rates (e.g., 26% of articles between 2000 and 2013 were lead authored by women). Bardolph (Reference Bardolph2014) also examined this issue for five major research journals and five regional journals and found similar trends of lower publication rates by women. Around the same time, the SAA Task Force on Gender Disparities in Archaeological Grant Submissions (www.saa-gender.anthropology.msu.edu) was created to investigate differences in submission rates to grant agencies between male and female principal investigators. The task force collected survey data to test nine hypotheses. Some of their findings showed that women work more on their own than men (e.g., 50% of men submit with co-principal investigators as compared to 16% of women), women receive less mentoring than men, and women are more likely to use creative scaffolding; that is, apply for multiple smaller grants to support their research. None of these studies makes clear why women publish and present at lower rates than men, though some refer to but do not quantify sexual harassment as one possible factor.
This brief overview of the history of women in the field shows that discrimination was pervasive. Present-day disparities in publishing and grant submissions suggest that its effects linger. Such enduring discrimination was recently made explicit in a textbook on CRM principles and methodology (Neumann et al. Reference Neumann, Sanford and Harry2010). A chapter on professionalization in CRM contains a special section of tips for women in archaeology that suggest it is women's responsibility to adjust their actions in order to succeed (Neumann et al. Reference Neumann, Sanford and Harry2010:23–24). Although they note data showing women make less money than their male counterparts (e.g., Whittlesey Reference Whittlesey, Nelson, Nelson and Wylie1994; Zeder Reference Zeder1997), are less successful in getting contracts and grants (e.g., Gero Reference Gero, Nelson, Nelson and Wylie1994, Zeder Reference Zeder1997), and do not lead large field projects as often as men (Neumann et al. Reference Neumann, Sanford and Harry2010:23), Neumann and colleagues view these as “trends” due only in part to sexism and family conflictsFootnote 1 and due more to “the way in which women present themselves” (Reference Neumann, Sanford and Harry2010:23). Specifically, they suggest “women should exude confidence in their own capabilities,” although in a confusing contradiction they also state that their “experience and skills should never be embellished.” They further note that “although many women do manage to raise children and remain active as fieldworkers, such work is often incompatible with at least the early years of motherhood” and that women who are mothers “are able to remain employed as archaeologists by developing other special skills, such as writing, artifact analysis, or geographic information system (GIS) mapping” (Neumann et al. Reference Neumann, Sanford and Harry2010:23). In this way, they echo earlier and well-worn career tracks laid out for women that encouraged non-fieldwork participation (Browman Reference Browman2013). The authors note that being successful as an archaeologist means learning not only basic archaeological skills but also “the unspoken ones that guide the socially expected behavior of the workplace,” which can include “knowing what to wear, how to handle difficult people and situations, how to juggle family and job responsibilities, and how and when to promote oneself” (Neumann et al. Reference Neumann, Sanford and Harry2010:23–24).
As one of the few texts specific to the profession of CRM, we find its tone problematic. Ideas that women should attempt different professional tracks, particularly if they parent, and that women's dress and speech should be monitored indicate that discrimination not only exists in the discipline but is part of the training within the discipline. We suggest that one of the unspoken but socially expected behaviors of archaeological workplaces that women need to navigate may also be sexual harassment, and that the effects of sexual harassment on women's careers and the discipline as a whole may be more wide-ranging than we have considered. Quantifying the presence and frequency of sexual harassment is an important step to understanding gender balance within archaeology.
SURVEY BACKGROUND AND METHODS
After taking the SAFE survey in 2013, the lead author thought a similar survey of the rate of harassment experienced by archaeologists would provide valuable data not only on field conditions experienced by archaeologists but also on the effect those conditions might have on individuals’ careers. She proposed to the SEAC board a sexual harassment survey of its members. Pending institutional review board (IRB) approval through the University of Mississippi, the board agreed to the survey and a SEAC Sexual Harassment Survey (SHS) committee was formed.Footnote 2 IRB approval was obtained in August 2014. A draft survey was beta tested by archaeologists (male and female) who were not members of SEAC. The survey was conducted entirely online and opened in fall 2014 using Qualtrics software licensed to the University of Mississippi, which also hosted the survey. The survey remained open from September 29 through December 1, 2014, to any person who had done archaeological fieldwork in the Southeast. The committee advertised the survey and provided a link to it on the SEAC website and via e-mails sent to all SEAC members, all Southeastern state professional and avocational organizations, and universities and colleges with active fieldwork in the Southeast (as determined using the American Anthropological Association guide). A link to the survey also was posted on the SEAC Underground blog and by multiple organizations and individuals on Facebook and Twitter. CRM firms who practice in the Southeast, as identified on the American Cultural Resource Association (ACRA) website, were also contacted via e-mail. Finally, we placed a QR code link to the survey on the poster presented at the 2014 SEAC meeting. A total of 382 people took the survey. At that time (2014), SEAC's membership totaled 1,007 members, including 927 individual members (Southeastern Archaeological Conference 2015:40–41).
The survey was divided into four sections: personal information, general climate, field and non-field activities, and sexual harassment. Personal information included age, race/ethnicity, sexual orientation, education level, length of time as an archaeologist, and type of archaeological employment (i.e., academic, CRM, government, etc.).Footnote 3 General climate questions were separated into questions that asked about experiences as a student and as a non-student. These included questions about gender of project director, ratio of men and women at sites, presence of sexual harassment, presence of code of conduct policies, Likert scales to rate how much input was valued by directors, and lists of field activities (e.g., equipment maintenance, driving, mapping, screening, shoveling, washing and cataloging artifacts, etc.) and non-field activities (e.g., food procurement, meal preparation, maintenance of living quarters, etc.). Field and non-field activity questions specifically asked respondents to rate the degree of gender segregation by activity. Tied to these questions, we attempted to gather longitudinal data by asking how long ago these experiences occurred. Sexual harassment and assault questions specifically asked about harassment and assault in the field. Those who responded that they had experienced assault or harassment were asked whether there had been mechanisms in place for reporting the harassment or punishing the offender, and if harassment had any effects on their career. As stated, the sexual harassment and assault data have been thoroughly reported elsewhere in Meyers and colleagues (Reference Meyers, Boudreaux, Carmody, Dekle, Horton and Wright2015); here, it will be briefly reviewed but also compared to the gendered segregation of tasks and longitudinal data to identify any trends in sexual harassment and assault over time.
BIOGRAPHICAL PROFILE OF RESPONDENTS
The first part of the survey collected biographical data from respondents (Figures 1–4; Supplemental Tables 1 and 2). It should be noted that although 382 people took the survey, not all respondents answered each question. The majority of survey respondents, or approximately 65%, identified as female. Thirty-three percent identified themselves as male, while six respondents, or 2% of those who participated, chose not to respond to the question. The breakdown of the age of the survey respondents is shown in Supplemental Table 1. The majority of respondents (68%) hold an advanced degree. The overall breakdown of degree earned by those who answered this question can be seen in Supplemental Table 2. Thirty-seven percent of survey respondents earned their degree within the past 10 years, representing the largest percentage of survey respondents.
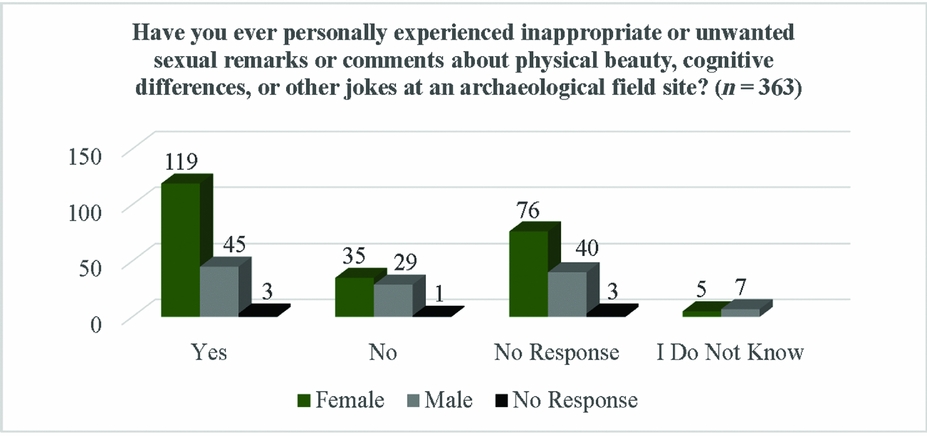
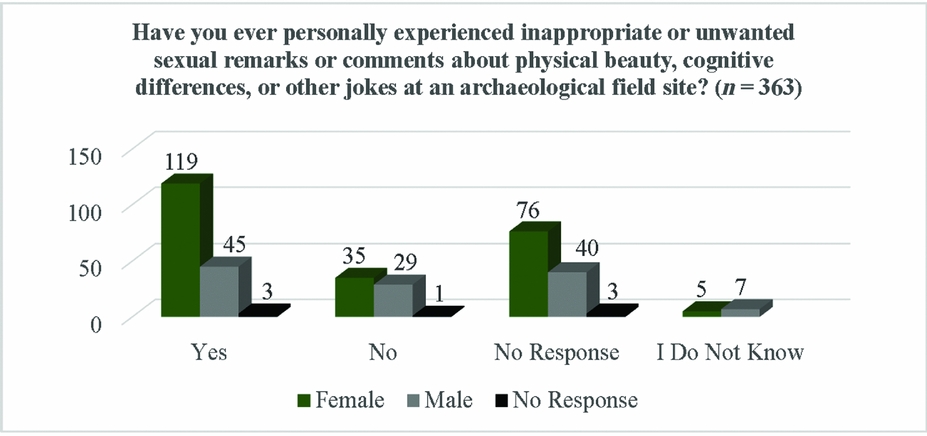
Experience of respondents with inappropriate or unwanted remarks or comments in the field by gender.
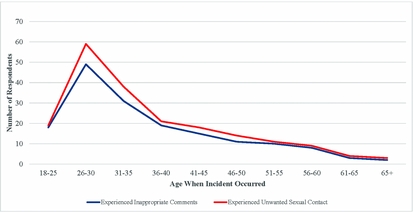
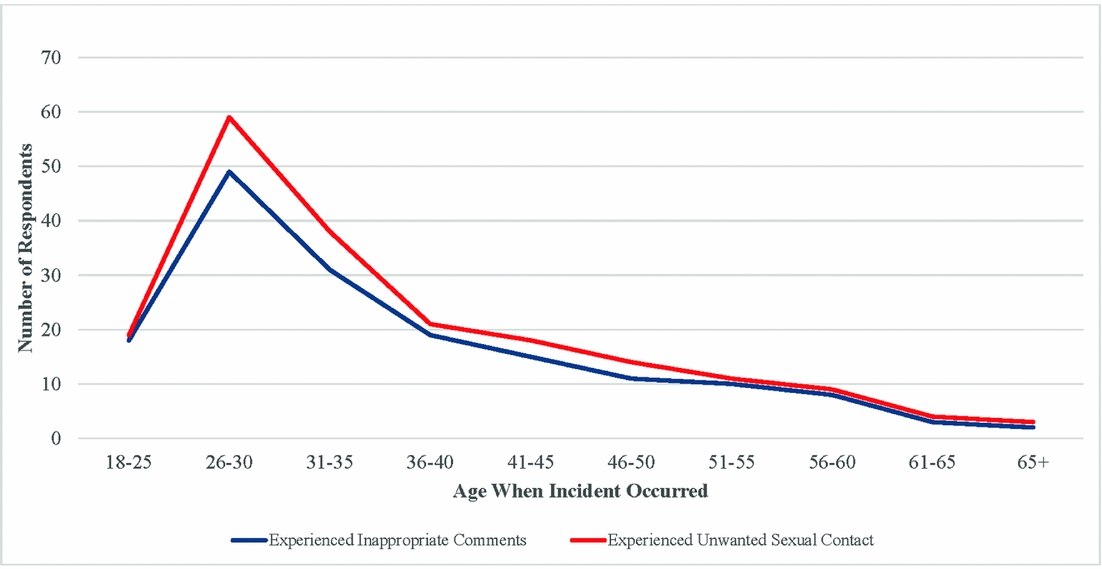
Experience with inappropriate remarks and unwanted sexual contact in the field by age.
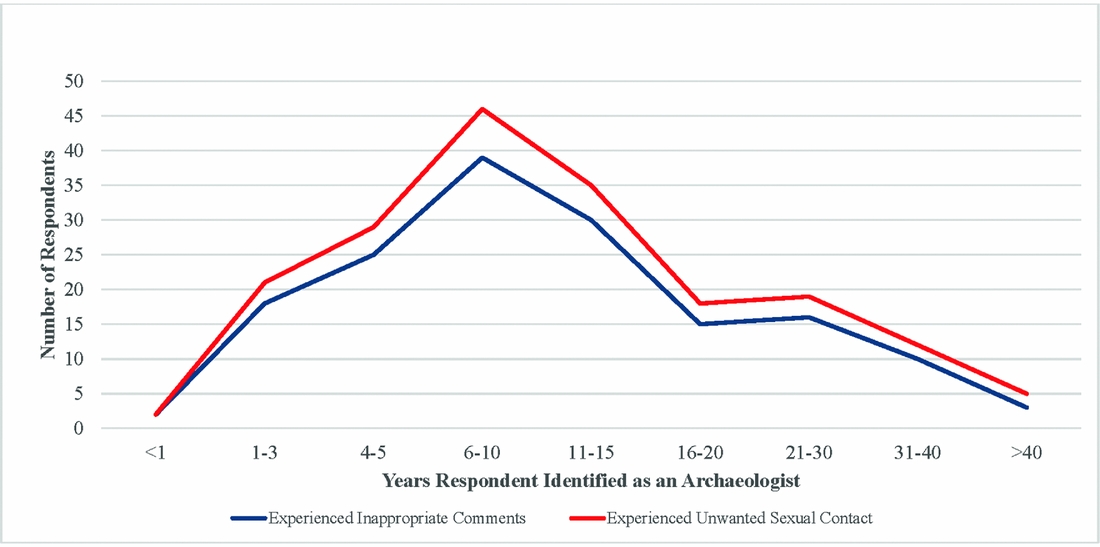
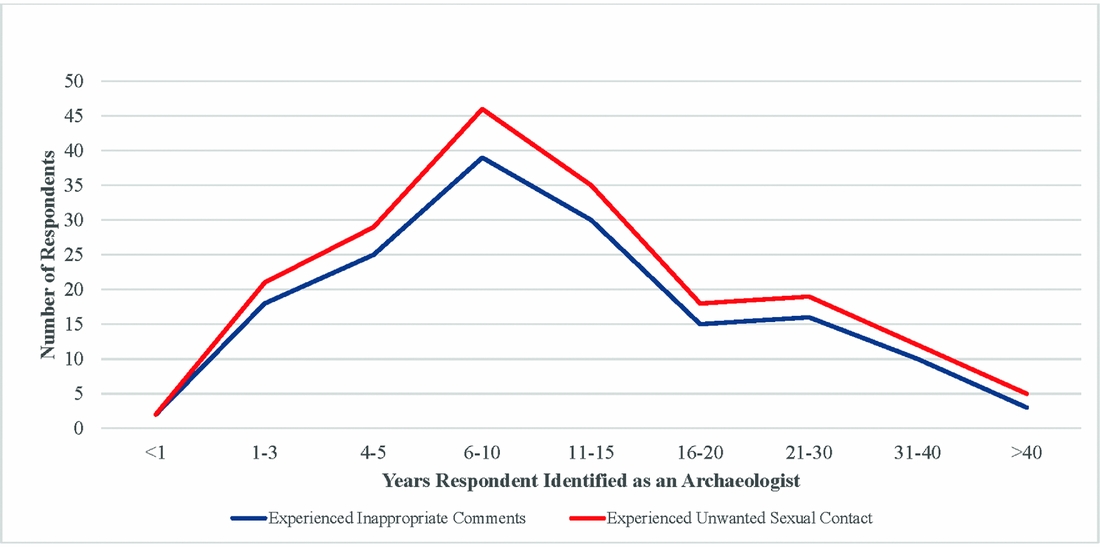
Experience with inappropriate remarks and unwanted sexual contact in the field by length of time identifying as an archaeologist.
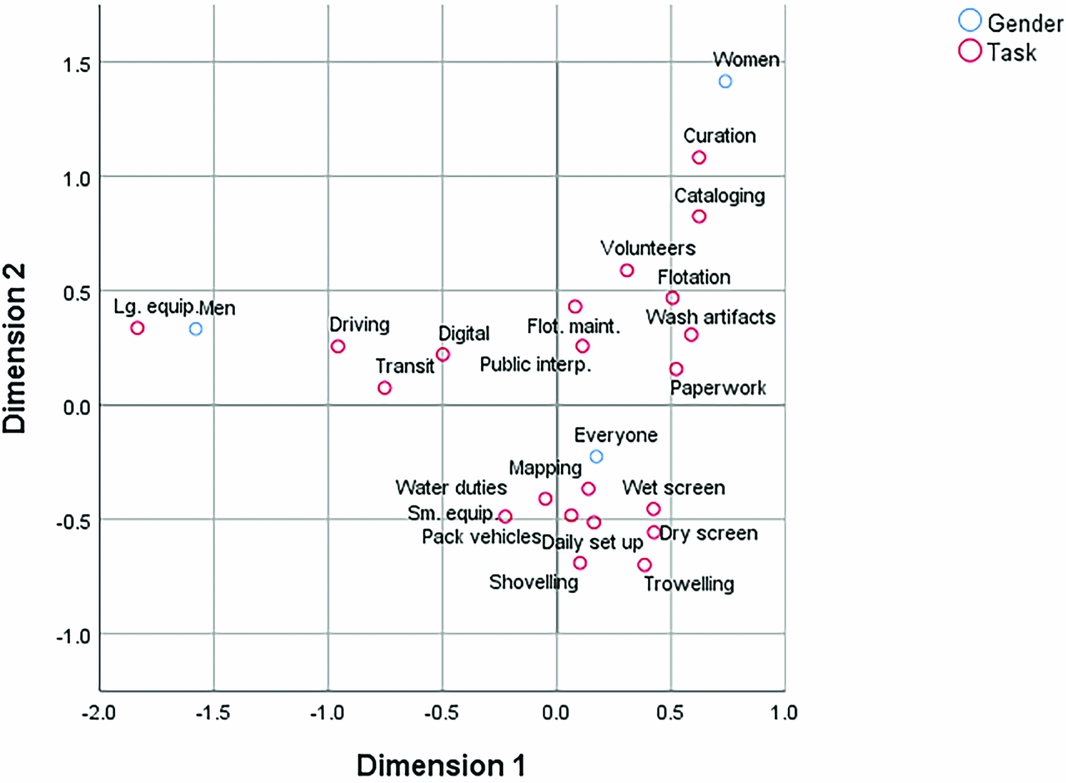
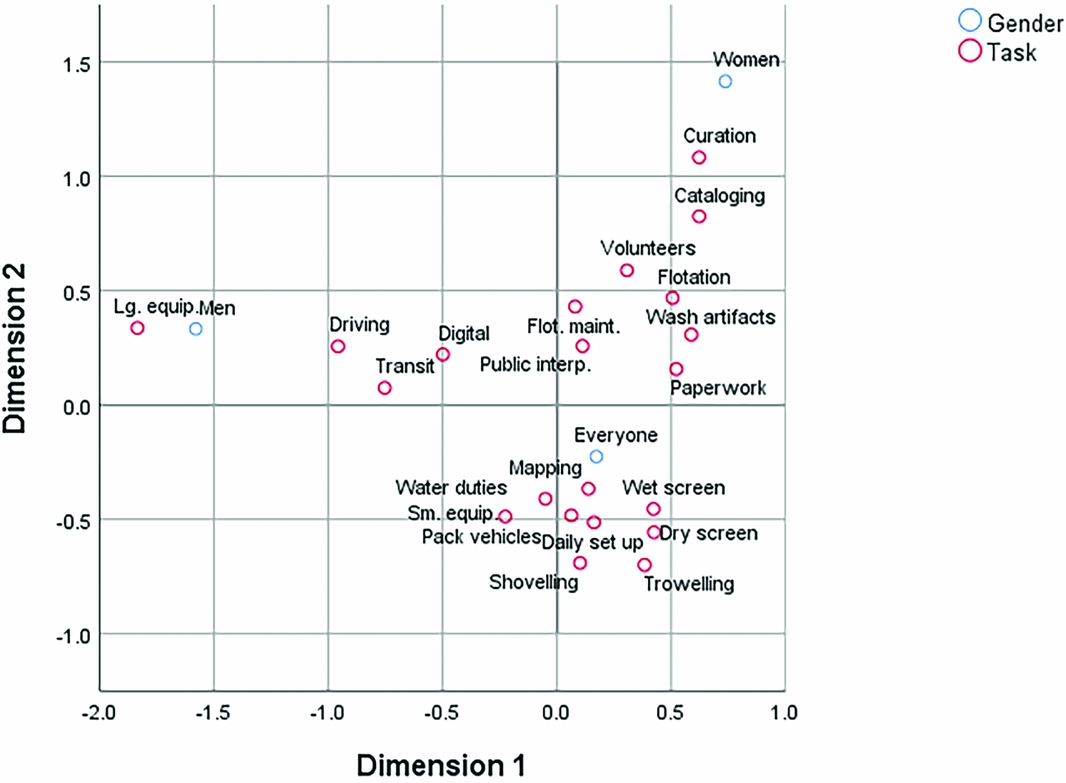
Correspondence analysis of on-site field tasks by who performed them (everyone, mostly men, or mostly women).
The most common category of employment (49%) is academia, and approximately one-third (32%) of that group identified as students. The second most popular category was contract archaeology (27%), including field and lab technicians, crew chiefs, and principal investigators. Although the lower number of respondents who identifed as working in CRM does not align with other data (Neumann and Sanford Reference Neumann and Sanford2001:2) that show approximately 80% of U.S. archaeologists are employed by the CRM industry or government, this difference may reflect regional employment differences and/or the transitory nature of field technician employment (as compared to academic employment), possibly making that demographic more difficult for the survey to reach. Further, at least one CRM company owner who received the survey refused to advertise it to or otherwise share it with his employees because he felt the questions were leading and harassment was an issue for academia and not the private sector. In addition, students, particularly graduate students, often work in CRM while in school and may have identified themselves as “student” rather than “CRM.” Government employees accounted for 8% of respondents, while nonprofit or volunteer positions accounted for 4%. Three percent of the respondents were employed in museums, either as technicians or curators. The remaining 9% worked in an area not specified by the survey.
SURVEY STRUCTURE
The SEAC SHS survey design drew heavily upon the SAFE survey (Clancy et al. Reference Clancy, Nelson, Rutherford and Hinde2014), but the former was amended with questions of particular relevance to archaeology in general and Southeastern archaeology specifically. Following 13 questions soliciting personal/demographic information, survey participants were asked 9 questions about their overall field experiences as a student, 10 questions about their most recent field experience, 9 questions about their overall field experiences as non-students, and 21 questions related to inappropriate conduct, sexual harassment, and sexual assault in the field. Based on responses to this last group, we identified and addressed four research questions (Meyers et al. Reference Meyers, Boudreaux, Carmody, Dekle, Horton and Wright2015): (1) Does harassment and unwanted sexual contact occur? (2) Has the frequency of harassment changed through time? (3) Who has been harassed and in what contexts does the harassment occur? (4) Does harassment affect respondents’ careers? We briefly discuss our findings below.
Questions dealing with more general field experiences of students and non-students provided much-needed context for our assessment of sexual harassment and assault in the field. Given differential experience of men and women when it comes to sexual harassment and assault, many of our questions dealt with potentially gendered dimensions of fieldwork. For example, we asked survey respondents how many of their field projects were directed by a man or by a woman, what was the female-to-male ratio of researchers at respondents’ most recent field sites, and if tasks were segregated by gender at field sites. Specifically, we asked if mostly men, mostly women, or everyone participated in a variety of “archaeological/professional” or “domestic” activities—the latter of which are most relevant in a group-living situation such as often occurs with nonlocal field schools (but not necessarily in nonlocal CRM projects). A complete list of these “archaeological/professional” and “domestic” tasks appears in Supplemental Table 3.
Why did we ask questions about gendered dynamics in day-to-day field operations in a survey addressing the prevalence of sexual harassment? Because as archaeologists have always pointed out, context matters. Previous studies have documented an underrepresentation of women in certain professional arenas in Southeastern archaeology, including tenure-track positions (Sullivan Reference Sullivan2014), journal publication (Bardolph Reference Bardolph2014; Bardolph and VanDerwarker Reference Bardolph and VanDerwarker2016), paper citations (Hutson Reference Hutson2002), symposium participation as discussants (Claassen et al. Reference Claassen, O'Neal, Wilson, Arnold and Lansdell1999), C. B. Moore Award winners for excellence in Southeastern archaeology (Baires and Henry Reference Baires and Henry2015), and leadership roles on the SEAC board (Baires and Henry Reference Baires and Henry2015). More broadly, Baires and Henry (Reference Baires and Henry2015) note that a similar pattern has been identified in the AAA and SAA (Surface-Evans and Jackson Reference Surface-Evans and Jackson2012) and that “women predominantly hold elected positions perceived as fulfilling traditional female roles: that of secretary or other types of ‘support staff’ positions” (Baires and Henry Reference Baires and Henry2015:16). In other words, it appears that biases about gender roles may be reflected in the leadership of archaeological organizations; we wanted to know if these biases are present in the organization of field activities.
Having said this, it is worth noting that Southeastern archaeology involves both academic and professional (i.e., governmental, cultural resources management) fieldwork. Each involves different types of field settings and potential contexts for discrimination and/or harassment and assault. Most archaeologists first learn archaeology in field schools and, therefore, field school culture and mores are often reified in nonacademic settings. Academic field experiences, such as field schools or other university-affiliated research projects, often involve long-term residence at a nonlocal field site and cohabitation with team members. Professional fieldwork can occur locally or nonlocally (relative to the fieldworker's permanent residence) but does not often involve intensive cohabitation. As a result, professional archaeological fieldwork rarely involves the sorts of domestic tasks among which we sought to assess a gender-based division of labor. While our survey structure precludes our ability to thoroughly investigate the implications of the differences between academic and professional archaeological fieldwork in the Southeast, the data collected are valuable in identifying patterns present in both field contexts.
Results
As previously reported, 68% (n = 166/244) of respondents indicated they had experienced inappropriate remarks in the field (Figure 1) while 13% (n = 31) were the victims of unwanted sexual contact (Meyers et al. Reference Meyers, Boudreaux, Carmody, Dekle, Horton and Wright2015:Table 1). Although both male and female respondents reported having experienced sexual harassment in the field, the victims of harassment were overwhelmingly female. Individuals who experienced inappropriate remarks were nearly three times more likely to have been women than men (71% vs. 27%), and those who experienced unwanted sexual contact were nearly four times more likely to have been women (77% vs. 19%; Meyers et al. Reference Meyers, Boudreaux, Carmody, Dekle, Horton and Wright2015:Figures 6 and 7).
To examine our first question with regard to changes in harassment and assault over time, two similar sets of data were used. Age of respondent was compared to the presence of harassment and assault (Figure 2; Supplemental Table 4), and length of time the respondent identified as an archaeologist was compared to the presence of harassment and assault (Figure 3; Supplemental Table 5). Comparing by age, harassment and assault occur at different rates according to age cohort. For example, there is a decline in harassment for respondents between the ages of 18 and 25. Comparing length of time respondents identified as archaeologists with frequency of harassment, there is an increase in harassment occurring in those with more than 20 years of identification as an archaeologist, followed by a slight decrease, and then a more noticeable increase for those identifying as archeologists between 6 and 15 years, or roughly ages 25–35. There is less harassment for those identifying as archaeologists less than five years.
The difference in both harassment and assault responses between the younger and older cohorts likely reflects decreased field experience for the 18–25-year cohort as compared to the 25–35-year cohort, which has an increased rate of harassment and assault. The differences could also reflect a lack of responses from those who were assaulted and dropped out of the field. For assault, those in the field 6–15 years have highest levels of assault—noticeably 23% for those identifying as an archaeologist between 6 and 10 years. This is more than one out of five persons. The decreased rate of assault among newer archaeologists may reflect that they have had less time in the field, that some of the recently assaulted have left the discipline, or that there is an actual reduction in sexual assault.
Our second question examined relationships between the segregation of tasks by gender in both field and non-field settings. The SEAC survey included a list of tasks commonly associated with archaeological fieldwork, and participants were asked if these tasks had been performed mostly by men, mostly by women, or by everyone during their fieldwork experiences. Participants were asked about two sets of fieldwork tasks: those associated with being on-site during a typical work day (Supplemental Table 6) and those associated with the crew's housing/living situation when not actually on-site (Supplemental Table 7). The original survey asked questions regarding 26 on-site and 14 housing tasks (Meyers et al. Reference Meyers, Boudreaux, Carmody, Dekle, Horton and Wright2015), but the former were reduced to 21 categories for the analysis reported here by combining several similar tasks. A majority of respondents indicated that everyone—regardless of gender—was expected to perform all but one of the on-site tasks and all of the housing tasks included in the survey. The possible association between gender and the performance of some tasks is suggested, however, by the wide ranges in the percentages of tasks performed by mostly men (2%–52%) or mostly women (1%–28%) and the fact that at least one task, the operation and maintenance of large equipment, was performed by everyone less than half of the time (47%).
Correspondence analysis (CA) was used to further explore the association between gender and task in these data. CA is a data-reduction technique that uses the chi-square metric to graphically represent points in two dimensions so that the distances between points approximate the chi-square distances between the rows they represent (Sourial et al. Reference Sourial, Wolfson, Zhu, Quail, Fletcher, Karunananthan, Bandeen-Roche, Béland and Bergman2010:639–640; Yelland Reference Yelland2010:8). In CA plots, the distances between points can be used to infer relationships between variables (Sourial et al. Reference Sourial, Wolfson, Zhu, Quail, Fletcher, Karunananthan, Bandeen-Roche, Béland and Bergman2010:642). In the data discussed here, the proximity of tasks to the categories of men, women, or everyone can allow us to visualize how tasks and gender are related.
Figure 4 shows the CA plots based on frequencies for on-site and housing tasks. Inertia is a measure of how well data are represented in two-dimensional space. Inertia values range from 0 to 1, and those that can be successfully reduced to two dimensions will have higher scores. The chi-square statistic for on-site tasks is significant at the 0.001 level (χ2 = 3592.113; df = 40), but the modest combined inertia score of 0.214 for Dimensions 1 and 2 indicates that the association between gender and task, although significant, is weak. The CA plot indicates that most on-site tasks—13 of the 21 (62%) tasks included in the survey—are performed by everyone as nearly all tasks cluster around the point indicating the category “Everyone” located near the plot's origin (Supplemental Figure 1). The exceptions (those cases that are located farthest from the origin) include maintenance/operation of large equipment, driving duties, transit set up/operation, and maintenance/operation of digital equipment. These are activities that were reported as performed mostly by men 24% of the time or more. Other exceptions, those that were reported as performed mostly by women 19% of the time or more, included curation, cataloging, managing volunteers, and flotation.
The CA plot of household tasks gives very little indication that they are strongly associated with gender, which is consistent with the fact that 82%–95% of respondents indicated that everyone was required to perform these tasks. The combined inertia score of only 0.047 for Dimensions 1 and 2 shows a significant (p < 0.0001) but very weak association between gender and task for household activities (χ2 = 249.737; df = 26). Although tasks were reportedly performed mostly by everyone, several tasks are associated relatively more with men or women. The tasks most associated with men—those farthest from the origin on Dimension 1 and those reportedly performed mostly by men 8%–12% of the time—are procuring ice and dealing with trash. Those most associated with women—those farthest from the origin on Dimension 2 and those reportedly performed mostly by women 8%–12% of the time—are food procurement, dinner preparation, coffee preparation, and cleaning of living areas.
The last question we examined was the presence of a relationship between rate of harassment and assault and the gender of one's supervisor (Supplemental Table 8). These data were not easy to parse because of the wording of the survey. For persons whose last four field projects were led by female supervisors, 35 (out of 50; 70%) respondents experienced harassment and 5 (out of 49; 10%) reported assault. By comparison, persons whose last four projects were led by male supervisors, 149 (out of 218; 68%) experienced harassment and 30 (out of 217; 14%) reported assault. That is, the rate of harassment on field projects is about the same regardless of supervisor's gender, and the rate of assault is slightly higher on male-directed field projects.
DISCUSSION
One question examined through the SEAC SHS survey was concerned with change through time. Specifically, has the frequency of harassment and assault changed over time? Respondents between the ages of 25 and 35, which correlates with those who have identified as archaeologists for 6–15 years, report the highest rates of harassment and assault. The patterns may not so much show that harassment and assault are occurring less frequently in more recent times but that the longer one is an archaeologist, the more likely one will be harassed and/or assaulted, particularly if you are a woman.
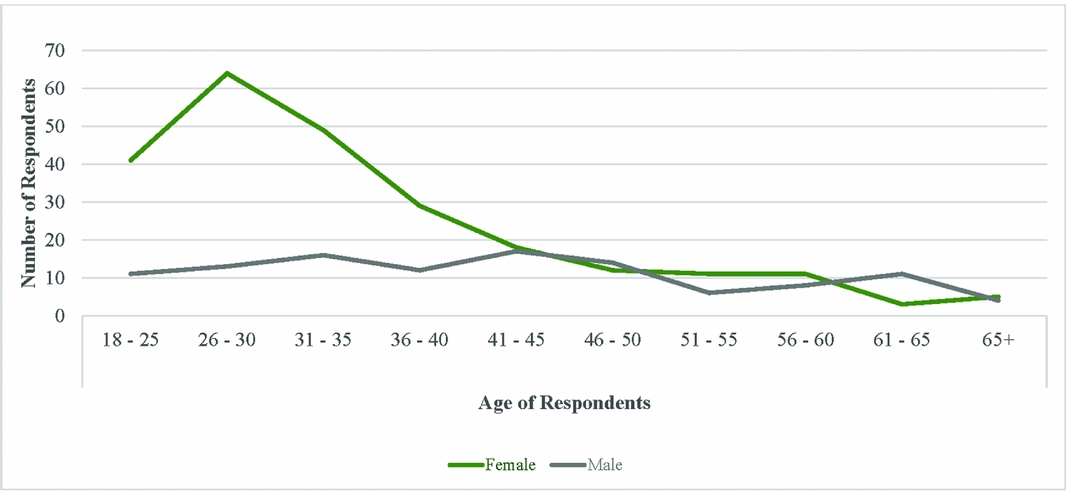
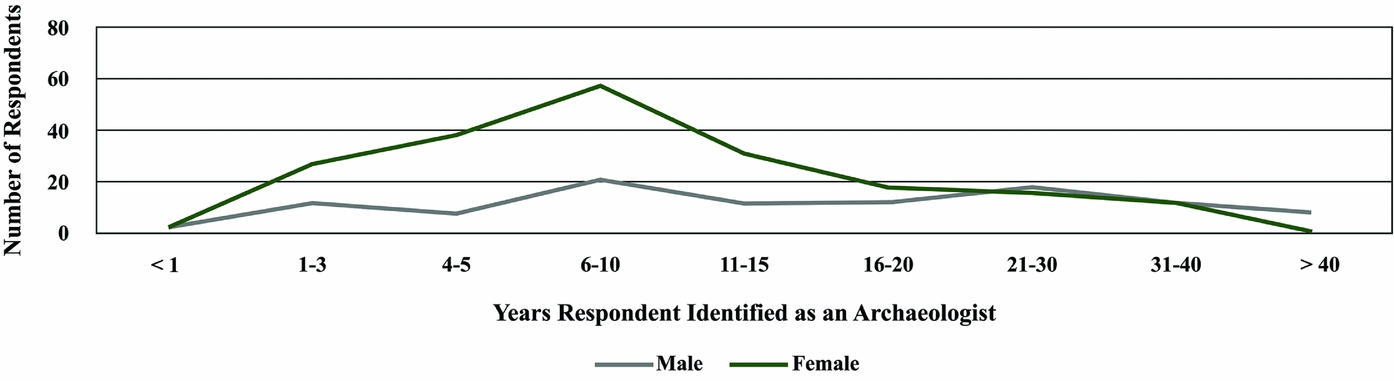
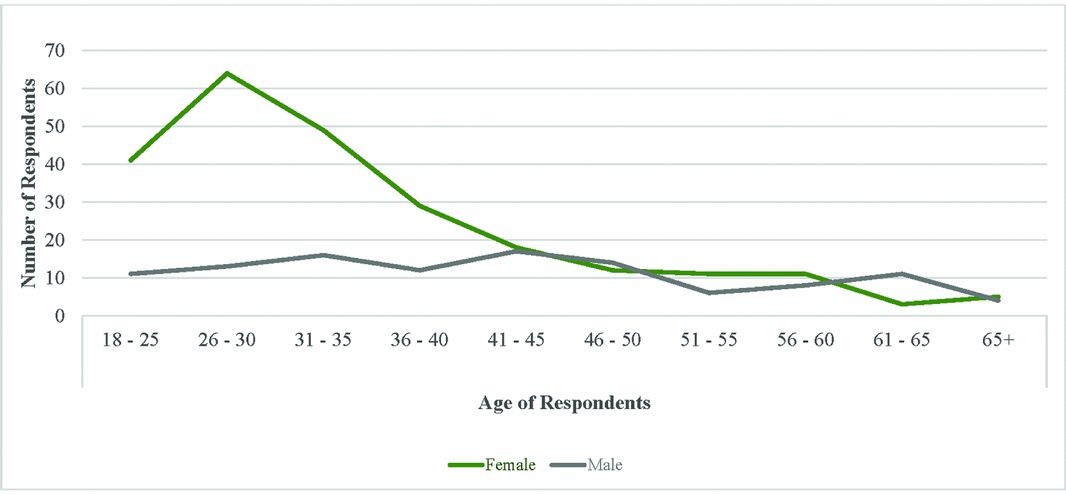
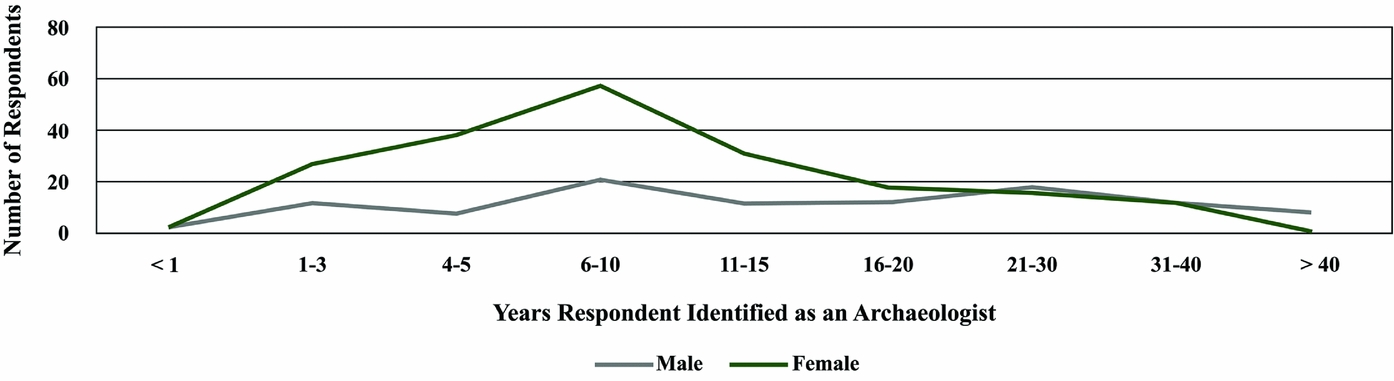
The lower frequency of harassment and assault in the upper age and more experienced cohorts could reflect a few things. It may reflect that less sexual harassment and assault occurred in the past than more recently, possibly because fewer women were present in the field 40 years ago. Another reason may be that the lower numbers reflect an exit from the profession by those experiencing harassment and assault. Our data show that women overwhelmingly experience harassment and assault, and that harassment and assault are most likely to occur to individuals in the 25–35-year age cohort who have been in the field 6–15 years. Comparing both different age ranges of respondents (Figure 5; Supplemental Table 9) and length of time identified as an archaeologist with gender (Figure 6; Supplemental Table 10), there is a marked decrease in female respondents after age 35 and with more than 6–11 years of field experience, while at the same time, there is a marked increase in the number of male respondents after age 35 and with 6–11 years of field experience—even though fewer men than women responded to the survey. Many gender-related factors (e.g., low pay, family issues) may lead women to drop out of the field, and it is likely that a combination of negative factors result in women leaving the profession. Our data suggest that one of those negative factors is experiencing many years of harassment and assault.
Age of respondents by gender.
Time identifying as an archaeologist by gender.
We asked respondents if there had been any effects on their career as a result of harassment and assault. Twelve percent (n = 29) responded yes. Although this number may seem low, the data presented above suggest that one effect on women's careers is exiting the field and, therefore, affected women would be less likely to know about or take the survey. Of those who answered yes, these effects included changing jobs in archaeology (53%), changing field sites (31%), and slowing research trajectories (31%). More broadly, individuals who indicated that sexual harassment had negative effects on their career reported insecurity about their abilities (70%) and about their career futures (64%) (Meyers et al. Reference Meyers, Boudreaux, Carmody, Dekle, Horton and Wright2015:Figure 9). When these data are viewed in light of the reduced publishing and grant applications by women documented in numerous studies and discussed above (www.saa-gender.anthropology.msu.edu), sexual harassment and assault appear to be significant factors in women's careers in archaeology. Two recent surveys of the membership of the Society of California Archaeology also focused on the presence and frequency of sexual harassment (Bardolph Reference Bardolph2017; Brown Reference Brown2017; Gonzalez Reference Gonzalez2017; Radde Reference Radde2017; VanDerwarker et al. Reference VanDerwarker, Brown, Gonzalez and Radde2017a, Reference VanDerwarker, Brown, Gonzalez and Radde2017b) and provide additional evidence of such a disproportionate impact. One of their key findings is that while women are choosing CRM over academia as a career path, they experience more harassment and are paid less than their male counterparts. As VanDerwarker and colleagues (Reference VanDerwarker, Brown, Gonzalez and Radde2017b:18) state, “This is a troubling trend.” If harassment of women continues at the current rate, this trend is likely to continue.
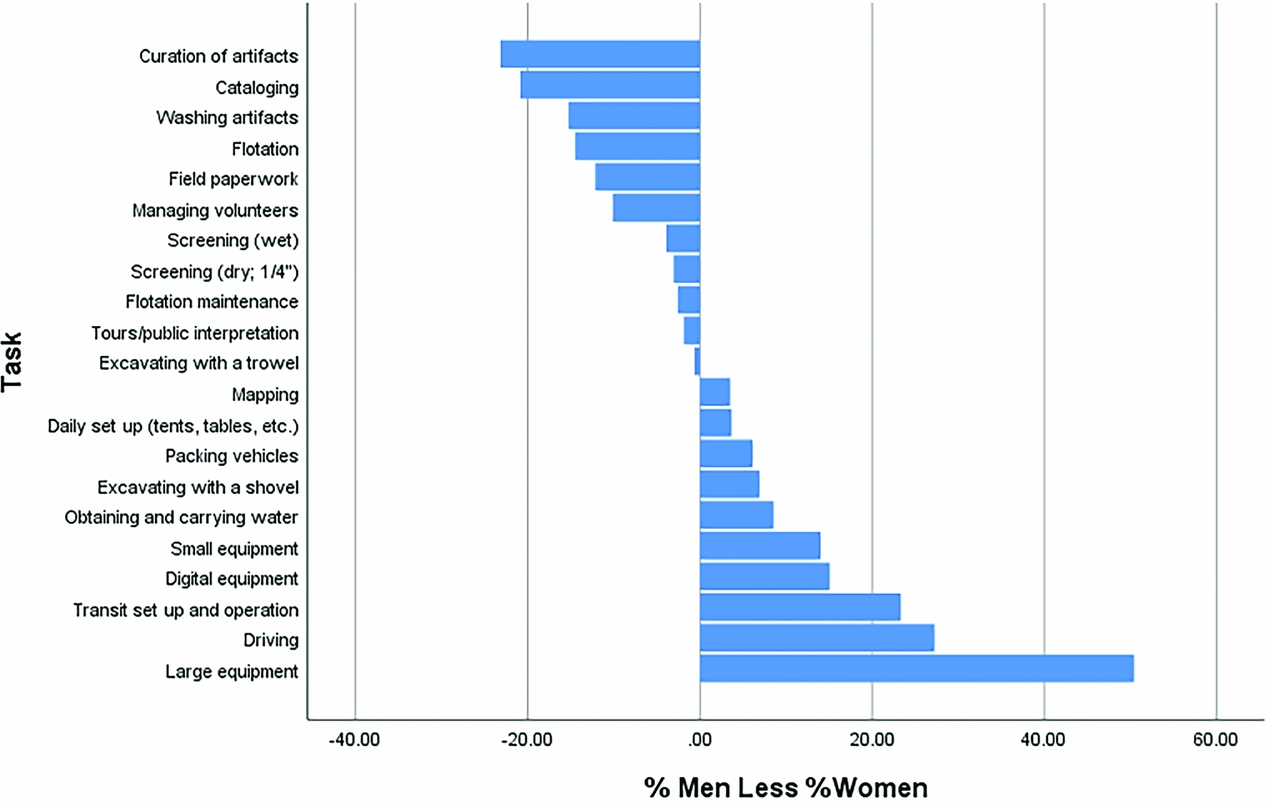
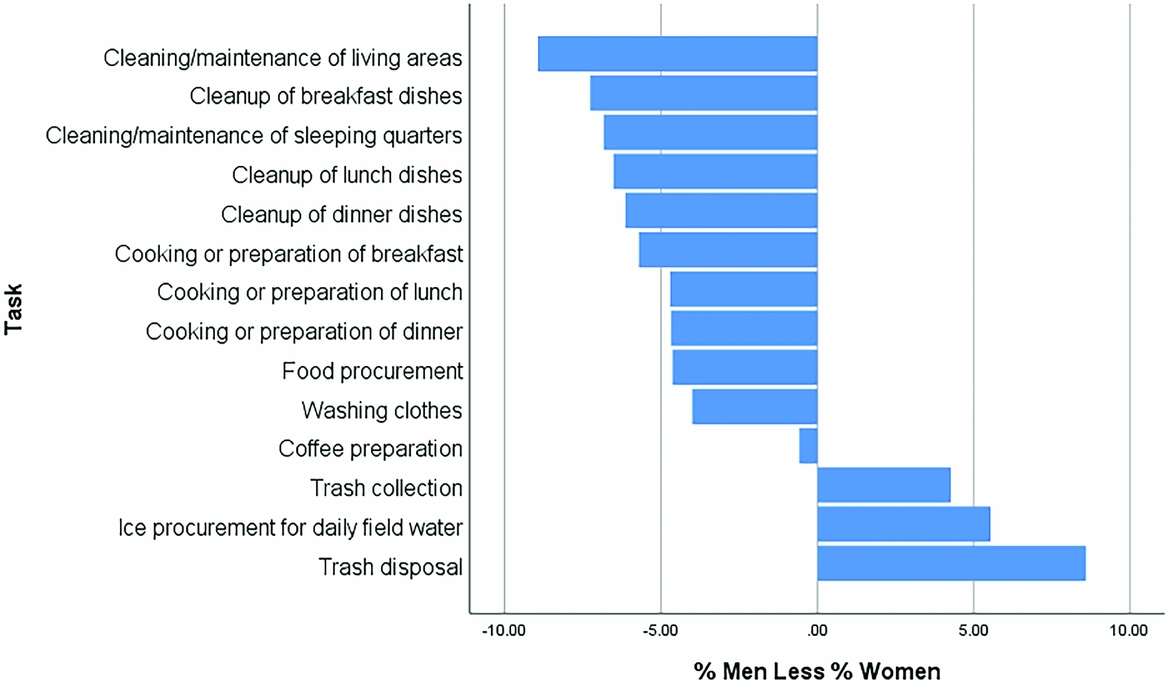
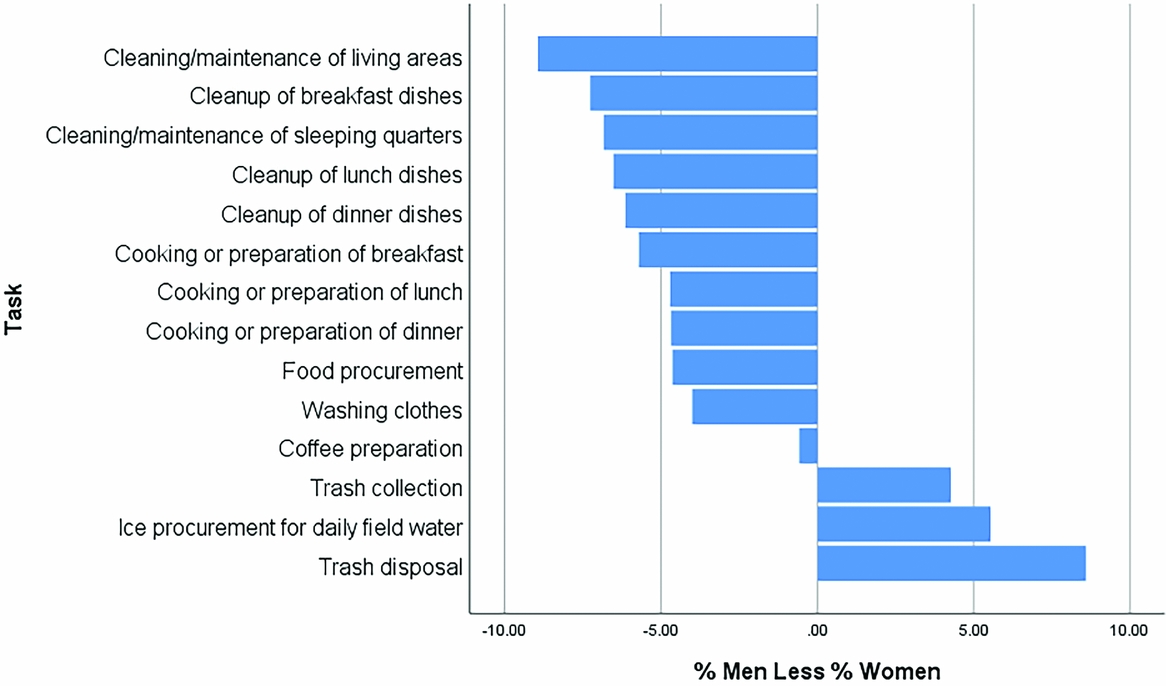
The SEAC SHS data also were used to examine relationships between the segregation of tasks by gender to see if student experiences were being structured through the conscious decisions or unconscious biases of field directors. An encouraging finding from this analysis is that everyone, regardless of gender, is expected to perform nearly all tasks. This suggests that opportunities and experiences in student training are not being limited based on gender. The relatively low level of gender bias indicated by the survey is somewhat striking when one considers that sexual harassment and assault still are occurring in these contexts where men and women apparently are being treated as equals regarding opportunities for training. This shows that bias, power, and harassment are connected in complex ways and that progress on one front may not translate into improvement on others. It should be emphasized that while the survey data suggest gender bias in segregation of tasks is minimal in Southeastern archaeology, there are indications that it still is present. When only the percentages of males and females that performed tasks is considered, several tasks are associated more strongly with men or women. When one looks at the difference between the percentages of men and women (i.e., subtract the latter from the former) performing field tasks, many of the tasks more associated with women—curation, cataloging, washing, flotation, and paperwork—are reminiscent of more “traditional” women's roles from archaeology's past (Figure 7). Furthermore, while men (n = 10) and women (n = 11) were more associated with nearly the same number of fieldwork tasks, women were more associated with nearly four times the number of household tasks (n = 11) than were men (n = 3) [Figure 8]). This suggests that women are more likely to act or be expected by some to act as homemakers and caretakers in shared-housing situations associated with fieldwork.
Bar chart showing the difference between the percentage of men and the percentage of women performing on-site field tasks. Note: Negative values indicate tasks more associated with women, and positive values indicate tasks more associated with men.

Bar chart showing the difference between the percentage of men and the percentage of women performing household tasks. Note: Negative values indicate tasks more associated with women, and positive values indicate tasks more associated with men.
We also used the survey data to explore the relationship between the occurrence of sexual harassment or assault and the gender of one's supervisor. The data suggest that the rate of harassment is about the same regardless of the gender of the field supervisor, but assault is slightly more common on male-directed field projects. These differences in frequency of assault experienced under male and female supervisors could have long-term effects on careers. For example, if women are dropping out of the field after 6–11 years of experience, they are leaving about the time they would be promoted to supervisory positions. As a result, males maintain a supervisory position, possibly resulting in higher assault rates on male-directed projects. Additionally, fieldwork is a key component of mentoring in archaeology. The SAA task force that examined discrepancies in female and male grant submission rates specifically cited mentoring as a key factor in submission rates. Further, the task force showed that men were more likely than women to collaborate on grant submissions. Many of these collaborations are likely a result of shared field experiences. If women are being harassed and assaulted in the field, this may adversely impact their likelihood to collaborate.
Suggestions for Change
Our results tell us that gender-based harassment in Southeastern archaeology is something that must be dealt with head-on. As in other fields, taking steps to ensure equitable workplace opportunities, equal pay, and so forth, are important to ensuring the fair and just treatment of professional women, but they do not appear to be sufficient to fully counteract a culture that tolerates any level of harassment or assault, much less the high levels reported in our survey. Since presenting and publishing the preliminary results of the SEAC SHS, we have formally and informally consulted with colleagues to discuss strategies for tackling this issue. For example, following the recommendation of the SAFE survey (Clancy et al. Reference Clancy, Nelson, Rutherford and Hinde2014), we suggest that field projects adopt formal codes of conduct that include the definition of gender-based harassment and assault and clear policies for reporting and responding to such incidents. At the time of the SEAC SHS, the majority of respondents did not report an awareness of sexual harassment policies or codes of conduct, nor awareness of a mechanism for reporting harassment or assault. In consultation with human resources and/or equity and compliance offices in university or business settings, field directors can compose clear and concise codes of conduct for distribution to students, volunteers, and employees (Supplemental Text 1). One proposal currently under consideration by the SEAC Task Force on Sexual Harassment and Sexual Assault is the creation of a code of conduct template for use by the membership to encourage its widespread adoption and implementation. Other strategies under examination by the task force and the SEAC board include an information campaign about sexual harassment and a website about resources for victims of sexual harassment.
A second strategy to combat sexual harassment and assault in archaeology is the implementation of “dry” field programs. Numerous studies have demonstrated a link between alcohol consumption and gender-based harassment in the workplace and in college (e.g., Abbey et al. Reference Abbey, Zawacki, Buck, Clinton and McAuslan2001; Bacharach et al. Reference Bacharach, Bamberger and McKinney2007; Krebs et al. Reference Krebs, Lindquist, Warner, Fisher and Martin2007). Some of these incidents have recently resounded in the news, including high-profile cases at universities across the country (e.g., Brown et al. Reference Brown, Hendrix and Svrluga2015). Especially in field school settings, where many students are under the legal drinking age, firm rules regarding the use and abuse of alcohol may significantly impact the rate of harassment and assault in the field. Nakhai (Reference Nakhai2017) examined field safety for female archaeologists working in the Middle East and North Africa, and 58% of her respondents indicated that drug and/or alcohol abuse was a problem with excavation culture. It is worth noting that despite the perceived pervasiveness of drinking culture among archaeologists, a proposal for dry field schools was met with applause during the forum “Addressing Sexual Assault and Harassment in Archaeology” at the 2016 SAA meeting in Orlando, Florida.
Third, and among strategies already implemented, we can encourage our professional organizations to adopt clear and public statements regarding appropriate behavior for archaeological practice. While the suggested codes of conduct for field schools spell out acceptable behavior for primarily undergraduate students, statements by professional organizations set the standard for professional archaeologists. Last year, for example, the membership of the SAA (2016) voted to adopt an addition to its list of principles of archaeological ethics entitled “Principle No. 9: Safe Educational and Workplace Environments.”
Archaeologists in all work, education, and other professional settings, including fieldwork and conferences, are responsible for training the next generation of archaeologists. Part of these responsibilities involve fostering a supportive and safe environment for students and trainees. This includes knowing the laws and policies of their home nation and institutional workplace that pertain to harassment and assault based upon sex, gender identity, sexual orientation, ethnicity, disability, national origin, religion, or marital status. SAA members will abide by these laws and ensure that the work and educational settings in which they have responsible roles as supervisors are conducted so as to avoid violations of these laws and act to maintain safe and respectful work and learning environments.
Principle 9 did not pass unanimously but it was overwhelmingly approved (Tobi Brimsek, personal communication 2017). While we laud this step by SAA, we also note that significant levels of gender-based harassment and assault continue to occur in fields where federal, state, and university policies explicitly forbid them (St. John et al. Reference St. John, Riggs and Mogk2016), indicating that other forms of professional censure (e.g., dismissal from the Register of Professional Archaeologists) may be an important ancillary deterrent (Drexler Reference Drexler2016).
As Southeastern and other archaeologists continue to think critically and creatively about strategies to combat sexual harassment and assault within our discipline (for examples from geosciences, see Marín-Spiotta et al. Reference Marín-Spiotta, Schneider and Holmes2016), it is past time that we acknowledge that this is a problem. Moreover, gender-based harassment faced by women represents only the tip of the iceberg. Our data show that men also face harassment and assault, albeit at lower levels than women. To our knowledge, no survey within archaeology has addressed how sexual harassment and assault is differentially experienced by people of color within the field, but a recent study of harassment in astronomy and planetary science indicates that we must take steps to address this (Clancy et al. Reference Clancy, Lee, Rodgers and Richey2017). Our survey did collect data on respondents’ race and ethnicity. Those respondents who reported non-white identity made up a 9% of the total respondent population, reflecting archaeology's overwhelmingly and disproportionately white membership. Despite these low numbers, these individuals experienced harassment and assault in large numbers: 55% harassment and 13% assault. Individuals who did not identify as heterosexual accounted for 13% of the respondent population; of these, 53% had experienced harassment and 14% assault. Anecdotal reporting and the results of the California survey indicate that harassment and assault is particularly problematic for transgender archaeologists (VanDerwarker et al. Reference VanDerwarker, Brown, Gonzalez and Radde2017a). Radde's (Reference Radde2017:2) analysis of the California survey data showed “every transgender respondent experienced some form of harassment, and 84% of those that do not identify as heteronormative also experienced harassment” (emphasis in the original). As Gonzalez (Reference Gonzalez2017) states, the focus on white cis-gender individuals in these surveys “may not reflect the magnitude of harassment that happens.”
Importantly, we need more data. Two surveys of two archaeological societies fairly comparable in size (SEAC about 1,200 members; SCA about 1,600 members) have documented high rates of harassment and assault in all types of archaeology. This is alarming and should prompt us to identify how widespread this problem is. We stress that our study overwhelmingly found that those likely to be harassed and assaulted were those without power; that is, students and field technicians. The data also show that those who are harassed and assaulted are women who have been in the field 6–11 years and who are likely to change their career trajectory as a result of harassment and assault by leaving the profession. This further suggests that the prevalence of sexual harassment and assault explains the lack of gender equity and lack of fair pay in academia and CRM.
To more clearly identify the effects of harassment and assault on individuals within our discipline and on the discipline as a whole, we need to be able to track membership over time and determine who is dropping out of our profession, why, and when. We need to be able to compare rates of harassment by region and over time; spatial and temporal analysis is something archaeologists are very good at. In order to do that, we need more regional survey data from other parts of the United States and the Americas. Finally, we need a survey of sexual harassment and assault of multiple archaeology organizations, including the SAA. Without such data, we risk a lot. First, we risk losing our members. This has long-term consequences. The future of our organizations obviously depends on attracting and retaining members. Second, and as important, we risk losing a diversity of ideas that would enable us to more completely reconstruct the past. The work of scholars such as Joan Gero (Reference Gero, Nelson, Nelson and Wylie1994; Gero and Conkey Reference Gero and Conkey1991), Meg Conkey (Conkey Reference Conkey and Wright1996; Conkey and Spector Reference Conkey and Spector1984; Gero and Conkey Reference Gero and Conkey1991), and Cheryl Claassen (Reference Claassen1992, Reference Claassen1994, Reference Claassen2016) has shown us some of what may be missing from our interpretation of the past by excluding women from the profession.
In sum, the SEAC SHS survey has definitively answered several of our preliminary questions (Meyers et al. Reference Meyers, Boudreaux, Carmody, Dekle, Horton and Wright2015:24): yes, sexual harassment and unwanted sexual contact occur in Southeastern archaeology; yes, harassment affects respondents’ careers and may reduce the number of female archaeologists; and no, reporting structures and policies of conduct do not normally exist. In the time between submitting this article for review and receiving the reviews, national events refocused many professions on the prevalence and damage of sexual harassment and assault in the workplace, and more broadly, in society. In the months following multiple sexual assault accusations against several well-known media figures, #MeToo was used over 1.7 million times on social media by mostly women to chronicle their abuse. Archaeology is in a position now to be at the forefront of this movement and make positive changes to its profession. Armed with the knowledge gained from this survey and analysis of its results, we—especially those in positions of seniority (Diniega Reference Diniega, Tan, Tiscareno and Wehner2016; Wood Reference Wood2015)—must now take action to protect vulnerable members of our community and ensure that the practice of archaeology emphasizes not only investigation and preservation of the past, but also safety of and respect for all members of our profession.
Acknowledgments
The authors thank all the respondents who took the survey and shared their experiences with us, as well as all the individuals who have reached out to us after the initial publication of results with their numerous stories. We are inspired by their tremendous perseverance. We thank the Executive Committee of the Southeastern Archaeological Conference for permission to design and execute the survey and analyze and publish the results. Dr. Kirsten Dellinger, Chair, Department of Sociology and Anthropology, University of Mississippi; and Dr. John Green, Director, Center for Population Studies and Professor, Department of Sociology and Anthropology, University of Mississippi, are thanked for their assistance in designing the survey. We thank Shane Miller for providing the text for a sample Title IX statement for field school syllabi. ACRA granted us permission to use their employment categories for the survey. Kathryn Clancy, Robin Nelson, Julienne Rutherford, and Katie Hinde gave permission to model our survey after the SAFE survey, and they supported us by answering many questions promptly. We thank the five reviewers whose suggestions greatly improved the manuscript. Gordon Rakita suggested revisions to the correspondence analysis figures that we very much appreciate. Thank you to Jose Zapata and Lacey Carpenter for translating the abstract into Spanish. The Qualtrics software and survey were hosted by the University of Mississippi. The University of Mississippi Institutional Review Board approved the survey (Protocol #15x-021).
Data Availability Statement
Electronic data of survey questions and results are stored at the Southeastern Archaeological Conference website (https://www.southeasternarchaeology.org).
Supplementary material
To view supplementary material for this article, please visit https://doi.org/10.1017/aap.2018.23
Supplemental Figure 1. Correspondence analysis of household tasks by who performed them (everyone, mostly men, or mostly women).
Supplemental Text 1. Suggested Title IX Wording for Field School Syllabi.
Supplemental Table 1. Age of Respondents by Gender.
Supplemental Table 2. Highest Degree Earned by Gender.
Supplemental Table 3. List of Tasks for the Questions “How gender-segregated was your field site?” (Q40) and “How gender-segregated were the domestic activities at your field site?” (Q41).
Supplemental Table 4. Frequencies of Harassment and Assault by Age of Respondent.
Supplemental Table 5. Frequencies of Harassment and Assault by the Number of Years Identified as an Archaeologist.
Supplemental Table 6. On-site Tasks Associated with Fieldwork by Who Performs Them.
Supplemental Table 7. Housing Tasks Associated with Fieldwork by Who Performs Them.
Supplemental Table 8. Experience with Harassment and Assault by the Gender of Supervisor.
Supplemental Table 9. Age of Respondents by Gender.
Supplemental Table 10. Number of Years Respondents Have Identified as an Archaeologist by Gender.