THE CHALLENGE OF COMMUNICATING WITH THE PUBLIC
One of the greatest challenges many scientists face continues to be the question of how to meaningfully engage with the public. The National Science Foundation states one of the major objectives of the scientific community as “engaging citizens in research [to] help increase public understanding of science and the scientific process itself” (2018). Archaeology is not immune to these challenges; it is difficult to describe findings to the public based on artifact patterns, extensive excavation, or a piecemeal material record in a way that is engaging and exciting. When we do not adequately educate the public, however, consequences can be extreme: site looting and destruction (e.g., Borck Reference Borck2016; Keeler Reference Keeler2016) as well as faulty appropriation of archaeological narratives to match, for example, political agendas (Livingstone Reference Livingstone2017). In the United States, misunderstandings of archaeological research have led to congressional investigations into the misuse of federal funds (Mervis Reference Mervis2014). A less newsworthy lack of general knowledge surrounding the relevance of archaeology/heritage can lead to a hostile climate surrounding archaeological work, which has been considered an unnecessary financial and logistic burden for construction companies (Slowey Reference Slowey2017) or, more recently, the United States government (Executive Order No. 13792, 2017).
Without understanding the scientific value of sites, artifacts become mere trinkets with a monetary or souvenir value (Mozingo Reference Mozingo2014). Placing artifacts into larger narratives is essential to help the general public understand that every archaeological site is part of a much larger picture constituting the shared past. Similarly, archaeological narratives have often found themselves hijacked by tellers of alternative “history” when poorly communicated (Ghose Reference Ghose2015; Hansen Reference Hansen2002) or maliciously manipulated in an inconspicuous way to confound the general public. From misinterpretation of archaeological findings and nationalistically driven agendas appropriating archaeological cultures to particular ethnic identities (Galaty and Watkinson Reference Galaty, Watkinson, Galaty and Watkinson2004), the history of archaeology is littered with examples where better communication of our work and a higher level of understanding among the public could have prevented—or at least hindered—many cases of misuse of archaeology.
Here, we argue that the use of new technologies can facilitate communicating archaeological findings to the public, and then we demonstrate how to communicate those findings for better archaeological literacy. Furthermore, like any advanced statistical or computational approach, the literacy in these methods is important to ensure that models are used appropriately. Consequently, this article, the last in our three-part series on agent-based modeling, provides a step-by-step training in the basic understanding of simulation: how to use it in one's work and how to communicate the results to the public.
New Digital Technologies Make Communication Easier
It is now difficult to imagine how communication and public exploration of archaeological research can be achieved without the help of new digital technologies. As society moves toward an ever-increasing reliance on technology, many institutions follow suit. Universities and other educational establishments are adjusting their philosophy of teaching to incorporate more multimedia approaches (Schrader and Rapp Reference Schrader and Rapp2016). Museums have always been on the forefront of interactive and informative use of visual technologies (Parry Reference Parry2010), and even Twitter has been an effective tool in disseminating research to a broader audience (Kapp et al. Reference Kapp, Hensel and Schnoring2015; Richardson Reference Richardson2015). In the changing landscape of communication technology, we need to be able to give hands-on demonstrations of the importance of archaeological information to the public in addition to the rich site descriptions we already provide. Furthermore, with increased connectivity exponentially multiplying the quantity of information available to consumers, the competition between content has become fierce, making the task of reaching the general public even more challenging. How can archaeology compete with memes, catchy videos, and Ancient Aliens?
In Parts 1 and 2 (Romanowska et al. Reference Romanowska, Crabtree, Harris and Davies2019; Davies et al. Reference Davies, Romanowska, Harris and Crabtree2019) we have shown how to create a simulation that examines the distribution of artifacts on the landscape. In Part 1 we developed a neutral model of lithic raw materials; this model is a replication of the foundational model by Brantingham (Reference Brantingham2003). In Part 2 we demonstrated how to build this model on a realistic landscape on Catalina Island, California. By building this model on a realistic landscape, we can assess whether the modeled output meets reality; if we compared the data to real archaeological data, we could examine various strategies, such as embedded procurement (Binford Reference Binford1979). It is in the output of data and its comparison to the archaeological record that enables building understanding from modeled inference.
In this third entry in our series on agent-based modeling, we continue these themes by using agent-based modeling as a tool for outreach. First, we explore how agent-based models, or ABMs have been used effectively for outreach in other disciplines, and how they can be used in museums to illustrate and supplement archaeological narrative. Next, we suggest how ABMs can be packaged to be used for SHPO and THPO (State Historic Preservation Office and Tribal Historic Preservation Office) reports, and for public archaeology, specifically focusing on museum exhibits and as teaching tools for school programs. Finally, the reader is encouraged to take the step-by-step tutorial on model validation and visualization showcasing how to incorporate ABMs in different types of archaeological information and dissemination. This tutorial builds upon the first two tutorials presented in the supplemental materials of Parts 1 and 2, and will take approximately two hours to complete. It is our aim that these tutorials will provide the basis for readers to use simulation in their own work.
ABM AS A TOOL FOR OUTREACH
Agent-based modeling is one way in which to demonstrate to the public the importance and relevance of artifacts, sites, and archaeology at large. The potential of this digital tool lies in the following three characteristics: 1) ABMs are visual and gamelike; 2) ABMs convey a narrative—a dynamic story—rather than a description; and 3) ABMs encourage active participation and give the power to test and shape this narrative to their users. Below, we explore these three features in more detail.
Agent-Based Modeling Is Visual and Gamelike
To most users, the most appealing aspect of ABMs is their visuality. As most modelers will confirm, watching agents move across the screen getting on with their daily tasks can be mesmerizing (Kornhauser et al. Reference Kornhauser, Wilensky and Rand2009). Similarly, observing how individual actions of many agents lead to counterintuitive or surprising population-level patterns is often a trigger for instant “eureka moments.”Footnote 1 These are the types of reactions that will keep the members of the public engaged and that show the general public the wider societal value of archaeological inquiry. In short, the visual appeal of ABMs can grab users’ attention, making them care about artifact patterns or the spatial distribution of sites as well as our work aimed at explaining these patterns.
Agent-Based Models Show Processes That Directly Convey Archaeological Narratives
Agent-based models can help illustrate how specific patterns came to be and, in this way, they can form visual narratives. ABMs show both the process—the agents forming families, trading, farming, or engaging in war—and the population-level repercussions of these actions, which translate into patterns in the archaeological record. Therefore, models demonstrate how artifacts that in isolation can be easily discounted as “unimportant” form part of a much wider social or socio-natural phenomenon. The public does not need to believe our word that a scatter of pottery sherds is important evidence of past human interactions. They can see it for themselves as agents make, use, and discard pots across the landscape.
Give the Power to the People: Let Them Try Models and Discover Things for Themselves
The interactive nature of ABMs make them useful for individual discovery. Are you curious what would happen if you doubled the number of agents? Or if you introduced a new good to trading markets? Or how the agents would respond to a natural catastrophe? Giving the model to members of the public as well as stakeholders enables them to examine different values of parameters and the way these values change the output of the model (thus, how closely the model reflects the reality of the archaeological record). This feature of ABMs can be an important consideration in the “post-factual” world where the word of an expert ceases to be imperative, since individuals can easily assess the veracity of claims through reproducible science.
AGENT-BASED MODELING AS A TOOL FOR COMMUNICATION WITH STAKEHOLDERS
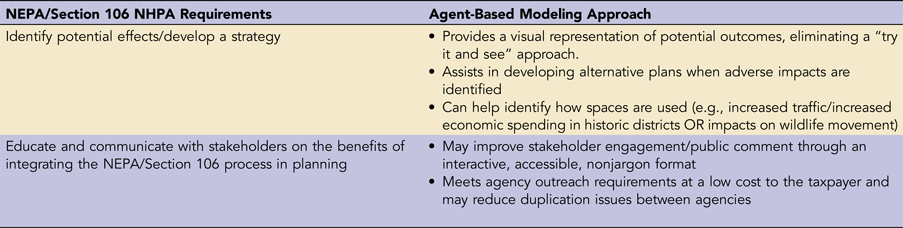
ABMs can also serve a useful purpose: integrating data collected by field archaeologists and the large body of data managed by State or Tribal Historic Preservation Offices (SHPO/THPO) into a coherent, formal, well-defined, and replicable narrative, as explored in Table 1.
TABLE 1. NEPA and Section 106 NHPA Requirements and Potential Solutions Offered by an Agent-Based Modeling Approach.
Cultural resource managers (CRMs) in the United States assess the “significance” of the sites they document and so determine whether that site may be actively or passively preserved for the future or any known future effects mitigated. This assessment of significance often rests on whether there are diagnostic artifacts (such as Clovis points) recovered at the site, intact hearth features, architectural elements, or other region- and period-specific cultural detritus recovered. Sites that are not considered significant often include lithic scatters, pottery scatters (with no visible architecture), and historic trash scatters.
One of the promises of agent-based modeling techniques is the ability to look at archaeological remains at a landscape level, which enables the placement of artifacts and features into a larger context. While predictive modeling tools are the standard for the types of modeling that US agencies call for, expanding the toolkit to other approaches that can enable hypothesis testing and experimentation from stakeholders may provide a second prong in understanding the significance of sites in a larger landscape context.
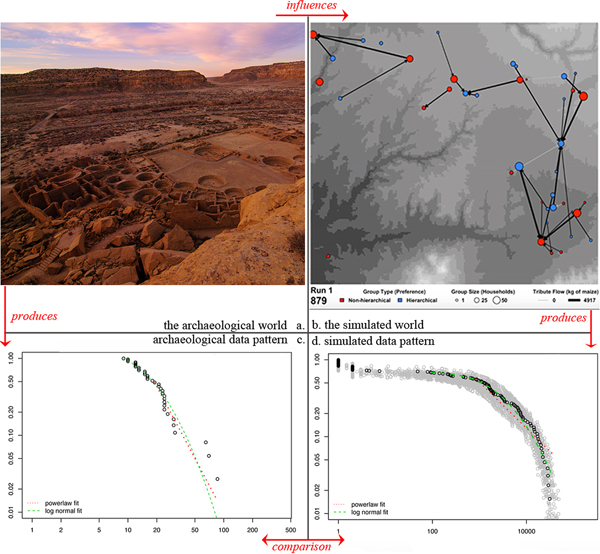
ABMs can take advantage of even the most fragmented and uncertain archaeological data because they test our conceptual models against the existing archaeological record instead of building conceptual models upon the available data. For example, Crabtree et al. (Reference Crabtree, Kyle Bocinsky, Hooper, Ryan and Kohler2017) used an agent-based model to examine the development of hierarchy in a region where some of the only supporting evidence for hierarchy comes in the form of architecture. Figure 1 illustrates how they compared data between the model (where they could witness the formation of hierarchies) and the archaeological record (where monumental architecture suggests hierarchies) thereby examining the conditions that lead to hierarchical societies as well as the circumstances that lead to their breakdown.

FIGURE 1. Comparing simulated data to archaeological data. In Crabtree et al. (Reference Crabtree, Kyle Bocinsky, Hooper, Ryan and Kohler2017) they examined how territoriality could lead to the formation of multisite hierarchies among the Ancestral Pueblo: (a) output from the simulation with red and blue center points for groups. The size (number of households) of each group is relative to the size of the circle. Within the simulation, there is a dynamic for groups to elect a leader (red dots) or remain leaderless (blue dots). The arrows point toward the group that is higher in the hierarchy. In the simulation, we know which groups end up at the top of a territorial hierarchy and their relative size. We can then look at the size of the settlements/territories and analyze the distribution of these sizes (b). Here, we see whether they conform to a power law or a log-normal distribution. This same analysis is computed for the size of settlements and the size of kivas within the southwest, including Pueblo Bonito (c) in Chaco Canyon, with results from this analysis to the right (d). This figure shows how an inference about the archaeological record (hierarchy) (a) can lead to the development of a model (b). We then can build quantitative models on the data (c and d) and compare those to each other (i.e., b to d, which then can advance an argument in a formal, testable fashion).
The second major advantage of ABMs is that they easily incorporate uncertainty and coarse graininess of the data. The example in Figure 1 shows the importance of archaeological data in the modeling process. It is a common misconception that there is an inherent opposition between field archaeology and archaeology done “in a computer” (the so-called “in silico” research). In fact, the two are mutually beneficial. Better data can lead to a more detailed validation stage. Better models may also inform our data sampling strategies, for example, by pointing out where to focus fieldwork in order to answer a specific research question.
Thus, agent-based models provide a systematic approach to testing conceptual models (Romanowska et al. Reference Romanowska, Gamble, Bullock and Sturt2017); they can be easily packaged and digitally sent to SHPO and THPO offices, which can examine the results obtained from the model. The archaeological data can be compared against distributions in the model to enable a better description of the findings and to allow the SHPO and THPO offices to examine multiple strategies to test the validity of our outcomes and develop future research strategies accordingly.
In sum, agent-based modeling has the potential to make deliverable computer simulations that can be used to convey the importance of science, of survey/excavation, of documenting and of preserving archaeological sites, and of protecting the cultural heritage of the country in a fun and engaging way. They can also be used to present field research to SHPO and THPO offices, thereby contributing to building integrated regional frameworks.
AGENT-BASED MODELING AS A PEDAGOGICAL TOOL
Simulations can be used as a teaching tool to enable a better understanding of complex systems. For example, modeling predator-prey relationships through a set of coupled differential equations may be mathematically elegant but can be difficult to understand for a beginning ecology student. Wilensky's Wolf Sheep Predation model (Wilensky Reference Wilensky1997) takes the coupled differential equations and turns them into an easily manipulated computer model (Figure 2). In this way, students can not only study the Lotka-Volterra equations, but they can also see how the abundance of consumers and producers fluctuates through time. StarLogo, a programming language which gave rise to the commonly used program NetLogo, has been similarly used to convey the concept of self-organization (for example, of ants), feedback loops (in ecology) and leaderless organized systems (for example, among flocking birds) to schoolchildren (Resnick Reference Resnick1994).
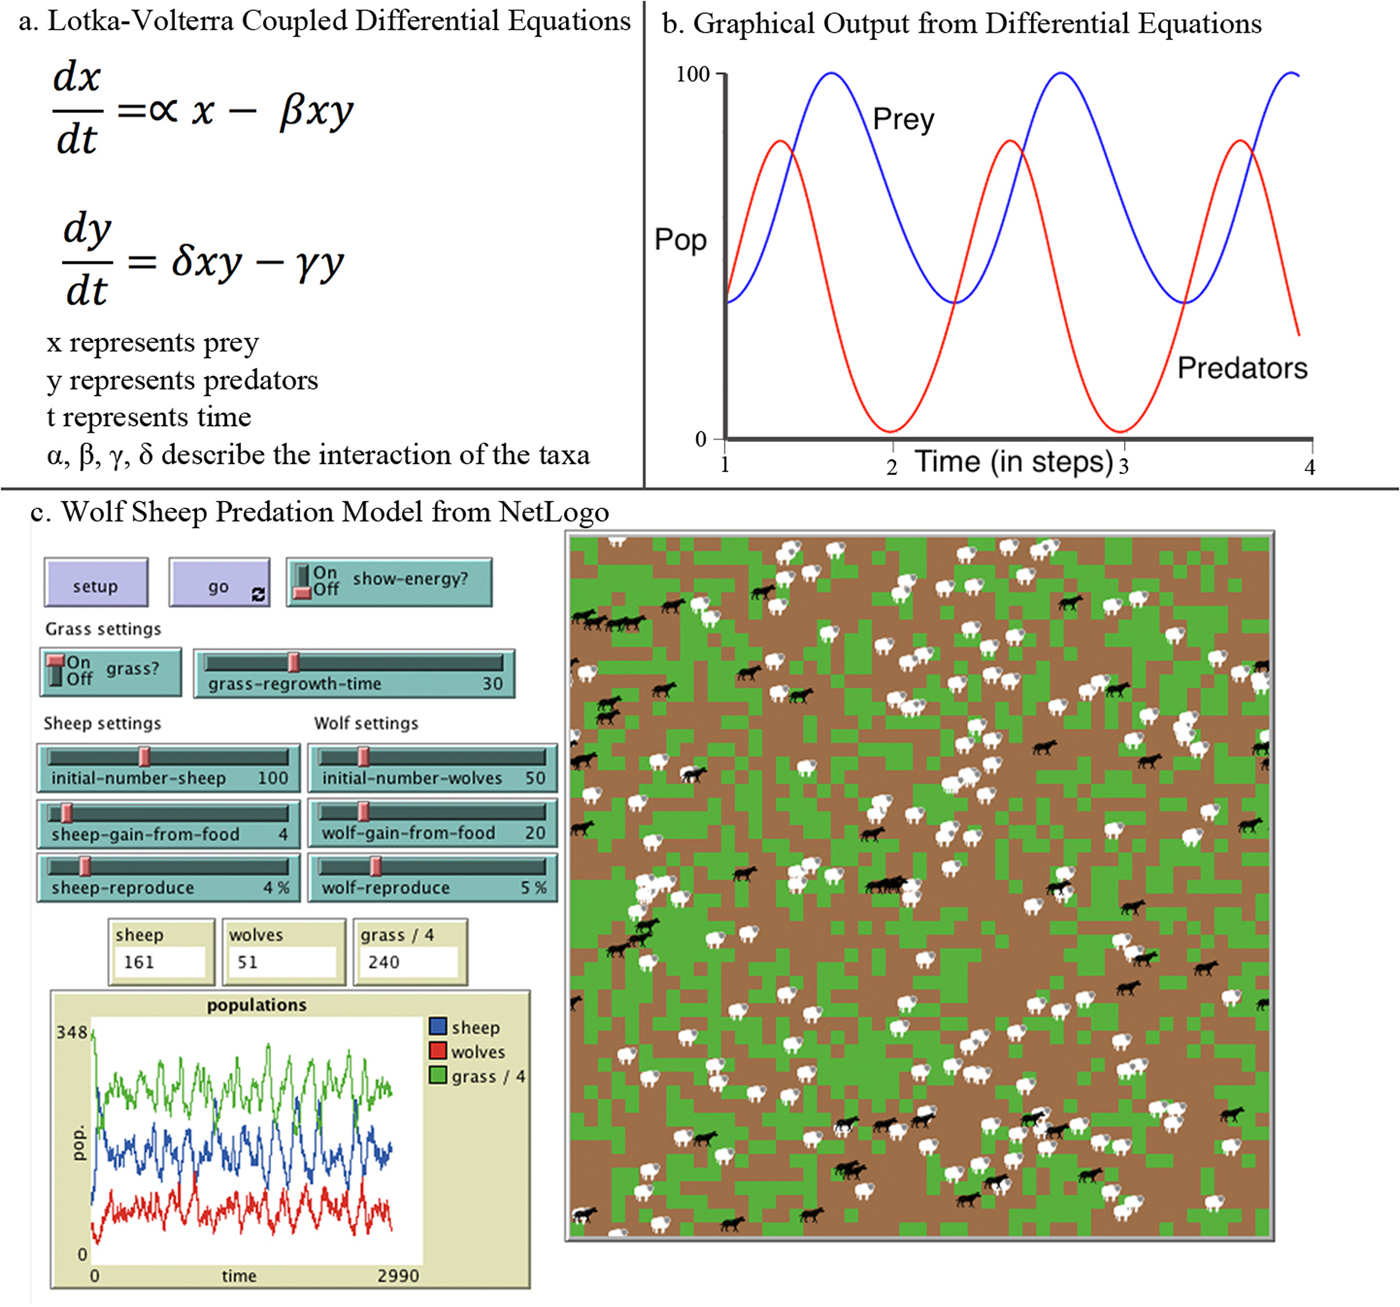
FIGURE 2. Comparison of coupled differential equations to the output of the Wolf Sheep Predation Model in NetLogo: (a) coupled differential equations, which demonstrate how predators and prey interact over time; (b) the graphical output from (a), produced using Nøva Online, demonstrating the oscillation in population sizes of prey (red) and predators (blue) over four observational periods; (c) ABM of the same system; note the graph on the lower left in (c) shows a similar oscillation pattern as above in (b) but for more timesteps, while the user can watch the lower right and see the physical increase and decrease of sheep and wolf agents. The model allows the user to manipulate the initial number of wolves versus sheep to determine if grass will stay static or die and regrow when eaten. This simulation enables the user to understand the complex mechanics of the Lotka Volterra model with a few clicks of a button, thereby teaching fundamental principles of ecology in an interactive environment.
In a similar vein (but applied in a different discipline), Hart and Case (Reference Hart and Case2018) use the famous Schelling (Reference Schelling1969, Reference Schelling1971) segregation model to illustrate how individual agents’ preferences can lead to system-wide patterns. In particular, the model focuses on the rise of spatial segregation emerging from personal preferences for neighbors similar to oneself. The simulation shows how when an individual prefers that even 30 percent of their neighbors look the same as they do, neighborhoods will segregate, illustrating how small individual bias can have negative population-wide consequences.
In museum contexts, simulations have been effectively used to educate the public. For example, at The Exploratorium in San Francisco, “The Survival Game,” developed by Lee Cronk and colleagues, is an effective way to teach the public about cooperation versus altruism. It is a risk-pooling game simplifying Cronk's work on Maasai herding practices (Cronk Reference Cronk, Turner, Machalek and Maryanski2015). In this game, individuals choose how many livestock to invest in, with a stochastic environment as the background influencing herd numbers. By playing the game of sharing certain amounts of meat, users can watch which strategies are the most successful for survival. This gives a hands-on learning experience that is much more effective than lengthy descriptions.
The long-running Village Ecodynamics Project agent-based model “Village” has also been featured in museum exhibits, although without the hands-on application. At the Field Museum in Chicago, an exhibit on Ancestral Pueblo lifeways used the case study of the Village simulation to illustrate how modeling can help illuminate the past. Another interactive website, veparchaeology.com, highlights the utility of agent-based modeling in helping refine hypotheses about the past, and it was explicitly designed for public engagement. These two examples serve to illustrate how computational tools can be effectively deployed to explain complex subjects to interested members of the public.
HOW TO USE AGENT-BASED MODELS TO COMMUNICATE COMPLEX CONCEPTS
In the supplemental tutorial we walk readers through how to take the results from the model begun in Part I (Romanowska et al. Reference Romanowska, Crabtree, Harris and Davies2019), enhanced in Part II (Davies et al. Reference Davies, Romanowska, Harris and Crabtree2019), and finished in this publication (Part III) and communicate them to the public. Borrowing from the field of public health, we follow “Considerations and Best Practices in Agent-Based Modeling to Inform Policy” (Hammond Reference Hammond, Wallace, Geller and Ogawa2015) and adapt this methodology to the archaeology-specific audience. Hammond suggests that a challenge is working between parsimony and realism, and that to create the best models, one must build complexity up from the most understandable and simple models. Within public health, this is a challenge, as studying the spread of epidemics and pandemics may seem to require the highest realism possible; however, the ability to simplify models to their core processes provides not only the most parsimonious explanation but also the greatest ease in communicating results to the public. This lesson can be applied to archaeology, where we may want to include as much realism as possible, but the most parsimonious explanation may in fact simplify many exogenous variables. Here, we follow the last three steps of Hammond's methods (Best Practices 13–15), which correspond to the steps for communicating the model to the public, but each of the Best Practices are worth considering for model design and implementation (see Hammond Reference Hammond, Wallace, Geller and Ogawa2015 for details).
Step 1: Identify the Audience
A first step is identifying the “public” to which the model will be communicated. In archaeology, this may be SHPO/THPO offices, oil and gas firms, or attendees at a museum. While the model may not change, communication strategies likely will. For example, communicating a model to a THPO would require less context on the culture being modeled, whereas communicating that same model to oil and gas firms would require greater context. This step is especially important when writing up the description of the model to be delivered to stakeholders (Supplemental Text 1, section 3.3).
As a model designer, one needs to ask, “What does my model convey?” Then, one needs to describe each step in as much detail as possible. This is explained in the Supplemental Text 1, section 3.3 “Packaging your simulation for public consumption.” Here, the model designer must go through each of the headings and describe the purpose of the model in detail, as well as how to use each of the buttons and sliders to run the model. It is a good practice to keep the audience in mind in this step. Too much detail will bore the audience, while too little detail will leave the audience perplexed.
If the model in question is going to be used to communicate to different “publics,” it is a good idea to tailor the model to those specific needs. This may include simplifying some of the interface or making certain “fixed” parameters toggleable by the user. We do this in section 3.1 of Supplemental Text 1, where we create a stop condition. This condition is written here as a toggleable switch, but it could instead be hard-coded in for certain audiences. In the end, it is important to identify who will be using the model and what key differences will be needed to tailor that model to that specific audience.
Step 2: Run a “Sweep” of the Simulation
Although running a simulation once and watching the plots change over time is a useful exercise in understanding the basic model dynamics, there is randomness in simulations, so scientific research can only be explored when using averages of multiple runs. These multiple runs are called a “sweep” or a “sensitivity analysis.” By running a sweep and examining the central tendencies (averages) of values from multiple runs, researchers can account for error and “noise,” demonstrating the true dynamics of the model. This step is especially important for demonstrating confidence in results. In the tutorial, we do this by using the native BehaviorSpace exporting function (Supplemental Text 1, 3.2).
Step 3: Design Clear Visuals for the Appropriate Audience
Once the audience is determined, then both the design of the figures and graphics as well as the communication of results are undertaken. We want to ensure that we are not only communicating the results accurately but that we are doing so with the clearest language and the easiest-to-read visuals possible. In the tutorial (Supplemental Text 1), we do this by creating plots of toolkit richness that average across timesteps to reduce noise and show trends through time. While it may be technically more accurate to map every possible datapoint from the simulation, when we create graphics for reports, we often average across datapoints from real archaeological data to show, for example, the average number of flakes per meter. Here, we do the same exercise, but with the simulated results.
In the interest of clarity, we also want to ensure that uncertainty around our results is communicated (Hammond Reference Hammond, Wallace, Geller and Ogawa2015, p. A-21). For example, if we were building an agent-based model where agents choose to build their settlements in certain locations, we would want to suggest looking for settlements with certain features (e.g., within 20 meters of a body of water) instead of within an exact x,y location. This would communicate the uncertainty around the modeled results necessary to communicate clearly. This exact problem is undertaken by Kohler and colleagues (2012) who examine the goodness-of-fit between real and simulated archaeological settlement locations.
Step 4: Consider Linking Models and/or Results with Other Methods
Agent-based models are only one additional tool in an arsenal of tools that can help to understand processes of the formation of the archaeological record. We could use the initial model of lithic stone tool procurement to ask multiple questions, using many iterations of the same model, yet linked together, to give greater evidence to the importance of landscape-based approaches in archaeology. In tutorial 2 (Part 2 supplemental material), we also explicitly link our agent-based model to a real GIS landscape. This can enable better communication of results because the model is run on a real, tangible landscape. In this way, we can integrate our simulation methods with other methods used in heritage management, such as site-location models, to truly assess the plausibility and accuracy of other methods and further refine our understanding of prehistory.
This step is also particularly powerful as we move toward using more digital tools for understanding archaeological sites. As researchers begin to think about using agent-based models to bolster their findings, linking these models with existing models will only enhance our understanding of prehistory.
To sum up this section, the best practices for communicating results to the public include identifying the public(s) for which the model will be packaged, designing clear visuals that communicate the certainty/uncertainty of the modeled results, and linking models to other models or other types of data. Following these three processes, as well as following the how-to steps in Supplemental Text 1, will deliver a well-packaged model that can enhance our understanding of the archaeological landscape.
CONCLUSIONS
The call for more ABMs has been repeatedly voiced in a number of scientific disciplines, particularly those dealing with humans. For example, economists have recently recognized the potential for ABMs to counteract the key assumptions of neoclassical economics; that is, the rationality and perfect knowledge of the modeled agents—a major source of criticism of economic models (e.g., Axtell Reference Axtell2015; Farmer and Foley Reference Farmer and Foley2009; Hamill and Gilbert Reference Hamill and Gilbert2015). Napoletano and colleagues (Reference Napoletano, Gaffard and Babutsidze2012) outline how Dynamic Stochastic General Equilibrium models (DSGE) failed to predict the 2008 economic crash, and how ABMs can be used to predict future economic challenges.
In health science, the study of epidemics has benefited extensively from an agent-based modeling approach (Epstein et al. Reference Epstein, Parker, Cummings and Hammond2008), with researchers unraveling the dynamics of the spread of infectious disease and the impact of different factors, including the connectivity of the potential pathogen-hosts (Tarwater Reference Tarwater1999), different commuting strategies of the population, or the role of self-quarantine (Perez and Dragicevic Reference Perez and Dragicevic2009). Furthermore, agent-based modeling has been successfully used to combat the obesity pandemic and educate policy makers on effective solutions (Hammond Reference Hammond2009). Similarly, sociology (Chattoe-Brown Reference Chattoe-Brown2013) and geography (Heppenstall et al. Reference Heppenstall, Crooks, See, Batty, Heppenstall, Crooks, See and Batty2012) have been exploring the potential of the technique to investigate social and socio-natural phenomena as well as to inform and educate the general public. These examples demonstrate how the use of agent-based modeling can create a better-educated populace that is well-versed in exploring complex subjects, which are otherwise difficult to convey using traditional methods and channels. And while agent-based models can be challenging to communicate (Waldherr and Wijermans Reference Waldherr and Wijermans2013), it is a tool that is increasingly used in the social-science toolkit.
Archaeology could easily take a leaf from the books of these disciplines—the themes, theories, and sometimes even types of data are similar. The gamelike properties of ABMs make them engaging and fun to explore. By enabling the user to modify key parameters and see how different strategies can change the outcome of the spread of measles or of an economic recession, agent-based modeling empowers the user to better understand the nuances of complex phenomena and democratizes access to leading academic research. Similarly, archaeological ABMs could give the general public a better grasp of the historical context of such topical issues as migration, the growth of hierarchies, the impact of climate change on society, cultural transmission, and societal resilience. In this way, agent-based models exemplify the value of archaeological research and its relevance to the societal challenges we face at the moment. We argue that wider use of ABMs has a strong potential to revolutionize not only archaeological research but also outreach and communication.
Supplemental Material
For supplemental material accompanying this article, visit https://doi.org/10.1017/aap.2019.4.
Supplemental Text 1. ABM for Outreach Tutorial.
Supplemental Text 2.
Supplemental Bibliography for Tutorial 3.
Acknowledgments
This manuscript and tutorial have evolved out of a number of ABM workshop courses we have given. We extend our thanks to the many participants who have helped us to develop these materials over the years. The authors declare no conflicts of interest. IR received funding from the European Research Council (ERC) under the European Union's Horizon 2020 Research and Innovation programme (grant agreement n° ERC-2013-ADG 340828). SC acknowledges support by NSF Graduate Research Fellowship DGE-080667, an NSF GROW fellowship, and a Chateaubriand Fellowship. We thank two anonymous reviewers for comments that benefited the manuscript. We also thank Colin Wren and Andre Costopoulos for providing detailed consideration of the manuscript and tutorial materials. Finally, we thank Scott Worman for pushing us to write this series.
Data Availability Statement
DEMs were used to prepare the second tutorial (Davies et al. Reference Davies, Romanowska, Harris and Crabtree2019), and those are available for Part 3. No other data is required for these tutorials. The software used in the tutorial is open access and open source (https://ccl.northwestern.edu/netlogo/).