


Nomenclature
- b
half span, mm
- c
local chord, mm
- C A
axial force coefficient
- C D
drag coefficient
- C D′
reduced drag coefficient
- C N
normal force coefficient
- C m
pitching moment coefficient
- C L
lift coefficient
- LEV
Leading edge vortex
- Re
Reynolds number, dimensionless
- u
streamwise velocity, m/s
- U
time-averaged tangential velocity, m/s
- v
vertical velocity, m/s
- V
time-averaged normal velocity, m/s
- w
spanwise velocity, m/s
- W
time-averaged spanwise velocity, m/s
- x
chordwise co-ordinate, mm
- y
normal to wing surface co-ordinate, mm
- z
spanwise co-ordinate, mm
Superscripts and subscripts
- –
time-averaged value
- α
angle of incidence
- ∞
free-stream value
1.0 INTRODUCTION
Moderately swept wings are widely used in most modern aircraft, especially in manned combat aircraft and unmanned aerial vehicles (UAVs) designed for operation at high subsonic Mach numbers. The flow over these types of swept wings at incidence is characterised not only by separation from the leading edge but also by complex interactions with the secondary vortical structure and wing tip structures. These highly 3D vortical structures can take either a ‘closed’ or an ‘open’ form, depending upon the angle of sweep and the operating conditions.
In the 1950s, active experiments have been conducted on the various swept-back wings. Haines( Reference Haines 1 ) compares the flow patterns over swept wings with a simple design at low Mach numbers, and identifies a few dominant features, namely the part-span vortex sheet, which originated from near the leading edge near the inboard end of the separation and occurred somewhere along the span and not necessarily near the tip. Also, comparisons have been made between the flow over swept wings and that of a 2D aerofoil. Later, flow structures over a tapered swept back wing were investigated at a few higher Mach numbers by Hall and Rogers( Reference Hall and Gogers 2 , Reference Hall and Gogers 3 ). Robert Legendre and Henri Werlé were among the first to analyse flow over delta wings. In the early 1950, Legendre used hydrogen bubbles to visualise the vortices on the delta wings and identified main features including several foci and saddle points. In 1960, Werlé employed impressive flow visualisation to discover that the vortex swirl velocity increases and the concentrated vortex core suddenly expands to become a burst when the wing angle-of-attack is raise. Délery( Reference Délery, Robert and Henri 4 ) summarises their contributions to improve the understanding on 3D separation.
Using stereo particle image velocimetry (SPIV), Ol and Gharib( Reference Ol and Gharib 5 ) compare the flow structure of the leading edge vortex (LEV) between a slender and a non-slender delta wing. It is found that a similar flow field occurs in both cases at low angles of incidences below 10°. However, at higher incidence angles, qualitative differences can be identified, such as no peak axial velocity to identify vortex breakdown and reversed streamwise flow for the non-slender wing. Yavun et al.( Reference Yavun, Elkhoury and Rockwell 6 ) show the surface topology of a delta wing with a moderate sweep using PIV measurements very close to the suction surface. By comparing the time-averaged and instantaneous topology, some coherent features are revealed, such as the saddle point near the wing tip and the bifurcation line adjacent to the leading edge of the wing. Furthermore, the variation of the location of the foci in the instantaneous flow topologies confirms the unsteadiness of the leading edge vortex and complex flow structures.
In addition, these complex flow structures over moderately swept wings are still a challenge for computer simulations( Reference Li and Leschziner 7 – Reference Walker, Hipp and Bons 14 ). For example, Li and Leschziner( Reference Li and Leschziner 7 , Reference Li and Leschziner 8 ) used the large eddy simulation (LES) and a wall function approach to simulate the highly complex separated flow over a swept wing. It was found that only the flow features inboard of 60% of the semi-span could be reproduced, while complex interactions at the wing tip could not. For the same wing model at the same incidence angle, Hahn and Drikakis( Reference Hahn and Drikakis 9 , Reference Hahn and Drikakis 10 ) found that an implicit large eddy simulation is more accurate than hybrid RANS/LES at the region close to the wing tip, but some features of the flow are still different from the experimental data. By combining computational and experimental work, Gordnier et al.( Reference Gordnier, Visbal, Gursul and Wang 11 ) examine the flow structures over a 50-deg-swept plane delta wing at 15°. Further computations are still needed to fully understand transitional or turbulent flow. Although several experimental studies on the flow behaviour around geometrically simple non-slender delta wings at low Reynolds and Mach numbers (Refs 5, 6, 15 and 16)( Reference Bertin 20 ) have been conducted, the flow structures on 3D swept wings are still not fully understood.
A solid 40° swept-tapered wing model with twists and camber was chosen for the present study in order to investigate these complicated topologies of the separated flow over the swept wing, and also to provide a challenging test case for the validation of any future computational models. The flow over the wing was investigated for a range of angles of incidence (from −1° to 22°) and five Reynolds number (Re) values from 2.1×10⁵ (10ms−1) to 8.4 × 10⁵ (40ms−1) based on the root chord and the free-stream velocity. Mach number varied from 0.03 to 0.12.
In the present paper, no attempt is made to discuss the results in quantitative details. Quantitative three-component velocity results over this swept wing at a fixed incidence angle were presented by Zhang et al.( Reference Zhang, Jaworski, Turner and Wood 17 ). In particular, the critical point theory was applied to interpret the flow topology on/over the surface. Series of instantaneous video images were used to provide more accurate information in order to reveal the formation of the leading edge vortex (LEV). Cross-correlation of video images provided not only the direction of the surface skin friction lines but also the approximate values of surface skin friction. Additionally, the complex flow structure at the wing tip region was illustrated and how it is affected by the angle of incidence and Reynolds number. Finally, the flow topology was correlated with the aerodynamic forces and moments to illustrate how the flow structures affect the performance of the swept wing.
2.0 EXPERIMENTAL APPARATUS
2.1 Aerodynamic design of wing model
The 40° swept wing model was intended to have a platform, thickness/chord ratio and pressure distribution, which were reasonably representative of a transonic combat aircraft. The wing had a 40% chordwise rooftop pressure distribution, combined with elliptic spanwise loading and a design lift coefficient of 0.2. Additionally, the camber and the thickness were chosen to give appropriate distributions of the loading, and local lift coefficient, this being achieved by iterative twisting of the aerofoil sections about the straight trailing edge. A basic RAE 102 thickness profile with thickness and chord ratio of 6% was used, in combination with camber lines giving a specified chordwise loading for the local spanwise lift coefficient at the design point. The resulting streamwise pressure distributions at the design condition featured a zero-pressure gradient rooftop to 40% of chord on both surfaces, followed by a linear recovery to the trailing edge.
The full-span wing models were machined from solid aluminium, without a fuselage, to satisfy the constraints imposed by the cross-sectional dimensions of the Avro Wind Tunnel used in this study. Consequently, the wing model had a full span (2b, b being the semi-span) of 650mm, a root chord of 303.3mm and a tip chord of 90.9mm, with a constant 6% thickness to chord ratio along the whole span. This relatively sophisticated wing model was twisted around its straight trailing edge, the variation in twist producing an apparent kink in the leading edge and a 5.33° wash-out angle at the tip. The wing tip was machined parallel to the root chord plane, ending with a semi-circular section across the thickness. The schematic drawing of the swept wing and its parameters are shown in Fig. 1(a) and Table 1.
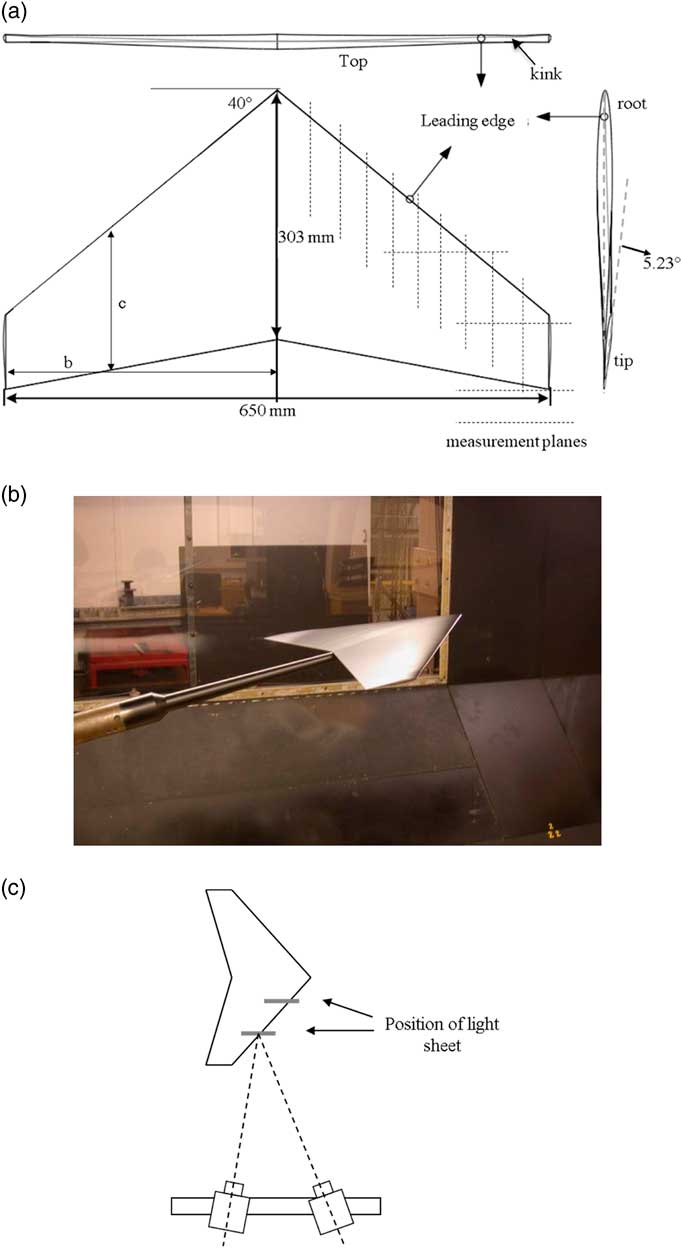
Figure 1 (Colour online) (a) Schematic drawing of the 40° sweptwing model showing selected parameters and measurement planes. (b) Model mounted in the wind-tunnel test section. (c) PIV measurement arrangement.
Table 1 Parameters of the 40° swept wing model

2.2 Details of the wind-tunnel and model support
Experiments were performed in the Avro Wind Tunnel at the Goldstein Laboratory, University of Manchester. The working section of this general-purpose, closed-return wind tunnel is nominally rectangular: 2.7m in width and 2.2m in height. However, corner fillets are used to minimise the secondary flow generation, giving an octagonal cross section with the area of 5.15m². The length of the working section is about 4m. The upstream settling chamber, incorporating a honeycomb and damping screens to optimise the flow distribution and reduce the turbulence levels in the working section, was followed by an inlet contraction with an area ratio of 6:1. This arrangement produced relatively low free-stream turbulence levels, remaining below 1% for velocities in the range 10–60ms−1.
The wing model was supported by a 1.5 m long sting pointing upstream into the flow as shown in Fig. 1(b). The maximum blockage caused by the model is less than 0.5%. The sting was mounted on a mechanical traversing mechanism that could be controlled remotely in pitch, yaw and roll. With this arrangement, the apex of the model was considered to be sufficiently far upstream of the traversing mechanism for any blockage effects associated with the model support to be ignored.
2.3 Oil-film flow visualisation
Oil-film visualisation was widely used to study the flow over surfaces in large wind-tunnel tests. Haines( Reference Haines 1 ) made a range of tests on swept-back wings at high incidence and low Mach number using this technique. Tobak and Peake( Reference Tobak and Peake 18 ) reviewed the theory of the skin friction lines on the surface of the body and its application on 3D separated flow. Later, Délery( Reference Délery, Robert and Henri 4 ) used this critical point theory to interpret a wide range of 3D separated flow phenomena. Using the concepts of skin friction lines, critical points, separation lines and separated sheets the flow topology can be described consistently.
In the present investigation, visualisation of the surface flow patterns was carried out using a mixture of fluorescent paint pigment and paraffin at a ratio of about 1:5. The mixture was painted evenly onto the surface and the tunnel was run at a fixed speed until the paraffin was evaporated or blown off, leaving the flow pattern record.
2.4 The particle image velocimetry system
In order to reveal the development of highly 3D leading edge vortex (LEV), stereo particle image velocimetry (PIV) measurements were employed to provide the information about the flow structures at various cross-sectional planes. The laser light sheet was generated by a 200 mJ double pulsed Nd:YAG Laser which was mounted on a 3D traverse unit.
The stereo PIV measurements were conducted in several spanwise and streamwise planes which intersect and/or downstream of the swept wing model as shown in Fig. 1(a). The stereo PIV system has two 4 Mega pixel PIV cameras which were set up on a bench on one side of the test section as shown in Fig. 1(c). Camera calibrations were undertaken with the aid of a 200 × 200 mm calibration target plate and then optimised using the ensemble-averaged de-wrapped velocity field, a built-in function in the TSI PIV software (Insight 3G). The measurement area was chosen to be 200 × 200 mm2, giving a spatial resolution of approximately 1.63 × 1.63 mm2 with a 32×32 pixel interrogation area and 50% overlap. The uncertainty in the velocity measurement was about 1.5% for in-plane components and 4.2% for the out-of-plane component. PIV velocity vector field was taken by ensemble averaging 500 measurements.
PIV analysis has also been applied to flow visualisations obtained from the video image series, which was taken at 25 Hz using an analogue video camera. The digitised images (512 × 512 pixels) were post-processed to obtain the velocity field on the surface of the half wing model using the TSI Insight 3G PIV software. The viewing area was chosen to be 330 × 330 mm2, using a 16×16 pixel interrogation area with 50% overlap, which gives a spatial resolution of 5 mm in both streamwise and spanwise directions. A detailed procedure can be found in Zhang and Turner( Reference Zhang and Turner 19 ).
2.5 Six components force balance system
An internal six-component sting balance (reference British Airspace No. 46) was used to measure aerodynamic forces and moments. It was inserted into the sting arm downstream of the wing model, and connected the bridge and signal-conditioning amplifier (Instruments group 2310) with the temperature compensation. Due to the distance between the aerodynamic load and the model mounting point, pitching moments and normal force were scaled down to get real value according to the new calibration curve. The forces and moments were obtained by averaging ten stable readings from the data acquisition system, which gives an uncertainty of about 1–2%.
3.0 RESULTS AND DISCUSSION
Analysis of the results obtained by the oil-film visualisation over the 40° sweep wing model provided a better understanding of the complex behaviour of the 3D nature of the boundary-layers on the suction surface. Subsequently, a digital video camera was used to capture the movement of the oil pigment over the suction surface. A novel analysis of the video images produced useful information for clarifying the topology of the flow in the more complicated areas, particularly where the flow travels in the reverse direction around the leading edge, and close to the wing tip. Finally, effects on overall forces and moments will be explained.
3.1 Effects of wing incidence
At low angles of incidence, which are below the design lift coefficient, some of flow structures are similar to those present in a 2D flow, and can be interpreted using the extended knowledge of the flow over 2D aerofoils in classical text books on the subject (e.g. Ref Reference Bertin20). Figure 2 shows the surface flow visualisation and a schematic plot of the corresponding flow over the 2D aerofoil section at 30% and 80% semi-span.
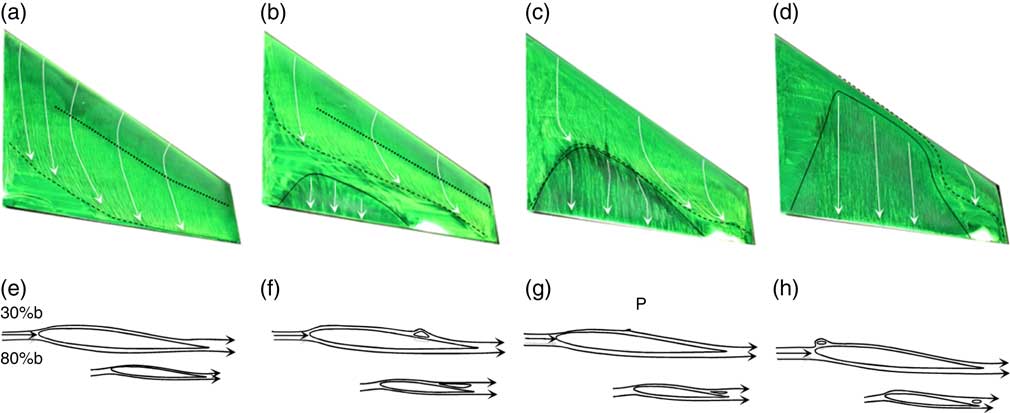
Figure 2 (Colour online) Oil-film surface flow visualisation together with sketches of the corresponding streamlines at 30% and 80% of semi-span, at Re=4.2×10⁵ and M=0.059 (broken lines: flow separation; solid lines: reattachment) for four incidence angles: α=0° (a, e), α=3° (b, f), α=4°(c, g) and α=4.5° (d, h).
Figure 2(a) shows the surface flow visualisation obtained at zero angle of incidence. It shows that the flow transition from laminar to turbulent occurs at one-third of the chord as indicated by the dot line between the dark and light green colour. Furthermore, the flow is seen to separate first near the root of the wing, where the original oil-film-brushed pattern has not yet been touched. This may be caused by the cross flow towards the wing tip. This 2D flow separation phenomenon is also highlighted in Tobak and Peake( Reference Tobak and Peake 18 ). The open flow separation is presented at the inboard of 30% semi-span near the trailing edge as sketched in Fig. 2(e).
For an incidence angle of 3°, as shown in Fig. 2(b), the flow separation occurs at 50% of the chord almost across the whole semi-span as indicated by the broken line. At the same time, the turbulent reattachment flow starts to appear at the trailing edge, where the separated flow has been located at α=0°. This can be attributed to the separated shear layer becoming turbulent, and thus more resistant to the flow separation. The other reason may be the strong cross-flow which produced a favourable chordwise pressure gradient to prevent flow separation. As a result, a mixed flow pattern forms across the span with a closed bubble at 30% of semi-span and an open separation flow at 80% of semi-span, as depicted in Fig. 2(f).
As the incidence angle increases further, both the separation and reattachment lines, indicated by broken and solid lines respectively, move closer to the leading edge, and merge into a single line in the region from 20% to 50% of semi-span as indicated in Fig. 2(c) and point ‘p’ in Fig. 2(g). At the same time, the open separation bubble can still be seen at the wing tip at 80% of semi-span, but clearly of a smaller size as indicated in Fig. 2(g).
Within only a small increment in the incidence of 0.5°, from an incidence of 4°, the flow pattern undergoes a dramatic change as shown in Fig. 2(d). A short closed bubble is formed at the leading edge in the range from approximately 30% to 60% of the semi-span of the model. This short bubble originates from the laminar separation at the leading edge, caused by a high suction peak around the leading edge and followed by a large adverse pressure gradient. As the flow transitions to a turbulent boundary-layer, it becomes more resistant to flow separation. Therefore, the flow is reattached close to the leading edge after the short separation bubble. As this separation bubble extends towards the wing tip, its chordwise location moves away from the leading edge and is affected by the attached flow outboard of 70% semi-span. Summary of the changes in the location of separation and reattachment lines corresponding to the flow patterns on the wing at the low angles of incidence are depicted in Fig. 4(a).
As the angle of incidence is increased further, the short separation bubble shown in Fig. 2(d) becomes shorter in the chordwise direction and extends further along the leading edge towards the wing tip. As shown in Fig. 3(a), the flow is fully separated from the leading edge and reattached direct downstream of the short closed separation bubble for α=7°, which is also indicated by the 3D sketch in Fig. 3(e).
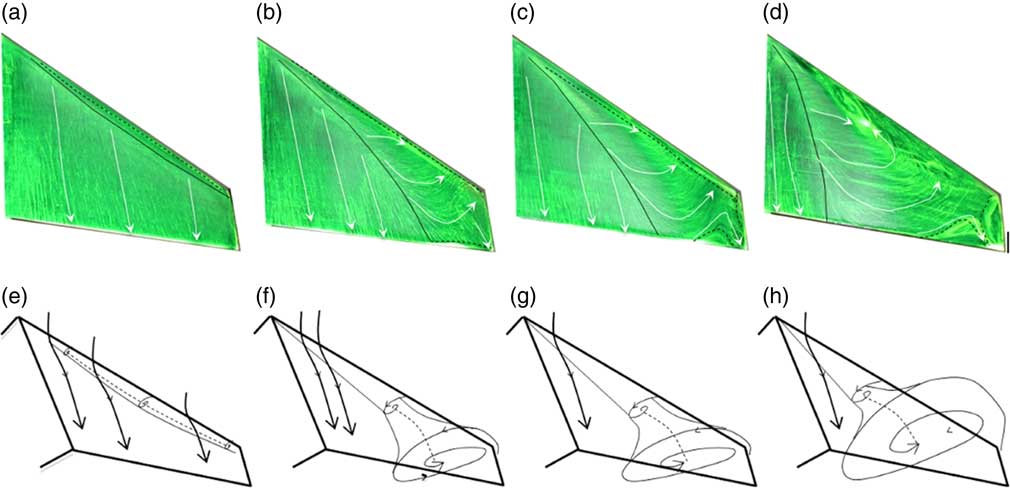
Figure 3 (Colour online) Oil-film surface flow visualisation together with 3D sketches of the corresponding streamlines at 30% and 80% of semi-span, at Re=4.2×10⁵ and M=0.059 (broken lines: flow separation; solid lines: reattachment) for four incidence angles: α=7° (a, e), α=8°(b, f), α=9°(c, g) and α=14° (d, h).
When the angle of incidence reaches a critical value (α=8°), the leading edge vortex (LEV) becomes a dominant feature of the flow topology over the swept wing as indicated in Fig. 3(b–d). This is caused by the aft bubble reattachment process failing at the wing tip region. Following Tobak and Peake’s( Reference Tobak and Peake 18 ) topology rules, the 3D sketches in Fig. 3(f–h) show the flow characters over the swept wing. These leading edge vortices are similar to those occurring on delta wings( Reference Ol and Gharib 5 ). The well-defined attachment line emanating from the apex towards the trailing edge moves away from the leading edge. As the incidence angle increases, the reattachment line moves inboard as indicated in Fig. 4(b).
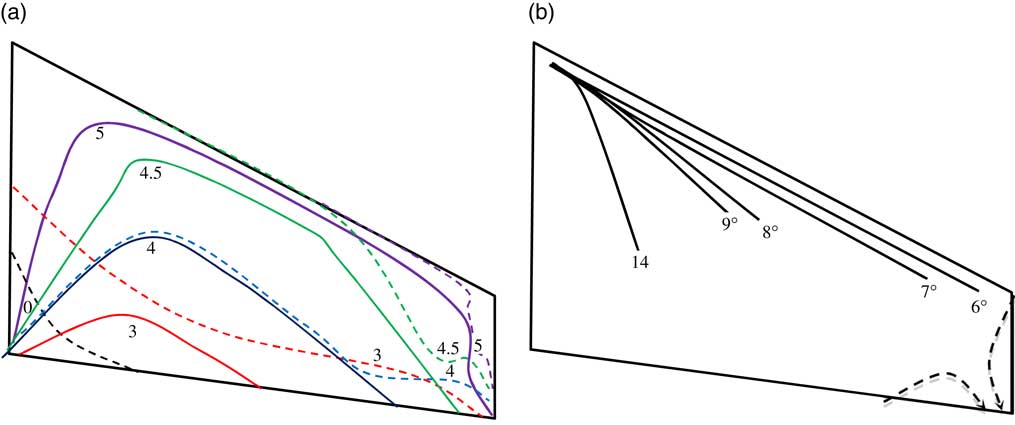
Figure 4 (Colour online) The sketch of the separation (broken) lines and reattachment (solid) lines for various incidence angles at Re=4.2×10⁵ and M=0.059. (a) Low incidence angles and (b) moderate incidence angles.
The wing tip vortex becomes stronger and more evident over the suction surface at higher angles of incidence. For example, at α=14°, the inboard flow appears at the wing tip region, as shown in Figs 3(d) and 4(b). The interaction between the LEV and the wing-tip vortex produces very complex unstable flow structures over the wing tip region. These flow structures are highly 2D and cannot be easily interpreted by using 2D sketches.
3.2 Detailed flow structures at a moderate incidence
To illustrate the complicated vortical structures over the wing model at moderate incidence, an angle of incidence of 9° was chosen to perform a detailed experimental investigation. This included detailed three-component laser Doppler anemometry (LDA) measurements as explained by Zhang et al.( Reference Zhang, Jaworski, Turner and Wood 17 ), stereo particle image velocimetry (SPIV) measurement and force moment measurements discussed in Section 3.5.
Figure 5 shows the topology of the flow structures over the full swept wing model at α=9°. The flow pattern is quite symmetrical along the centreline. The primary LEV originates close to the apex, and forms a well-defined reattachment line marked as a bifurcation line (also referred to as herring-bone effect by Haines( Reference Haines 1 )) inboard of 50% of semi-span. Beyond this position, the primary LEV become less coherent (or bursts) and bends towards the trailing edge. The secondary separation bubble is also formed between the primary LEV and the leading edge.
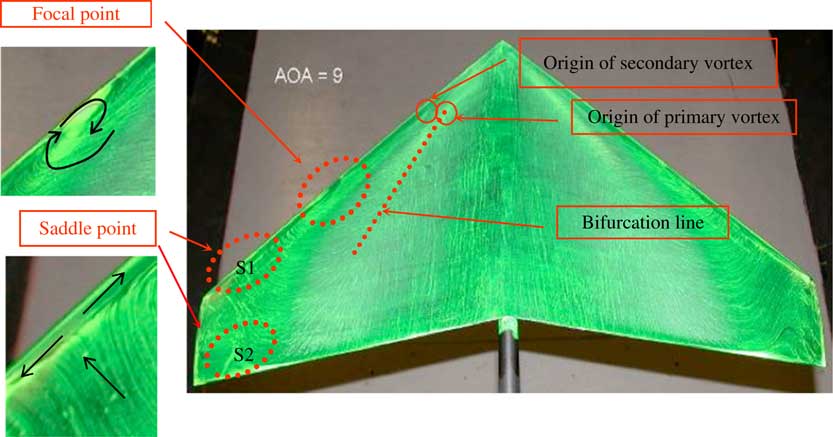
Figure 5 (Colour online) Flow topology over suction surface of the 40° swept wing at α=9° and Re=4.2×10⁵.
Much more complicated flow structures can be observed at the wing tip. First, the LEV produces a reversed flow moving towards the leading edge and extending to the wing tip region. As it meets and interacts with the separated flow moving outwards from the leading edge, a saddle point (S1) is formed on the wing surface, from where the flow separates into two branches in the opposite directions along the leading edge as indicated in the detailed view at the bottom left of Fig. 5. This inboard reversed flow is caused by the lower pressure in the unseparated region compared with that in the outboard separated region.
In the spanwise direction, this reversed flow meets and collides with the wing-tip vortex and forms another saddle point (S2) at the wing tip region, where the flow separated into two branched in the upstream and downstream directions. This demonstrates complicated interactions between the LEV and the wing-tip vortex.
In addition, the focal point is located close to the leading edge at 50% of the semi-span, next to the secondary separation bubble, as shown in the top left corner of Fig. 5. This is induced by the interaction of the upstream branch of the flow from saddle point (S1) and the secondary separation bubble. When the oil pigment accumulates too much at the focal point at the beginning of the tests, it is seen to detach from the surface of the wing due to the swirlness of the vortex. This focal point becomes much clearer at higher angles of incidence as shown in Fig. 3(d).
A similar flow topology can be found in the flow over a moderately swept delta wing( Reference Yavun, Elkhoury and Rockwell 6 ). However, the focal point in Fig. 5 was interpreted as a nodal point rather than a focal point using close surface PIV measurements although the focal point can be identified in their instantaneous PIV results. Also, their flow visualisation cannot show the detailed information due to insufficient resolution.
Figure 6 shows the contours of mean velocity and shear stress –u′v′/U 2 on two streamwise planes (30% and 80% of semi-span) at α=9°. The LEV is indicated as small separation bubble from the streamlines at the root section in Fig. 6(a). Thin layer of large positive shear stress (−u′v′) upstream of 10% of the chord indicates the turbulent transition( Reference Ol, Hanff, McAuliffe, Scholz and Kaehler 21 ). At the wing tip region, the flow separation produces a thicker boundary-layer. Also, mean vortices were indicated by a broad region with a larger shear stress. Streamlines in Fig. 6(b) also show the induced downwash flow in the wake of the wing model.
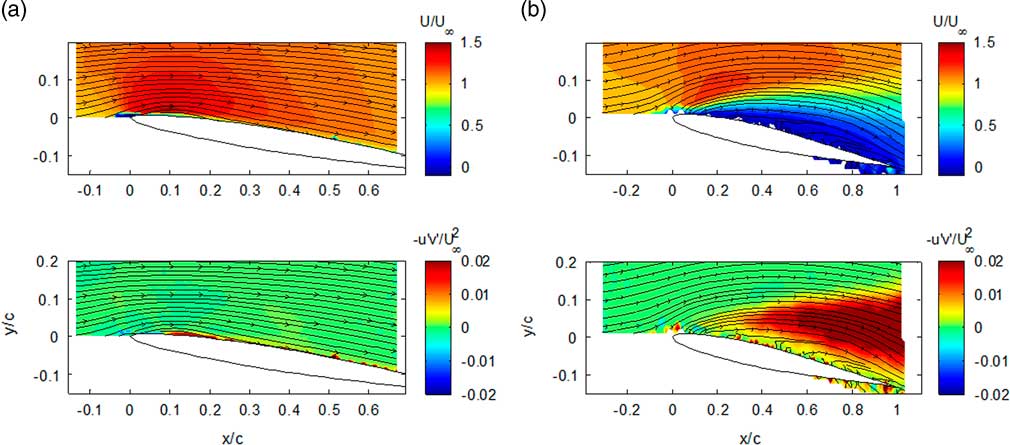
Figure 6 (Colour online) Contours of the averaged streamwise velocity and Reynolds shear stress u′v′/U ∝ 2 for the swept wing model at α=9° and Re=2.1×10⁵. (a) 30% of semi-span and (b) 80% of semi-span.
Figure 7 shows the contours of the mean streamwise velocity and streamlines in the cross-sectional planes normal to the free stream. The measurement plane, which is located at 52% of the root chord downstream of the apex, intersects the wing model from wing root to 65% semi-span. It is revealed from Fig. 7(a) that the core of the LEV is at about 42% semi-span. This is characterised as an open separation( Reference Tobak and Peake 18 ). In the wake of the model, the presence of two vortex cores can be inferred from both the velocity deficit and streamlines, as is clear from Fig. 7(b). One vortex core, induced by the LEV, is located at around 80% of semi-span. This agrees very well with LDA measurements( Reference Zhang, Jaworski, Turner and Wood 17 ). Its vertical location is approximately the same as that of the trailing edge, which is much lower than that in the LDA measurement. This may be attributed to the downwash induced by the wing model as indicated in Fig. 6(b). The other core of the vortex locates downstream of the wing tip with a smaller area of velocity deficit caused by the wing tip vortex.
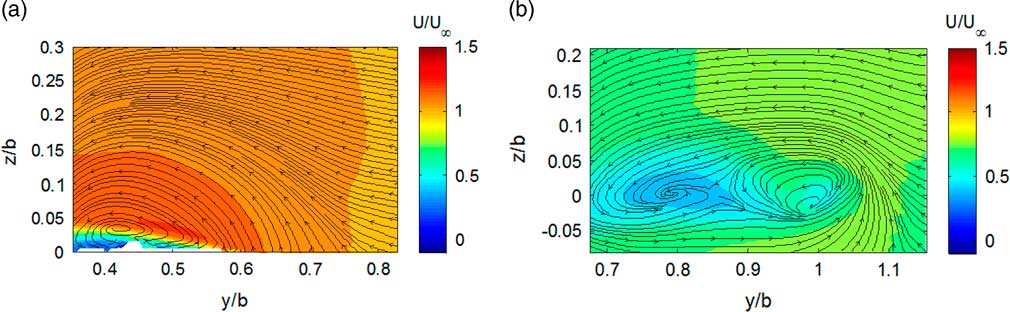
Figure 7 (Colour online) Contours of the averaged streamwise velocity with streamline on cross-sectional planes (normal to freestream) at α=9° and Re=2.1×10⁵ (a) 52% of root chord; (b) 152% of root chord (downstream).
3.3 The formation of the flow topology over the wing
Although individual oil-film pictures provide useful and relatively comprehensive information about the trace of surface skin friction, it is insufficient to allow the correct interpretation of flow directions. Such images can be very misleading without referring to other related information. For example, Li and Leschziner( Reference Li and Leschziner 7 ) marked wrong flow directions at the wing tip region in their Fig. 5. Live video of surface oil visualisation developing in time can be helpful in obtaining the correct flow direction. Figure 8 shows six snapshots extracted from the live video of the flow visualisation on the model surface at α=10°. Figure 8(a) shows that the flow initially separated from the leading edge inboard of 30% of the semi-span and formed the LEV, and then reattached near to leading edge while the flow remained fully separated from the leading edge without any reattachment outboard of 30% of the semi-span, which was caused by the low free-stream velocity when starting the wind tunnel.
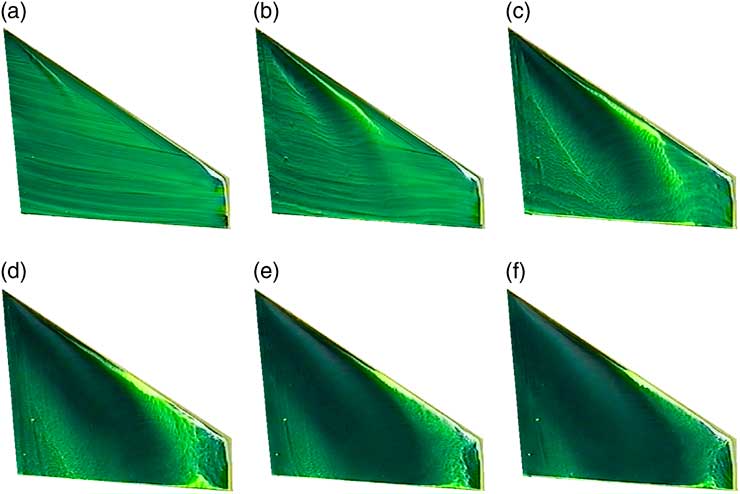
Figure 8 (Colour online) Snapshots of instantaneous flow visualisation for the wing at α=10° and Re=4.2×10⁵. (a) 2 s, (b) 6 s, (c) 10 s, (d) 14 s, (e) 18 s and (f) 22 s.
As the speed of the wind-tunnel picks up, the reattachment zone extends up to 60% of the semi-span, and the secondary separation line moves closer to the leading edge. After the wind tunnel reaches the constant speed of 20 m/s, the flow pattern over the wing surface becomes steady. First, oil pigment accumulated at the focal point near the leading edge at 50% of the semi-span and was lifted from the wing from there. Second, it is also easy to observe the two saddle points at the wing tip region from the video images in Fig. 8(d) and (e).
When the instantaneous video images are not sufficiently clear to show the movement of the oil pigment, cross-correlation between adjacent video frames can be carried out to provide the velocity vector field over the surface. Using TSI PIV software, post-processing of the extracted video image was performed( Reference Zhang and Turner 19 ). This shows the movement direction and magnitude of the oil pigment over the wing. Figure 9 shows the generated surface skin friction lines superimposed onto the contours of velocity of oil pigment over the wing surface at six incidence angles and Re=4.2×10⁵. Due to the difficulties in calibration, the colour map was set to an arbitrary scale.
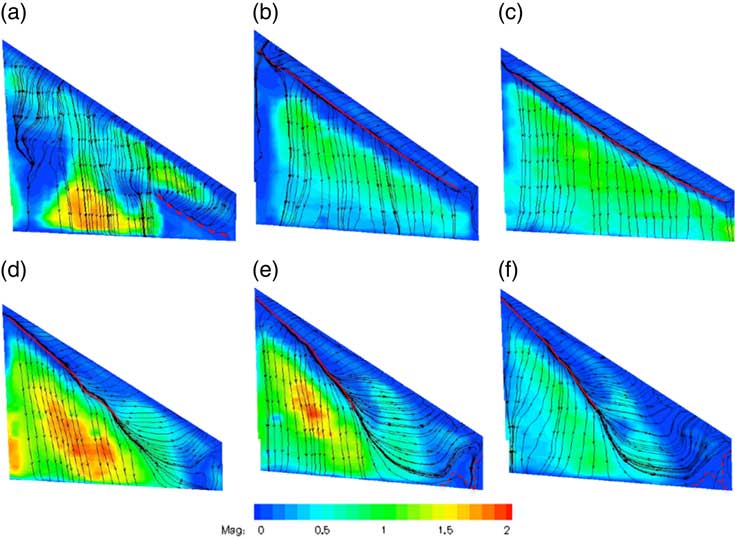
Figure 9 (Colour online) The skin friction lines with the magnitude over swept wing at different incidences. (a) 4°, (b) 6°, (c) 7°, (d) 8°, (e) 9° and (f) 10° (arbitrary colour scale; broken lines: flow separation; solid lines: reattachment).
Figure 9(a), obtained for α=4°, shows straight skin friction lines across the middle section of the half-wing while the colour contours reveals that these lines cross two different flow regions, i.e. laminar attachment and turbulent reattachment. Turbulent reattachment produces a larger skin friction which produces a larger velocity of oil pigment in the yellow triangle region near the trailing edge. Figure 9(b) and (c) shows the reattachment bifurcation line parallel to the leading edge which is identical to the oil flow visualisation in Fig. 3(a). The typical flow patterns of the LEV in Fig. 5 can also be identified in Fig. 9(d)–(f). Due to the low resolution of the video images, it is hard to reproduce the critical points close to the leading edge.
3.4 Effect of the Reynolds number
Figure 10 shows the influence of the Reynolds number on the flow pattern over the model wing at α=10°. It can be seen that the LEV is relatively weak at the low free-stream velocity of 10 m/s, corresponding to Re=2.1×10⁵ (cf. Fig. 10(a)). The closed separation bubble, located between the secondary separation line and leading edge, has a relatively large size, and the burst of the LEV produces a relatively small cross-flow velocity component, which is insufficient to drive the oil pigment towards the wing tip. Therefore, the oil pigment did not show much change at the wing tip.
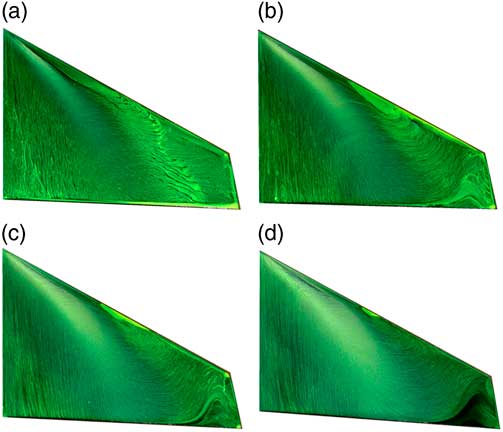
Figure 10 (Colour online) Oil-film visualisation of the swept wing at α=10° for four Reynolds numbers: (a) Re=2.1×10⁵, (b) Re=4.2×10⁵, (c) Re=6.3×10⁵ and (d) Re=8.4×10⁵.
With an increasing Reynolds number, the LEV becomes stronger, which causes the secondary separation line move closer to the leading edge, and a stronger reversed flow towards the leading edge and the wing tip. Furthermore, the separation line caused by this reversed flow is also seen to move closer to the leading edge outboard of 50% of the semi-span. In addition, the reversed flow caused by the LEV competes with the wing tip vortex in the wing tip region. At a higher Reynolds number of 8.4×10⁵ (cf. Fig. 10(d)), the wing-tip vortex over the suction surface is limited to a smaller region of 30% chord by the strong LEV burst. Finally, the oil pigment at the focal point at 50% semi-span near the leading edge occupies a smaller region at a higher Reynolds number, which is attributed to a stronger swirlness of the vortex to lift oil pigment off the wing surface.
Figure 11 shows a hypothetical structure of separation sheets over the suction side of the half wing model as inferred from the results obtained in this study. It summarises the major flow features present over the wing at a moderate incidence. First, based on the surface flow visualisation and SPIV measurements, the LEV, which is composed of separated sheets, occurs inboard of 50% of the semi-span. The turbulent reattachment is located adjacent to the LEV and a secondary separation bubble is underneath the LEV close to the leading edge. Next, the flow structures are relatively complex outboard of 50% of the semi-span. It seems that when the LEV bursts, it expands in radius and also bends towards the trailing edge. Furthermore, the locus of the core of the LEV is lifted from surface rapidly with its expansion towards the trailing edge as revealed by the LDA measurements by Zhang et al.( Reference Zhang, Jaworski, Turner and Wood 17 ).
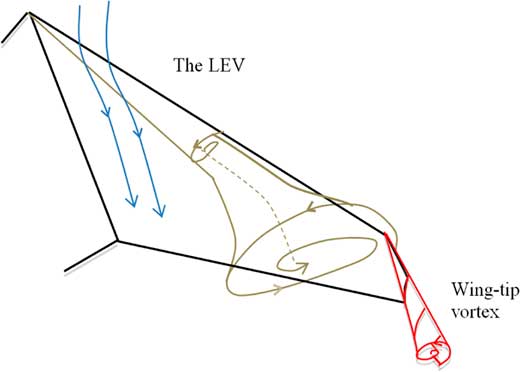
Figure 11 (Colour online) Schematic representation of the separated surfaces over the 40° swept wing.
The wing tip vortex and its interaction with the burst LEV at the wing tip region is another important flow feature over the swept wing. It is shown that the wing tip vortex becomes stronger as the incidence increases, while the influence on the wing tip flow by the LEV becomes stronger with increasing Reynolds number.
3.5 Aerodynamic force measurement
An internal six-component sting balance (reference BAE No. 46) was used to obtain measurements of aerodynamic forces and moments. Measurements were made at a number of flow velocities with the angle of incidence being set in the required range between −1° and 22°. This was computer controlled using a traversing mechanism located at the outlet plane of the tunnel working section. Figure 12 shows the profiles of lift and reduced drag coefficients, pitching moment and axial force and normal force coefficient.
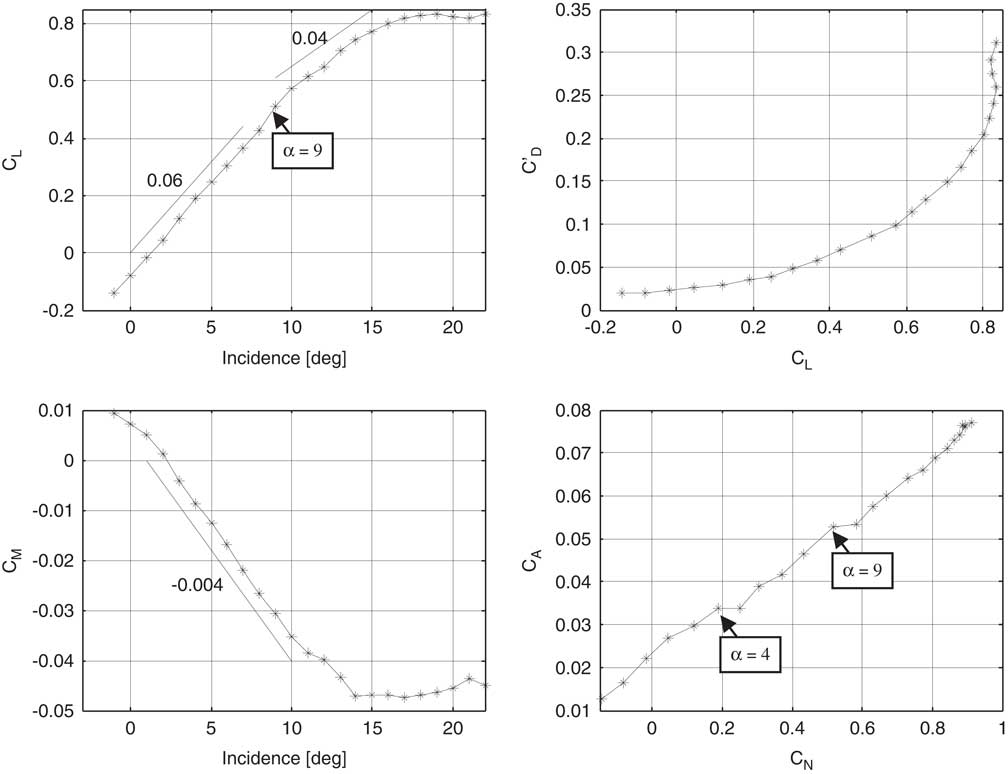
Figure 12 The profiles of lift coefficient (C L), momentum coefficient (C M) over the incidence range and reduced drag coefficient (C D′), axial force coefficient (C A) of the wing model, at Re=4.2×10⁵ (M=0.044).
From Fig. 12(a), it can be seen that the zero lift condition occurs at an incidence angle of 1.2° based on the chord line at the root of the model, while the lift increases linearly with the angle of incidence. With the wing tip stall at α=8°, the overall lift continues to increase, but with a slightly lower slope of 0.05 instead of 0.06. This may be attributed to the inboard lift in the unseparated region continuing to rise while the lift in the separated wing tip region remains more or less constant( Reference Bertin 20 ). Above the incidence of 19°, the lift is approximately constant which may be caused by the balance between the lift increase inboard and the wing-tip stall.
Reduced drag coefficient C D′=C D−C L2/πAR allows the trends in the underlying drag to be discerned more clearly by removing a common amount of vortex drag( Reference McParlin, Bruce, Hepworth and Rae 22 ). Figure 12(b) shows a slower increase of reduced drag coefficient at lower lift coefficient and a dramatic increase after wing-tip stall at α=8° (cf. C L>0.5). Variation of pitching moment coefficient, with the moment reference centre at the aerodynamics centre of 57% root chord, is shown in Fig. 12(c). The main feature is that the pitching moment decreases linearly with the incidence angle and reaches the constant after the angle of incidence is larger than 14°.
Axial force and normal force coefficient could reveal the onset of the flow separation( Reference McParlin, Bruce, Hepworth and Rae 22 ). Figure 12(d) shows the variation of the axial force coefficient with the normal force coefficient. Although the overall trend is a linear relationship, two local minimums occur at C N=0.25 and 0.6 which corresponds to the onset of the leading edge separation (α=4) and the start of the strong LEV (α=9).
4.0 CONCLUSIONS
In this work, the flow over a 40° swept wing has been investigated at a range of angles of incidence and Reynolds numbers by using extensive surface flow visualisation and PIV measurements. The flow topology is revealed in great details after a systematic interpretation of the flow features present. The key findings from this study are summarised as followings:
First, the flow over the 40° swept wing shows complex transitions from the fully attached flow to the close separation bubble, and to open separation flow with an increase of the incidence.
Second, the flow over the 40° swept wing at a higher incidence angle indicates two vortex systems, i.e. the LEV and wing-tip vortex. The LEV dominates the flow over the swept wing while wing-tip vortex develops within the wake flow.
Finally, the leading edge vortex affects the overall force and moment distributions. Flow separation causes an increase of the lift when LEV dominates the flow at an incidence of 9°, and induces a reduction for the axial force at incidences (α=4° and 9°).
ACKNOWLEDGEMENTS
The authors wish to thank their academic and industrial partners in this MSTTAR Defence Aerospace Research Project. Funding by the EPSRC (GR/S27443/01) and the Ministry of Defence.


 Open access