

NOMENCLATURE
- AirTOp
air traffic optimiser
- ATC
air traffic control
- ATFM
air traffic flow management
- ATM
air traffic management
- ANSP
air &&&navigation service provider
- BADA
base of aircraft data
- BC
black carbon
- COALA
compromised aircraft performance model with limited accuracy
- CONOPS
concept of operations
- DLR
German Aerospace Research Center
- FRA
free route airspace
- GFS
global forecast system
- GMT
Greenwich Mean Time
- HC
hydrocarbons
- IAS
indicated airspeed
- IFRs
instrument flight rules
- ISA
international standard atmosphere
- KPI
key performance indicator
- NextGen
Next Generation Air Transportation System
- NOAA
National Oceanic and Atmospheric Administration
- NOx
nitrogen oxides
- PBN
performance-based navigation
- p cruise
cruising pressure altitude
- RNAV
area navigation
- RNP
required navigation performance
- SESAR
Single European Sky ATM Research
- TABATS
test bench for agent-based air traffic simulation
- TOMATO
TOolchain for Multicriteria Aircraft Trajectory Optimisation
-
 $$\Delta \dot{m}_{f} $$
difference in fuel flow
- Δt
temporal resolution of the flight performance model
- Δx
spatial resolution of the flight performance model
- Δx taskload
spatial resolution of the taskload assessment

1.0 INTRODUCTION
The air transport system is a fast-developing entity with highly dynamic input parameters and an increasing number of variables. Very high safety requirements and certification standards are complicating the implementation of new procedures which are dealing with those general conditions. For this reason, research programs such as Single European Sky ATM Research (SESAR) 1 and Next Generation Air Transportation System (NextGen) 2 are focusing on challenging targets for the adaption of aviation to future requirements. Beside an increasing competition pressure and inevitable improvements in efficiency, aviation stakeholders are requested to increase the aviation environmental compatibility without adversely affecting safety and security of the air transport system. Optimisation potential for those conflicting targets has been found on almost every air traffic planning level, ranging from aircraft network designReference Rosenow, Lindner and Fricke 3 , fleet assignmentReference Jeßberger, Voigt, Schumann, Sölch, Schlager, Kaufmann, Petzold, Schäuble and Gayet 4 and trajectory optimisation 1 , 2 , Reference Rosenow, Förster, Lindner and Fricke 5 to air traffic flow management (ATFM)Reference Standfuss, Temme and Schultz 6 . Trajectory optimisation can be applied in the flight planning phase (dispatch) as well as during the flight, when actual input parameters, such as weather conditions, restricted areas and airport capacities, are known. Regardless of the planning level, flight performance modelling is necessary for a reliable optimisation of the air traffic system, because it is the smallest unit each air traffic optimisation should be based on. Within the framework of the research program ProfiFuel (improved planning and realisation of flight profiles with the lowest ecological footprint and minimum fuel consumption), the potential and the boundary conditions of this 4D trajectory management are investigated.
In Europe, the reduction in the air traffic environmental impact and the increase in aviation efficiency and safety (regarding both airlines and air navigation service providers (ANSPs)) are already regulated by law 7 , forcing air traffic stakeholders to co-operate in finding a solution that satisfies competitive partners.
Area navigation (RNAV) provides a solution approach for this 4D trajectory management by contributing a framework for both airlines and ANSPs 1 , Reference Mensen 8 , 9 . The first step towards this action, the ‘time-based operations’ focus on the deployment of airborne trajectories 1 , 9 , considering all constraints inflicted by the highly complex and dynamic environmental conditionsReference Abeloos, von Paassem and Mulder 10 , which requires refraining from standard atmospheres and focuses on the use of high-resolution real weather data. Time-based operations aspire to create free routings to enable optimised trajectories 1 , 9 under real weather conditions. Free routes are freely planned routes between a defined entry point and a defined exit point of a free route airspace (FRA), constrained by published or unpublished waypoints 1 . In many European air traffic control (ATC) sectors, FRA is already implemented, at least at night 11 , 12 . Therewith, the ground for innovative concepts e.g. the 4D trajectory management is prepared and several application ideas have already been formulated in the SESAR Master plan 1 , in the SESAR Solutions Catalogue 9 and in the SESAR Concept Of Operations (CONOPS) Step 1 13 .
Meeting the challenging requirements of the 4D trajectory management with non-constant speeds and cruising altitudes, the concept of performance-based navigation (PBN) has been developed to strategically deconflict free routes by allowing airspace planners to take credit for the aircraft’s navigation performance 14 , 15 . With these rules of action, aircraft shall be able to safely meet their planned times of departure and arrival and adhere to their optimum flight paths from gate to gate with minimum disruptions, assuming aircraft are equipped with voice and data communications, RNAV and required navigation performance (RNP) capabilities 14 – 16 .
However, these targets implicate conflicting goals in a multicriteria optimisation, due to diverging targets between airlines and ANSPs as well as between environmental, economic and safety issues.
1.1 4D trajectory management
Airlines are focusing on efficiency by minimising the number of planes and employees and the fuel burn, whereas the revenue passenger miles, number of departures and passengers and the available ton-miles shall be maximisedReference Rai 17 . On a planning level, this strategy will have a reducing effect on the environmental impact as well. On the level of a single trajectory, competitive applications are necessary. Taking safety requirements as additional constraints, a multiple-criteria optimisation approach becomes unavoidable. Due to the increasing weight of the environmental compatibility of the flight, the aircraft emissions have to be calculated precisely. For emissions as products of incomplete combustion (NOx, HC, BC), a combustion chamber model is necessary, which requires precise information about thrust, speed, acceleration forces and the aircraft’s attitudeReference Rosenow, Lindner and Fricke 3 , Reference Rosenow, Förster, Lindner and Fricke 5 , Reference Rosenow, Förster and Fricke 18 . The TOolchain for Multicriteria Aircraft Trajectory Optimisation (TOMATO) has been exclusively developed for this purpose. This simulation environment includes a multicriteria trajectory optimisation, considering an exact trajectory calculation based on analytically solvable target functions and a combustion chamber model, which is unique at the current state of the art. In summary, airlines’ targets are found specifically on the network and trajectory level and can be applied with simulation environments such as TOMATO for different airline business models (e.g. different network structures and cost indices), resulting in diverse target functions in the trajectory optimisation.
1.2 Air traffic flow management
Airlines cooperate with ANSPs for a safe operation and management of the air traffic flow. ANSPs are measured against the same performance targets (safety, efficiency and ecological impact), with different key performance indicators (KPIs). However, when comparing the different target functions of airlines and ANSPs, a significant competition between airlines and ANSPs is not quantifiable.
The main focus of ANSPs’ assessment is based on safety measures (e.g. prevention of loss of separation and runway incursions) as well as safety management system maturity. One of the most important groups of ANSP KPIs is summarised in the KPI capacity utilisation, measuring the operational efficiency of ANSPs i.e. ensuring that resources (e.g. available airport or airspace capacity) are optimised within the given conditions of the system (i.e. weather, airport maintenance constraints, etc.) 19 . Capacity utilisation quantifies the amount of available capacity that is being used to supply the current demand. Concentrating on the upper air space, the available capacity is restricted by separation minima for conflict avoidance, usually five nautical miles in the horizontal and 1,000 ft in the vertical direction. With the implementation of the 4D trajectory management, aircraft will not be constrained by waypoints and flight levels any more. Hence, air traffic will be more homogeneously distributed in the upper air spaceReference Rosenow, Förster, Lindner and Fricke 20 – Reference Rosenow, Fricke and Schultz 22 . Therewith, the available capacity (i.e. the maximum number of aircraft per sector and time) will increase considerably. For operating with a high capacity utilisation in a 4D trajectory management, the sector size or the number of aircraft per sector could be increased. However, the KPI complexity (i.e. the adjusted density, vertical interactions, horizontal interactions and speed interactions 23 ) is expected to increase due to the implementation of the 4D trajectory management. Keeping complexity at an acceptable level tends toward a manageable and dynamic sector size, so that the KPI traffic variability of daily and weekly traffic (i.e. the ratio between the peak traffic and average traffic measured in number of flights 19 ) may decrease or be kept at a constant level. Due to an expected increased complexity, the KPI productivity, measuring the number of instrument flight rules (IFRs) flight hours per ATC officer (ATCO), the average number of annual working hours for ATCOs, the number of aircraft controlled, the number of controlled flight hours, the number of controlled kilometers and the directions/requests from the control center, may be stressed, due to an increased communication between pilots and ANSPs. Furthermore, the cost-efficiency as costs per IFR flight hour, the flight efficiency as deviation from the optimum trajectory and environmental factors influence the KPI quality of service, which is a measure of the delay and airport capacity. The attributable delay KPI records the causal reasons for a delay and allows the ANSP to assess its influence in mitigating the delay and improving the efficiency 19 .
To conclude, the impact of 4D trajectories on the ATFM can be assessed by ANSP’s KPIs capacity utilisation, complexity and productivity influenced by controller’s taskload, total fuel burn, total time of flight in the air spaces and necessary changes in the airspace capacity. Differences between the reference scenario and the optimised trajectories represent the potential of an efficiency improvement in airlines and ANSPs.
1.3 State of the art
Several air traffic flow simulation environments have been developed, each with a specific scope, but none of them considers safety issues on the ATFM level. Furthermore, restrictive approximations in the aircraft performance modelling and a deficient quantification of the emissions restrict all of them in the applicability to a multicriteria trajectory optimisation. The commercial fast-time air traffic simulator air traffic optimiser (AirTOp) 24 generates conventional waypoint-based trajectories in a dynamic airspace structure and iteratively considers conflict detection and conflict resolutionReference Luchkova, Vujasinovic, Lau and Schultz 25 . AirTOp has been applied to reroutings around volcanic ash cloudsReference Luchkova, Kaltenhaeuser and Morlang 26 and in estimating the influence of restricted airspaces on the air traffic systemReference Kreuz, Luchkova and Schultz 27 . However, due to approximations in the aircraft performance modelling (which is limited to base of aircraft data (BADA) performance tables) and missing quantification of the emissions, AirTOp is not suitable for the deconfliction of 4D optimised trajectories. The same restrictions apply to the test bench for agent-based air traffic simulation (TABATS), which simulates trajectory scenarios considering weather-dependent lateral rerouting around thunder cellsReference Schultz, Fricke, Kaiser, Kunze, Lopez-Leonés, Wimmer and Kappertz 28 – Reference Schultz, Fricke, Gerbothe, Grabow, Prins, Wimmer and Kappertz 30 but also concentrates on BADA performance tables. TABATS has been developed for the trajectory synchronisation with the aim of predicting arrivals enabled by full automation and focuses on the simulation of trajectory scenarios considering lateral rerouting around thunder cells and speed adjustments with a specialised airport slot allocation routineReference Schultz, Fricke, Kaiser, Kunze, Lopez-Leonés, Wimmer and Kappertz 28 – Reference Kaiser, Schultz and Fricke 31 . Grewe et al.Reference Grewe, Matthes, Dahlmann, Gollnick, Niklaß, Linke and Kindler 32 concentrated on the climate assessment of trajectories, considering future aircraft technologies and uncertainties in the quantification of the emissions. Here, the impact on ATFM was not in focus. Within the framework of the research project ATM4E, Matthes et al.Reference Matthes, Grewe, Lee, Linke, Shine and Stromatas 33 developed a multidimensional optimisation tool for trajectories and their impact on the air traffic network and demand. Unfortunately, the implemented methodology is not completely published. Regarding the flight performance modelling, the commercial flight planning tool Lido/Flight 4D, developed by Lufthansa Systems 34 , is also able to simulate trajectories assuming ambient thermodynamical conditions defined in the International Standard Atmosphere (ISA). Hence, special weather phenomena and parameters, which are required for the precise quantification of the engine emissions and their environmental impact as well as the formation of condensation trails depending on location and size of ice-supersaturated regions, cannot be modelled. The Airspace Simulator TAAM, developed by Jeppesen, is also restricted to ISA with unknown precision. The open source Open Air Traffic Simulator BlueSky has been developed to visualise, analyse and simulate the air traffic. It includes an aircraft performance model independent of BADAReference Metz, Hoekstra, Ellerbroek and Kügler 35 using only public performance data, especially Jane’s All the World’s Aircraft database. This promising project is still in the development stage. However, hard restrictions regarding the aircraft performance and flexibility regarding the aircraft type are expected. The optimisation capability of the model is unknown. The scenario-based modelling tool Nest by EUROCONTROL provides sector counts, airport demand, number of flights between airport pairs, etc. of a set of trajectories, imported into NEST in an so6 format 36 . The research project REACT4C of the German Aerospace Center (DLR) published interesting findings regarding ecological trajectory optimisationReference Grewe, Fr?mming, Matthes, Brinkop, Ponater, Dietm?ller, J?ckel, Garny, Tsati, Dahlmann, S?vde, Fuglestvedt, Berntsen, Shine, Irvine, Champougny and Hullah 37 using cost functions. However, details in trajectory optimisation and emission quantification are not published. Hence, the accuracy of multicriteria trajectory optimisation cannot be estimated. Matthes et al.Reference Matthes, Grewe, Dahlmann, Frömming, Irvine, Lim, Linke, Lührs, Owen, Shine, Stromatas, Yamashita and Yin 38 published further development in the subsequent project AMT4E without any results. Furthermore, Lovegreen et al., Skowron et al. and Sovde et al.Reference Lovegreen and Hansman 39 – Reference Søvde, Matthes, Skowron and Lachetti 41 focused on the estimation of the impact of aviation on global climate. However, all these approaches cannot be generalised due to the major impact of the assumed atmospheric conditions. When performing trajectory optimisation, most approaches focus on the cruise phase onlyReference Grabbe, Sridhar and Cheng 42 – Reference Ng, Sridhar, Cheng and Li 47 .
The aircraft flight performance has been modelled with different granularity depending on the intended use. In an ISA, performance models are available for airlines e.g. the commercial flight planning tool 4D Lido/Flight by Lufthansa Systems, with unknown precision. BADA by the European Organisation for the Safety of Air Navigation provides specific aircraft performance parameters and allows a performance modelling for a wide range of aircraft typesReference Ng, Sridhar, Grabbe and Cheng 44 , Reference Ng, Sridhar, Cheng and Li 47 , Reference Serafino 48 . In many applications of trajectory optimisation, a realistic flight performance is often neglected and many static parameters are assumed e.g. constant speed and altitude. Other approaches even consider minor dependencies as compressibility effects in the calculation of the drag coefficientReference Kaiser, Schultz and Fricke 49 e.g. the enhanced jet performance model (EJPM) but are restricted to a very limited number of aircraft types and to ISA atmospheric conditions. The EJPM had been used and applied for case studies on continuous descent operationsReference Kaiser, Schultz and Fricke 31 , for flight profiles without contrail formationReference Kaiser, Rosenow, Fricke and Schultz 50 and the contrail life cycleReference Rosenow, Kaiser and Fricke 51 , for automated trajectoriesReference Kaiser, Schultz and Fricke 31 , Reference Kaiser, Schultz and Fricke 49 and for the synchronisation of automated arrivalsReference Schultz, Fricke, Kaiser, Kunze, Lopez-Leonés, Wimmer and Kappertz 28 . Soler et al.Reference Soler, Zou and Hansen 52 modelled the flight performance with a 3-degree-of-freedom dynamic model depending on true air speed, heading and flight path angle in ISA, but with 2D wind information, restricted to flight-level changes during cruise, separated by 1,000 ft. Hence, an optimum cannot be detected. However, all these applications use a single target function (e.g. minimum fuel flow or minimum time) for the optimisation, which seems insufficient with the conflictive SESAR and NextGen targets in mind. For solving multicriteria trajectory optimisation problems, two approaches have been primarily investigated. The path-finding algorithm A* and the more general Dijkstra algorithm for searching shortest paths in a graph are employedReference Zillies, Schmitt and Vujasinovic 46 , Reference Ng, Sridhar, Cheng and Li 47 as well as the optimal control problem approachReference Sridhar, Cheng and Ng 45 , Reference Hargraves and Paris 53 – Reference Bittner and Fleischmann 55 , which is able to consider conflictive target functions and real weather conditions. The discrete input parameters are approximated by analytically solvable functions. From this follows a very constricted number of variables and sometimes the errors arising from the approximation seem too high. Furthermore, the flight performance is modelled in a very simple way. Multicriteria optimisation of trajectories in a horizontal plane has been performed under real weather conditions with a detailed horizontal flight performance modelling as a two-point boundary value problem. Parton et al.Reference Patrón, Botez and Labour 56 and Murietta et al.Reference Murietta Mendoza and Mihaela Botez 57 used multilevel optimisations in 3D grid models. Nevertheless, the flight performance is only approximated by a performance database, where fuel burn and the distance travelled are calculated depending on Mach number, indicated air speed, gross weight, temperature deviation of the ISA and altitude. This approach only considers the reduction of fuel consumption or time of flight. Howe-Veenstra et al.Reference Howe-Veenstra 58 developed smooth optimised trajectories following constant IAS or constant Mach number and a constant altitude at cruise with a single, but variable target function considering a temperature deviation of the ISA.
Besides all these ongoing research, which focus on single aspects, we do not know of any approach, that performs a full lateral and vertical multicriteria trajectory assessment and optimisation while considering direct operating costs, fuel costs, time costs and emissions by considering realistic, aircraft-specific flight performance data. Especially the complex balance between very different multiple criteria is a fairly detailed topic that needs much more attention in order to improve the ecological impact of aviation.
The concatenation of the particular trajectory calculation and optimisation with the analysis of the spacial 4D distribution of aircraft and conflicts is unique in the simulation environment TOMATO. To date, these tasks have been treated separately. First analyses of the capability of TOMATO showed numerical and implementational difficulties in the analysis of investigations concerning the ATFMReference Rosenow, Förster, Lindner and Fricke 20 , which have been solved by analysing the demand of individual aircraft on airspace capacity and its impact on the controller’s taskloadReference Rosenow, Fricke and Schultz 22 and regarding the distribution of conflicts as imminent separation infringements between individual aircraftReference Rosenow and Fricke 21 .
2.0 METHODOLOGY
2.1 Approach
In this study, the impact of multicriteria optimised free route trajectories on the ATFM system is analysed in detail and compared with a reference scenario which consists of 8,800 flown trajectories provided as so6 m3 flight plan file by EUROCONTROL (for research purposes) to correctly reproduce the current situation during 1h in the European upper airspace on 17 May 2017. The reference scenario is calculated twice. First, the commercial fast-time total airspace and airport model AirTOp is used to realistically simulate these trajectories with real, historical speeds, cruising altitudes, lateral paths and level changes. This reference scenario is also used for a validation of the simulation environment TOMATO, by additionally calculating the reference scenario with TOMATO using city pairs, lateral paths departure times, aircraft types, cruising altitudes and altitude changes during cruise. For validation, the results integrated overall simulated flights in the upper European airspace during that specific hour from 12 a.m. to 1 p.m., which describes the impact of the trajectories on the ATFM system, are compared between both simulation environments.
In a third step, the trajectories are optimised with TOMATO using only the city pairs, departure times and aircraft types provided by the so6 m3 flight plan file. For the optimised trajectories, the take-off phase is realised with maximum thrust, the climb phase is split into an initial climb phase with a maximum climb angle below the transition altitude of 1,000 ft and in a climb phase with a maximum climb rate above 1,000 ft. An acceleration phase during climb is not necessary. During cruise, the target function follows a maximum specific range and during descent, the lift to drag ratio is maximisedReference Rosenow and Fricke 59 . Both the validated reference scenarios and the optimised trajectories are assessed by the following parameters: total fuel burn, total time of flight, total distance flown, controller’s taskload and number of conflicts. Figure 1 indicates the procedure of the case study, including the input data function and analysed results of both simulation environments.
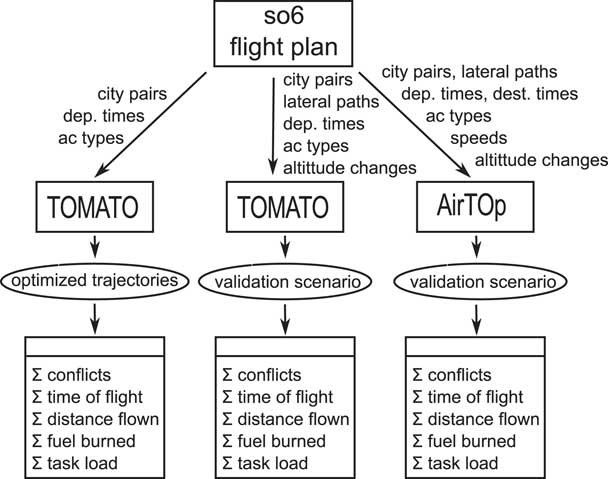
Figure 1 Procedure of the study indicating data source, programs and analysed results.
2.2 TOMATO simulation environment
The TOMATO is briefly described by Förster et al.Reference Förster, Rosenow, Lindner and Fricke 60 and Rosenow et al.Reference Rosenow, Förster, Lindner and Fricke 5 , Reference Rosenow, Förster, Lindner and Fricke 20 . The trajectories are assessed by several KPIs covering safety, efficiency and ecological compatibility. All indicators are transformed into costs, enabling TOMATO to iteratively find the global optimum by changing the allowed input variables e.g. the cruising altitude, the target function for climb and descent rates, the target function for speed or the weight of different KPIs, considering real weather conditions, given as global forecast. However, the optimum is restricted in the timely and spacial resolution within the model. The trajectories are calculated one by oneReference Rosenow, Förster, Lindner and Fricke 5 , Reference Rosenow, Förster, Lindner and Fricke 20 , Reference Förster, Rosenow, Lindner and Fricke 60 . Different cost components of grouped KPIs, the quantified emissions, contrail costs and some flight performance measures for the inspection of a successful calculation of the aspired profile are summarised for each trajectory. Furthermore, each 4D trajectory is output with a variable temporal resolution, in this case study with Δt=1 s, which is also the internal computation time step. Depending on the provided weather data, TOMATO deals with a variable spatial resolution, because the accuracy of calculation does not increase with a linear interpolation between the grid point, providing weather informationReference Förster, Rosenow, Lindner and Fricke 60 . In this case study, weather data are taken from the global forecast system model provided by the National Oceanic and Atmospheric Administration 61 with a spatial resolution of Δx=0.25°. Figure 2 gives an overview over the workflow in TOMATO. The resultant air traffic flow can be analysed with measures such as airspace capacity, controller’s taskload and number and characteristics of separation infringements. Therewith, the ATFM can be assessed and compared with the reference scenarioReference Rosenow, Förster, Lindner and Fricke 20 – Reference Rosenow, Fricke and Schultz 22 . Until now, conflict resolution is not implemented in TOMATO because, each trajectory is individually optimised and because the computational effort has already reached the limits of a personal computer.
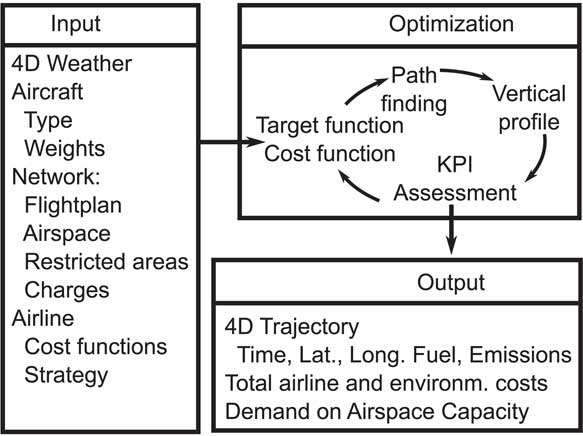
Figure 2 Workflow in TOMATO simplified to the most important parameters and modules.
2.3 AirTOp air traffic simulator
The fast-time air traffic simulator AirTOp generates trajectories in a dynamic airspace structure and iteratively considers conflict detection and conflict resolutionReference Luchkova, Vujasinovic, Lau and Schultz 25 . AirTOp is able to manage reroutings around dynamic airspacesReference Luchkova, Kaltenhaeuser and Morlang 26 and to estimate their influence on the air traffic systemReference Kreuz, Luchkova and Schultz 27 . It is a multifunctional and modular platform for the simulation of gate-to-gate air traffic flows, considering planned 4D trajectory synchronisation and negotiation as well as airspace planned entry load and occupancy monitoring 24 . The airspace analysis regarding the parameters time of flight, distance flown, fuel burned, occupancy, controller’s taskload, altitude changes and number of conflicts is based on an ATC sector-specific airspace structure consisting of 632 flight information regions (FIR) of different size. Therein, conflicts are defined as separation infringements of 5 NM in the lateral direction and 1,000 ft in the vertical direction. The results are calculated per hour with a calculation time of 2s. The minimum period of time of the separation infringement for the definition of a conflict is variable and set to Δt=1 s to be comparable with the conflict detection algorithm of TOMATO. Due to the irregular airspace structure in AirTOp, a comparison of the spatial distribution of air traffic density or air traffic complexity over Europe is not possible between TOMATO and AirTOp. However, considering the same city pairs, aircraft types, cruising altitudes and altitude changes, the spatially integrated results can be compared between both models. When deconfliction is activated, different rerouting algorithms are implemented to calculate trajectories in deviation from the planned trajectories to ensure individual user defined requirements. Thereby, the conflict resolution is realised iteratively, until a possible solution for the whole ATFM is reached. However, for the sake of comparability, in this case study, deconfliction is deactivated.
3.0 ComPARISON OF TOMATO AND AIRTOP USING THE VALIDATION SCENARIO
In this paper, the simulation environment TOMATO has been prepared for a comparison of the simulated reference scenario with the reference scenario simulated with the commercial air traffic simulator AirTOp. The results are surprisingly equal (compare Table 1), although not all input parameters and all sub-models of AirTOp are known in detail by the authors. Therewith, the validity of TOMATO can be proven. Both models simulated 8,800 flights with cruising pressure altitudes above 250 hPa (upper airspace). Although the internal computation time of AirTOp is unknown to the authors (nor can it be assumed that there are uniform computation time steps of all partial models), the number of potential conflicts (i.e. separation infringements of 5 NM laterally and 1,000 ft vertically) is in the same order of magnitude for both models. It has to be noted that the flight performance model COALA within TOMATO has difficulties in dealing with predefined speeds at given waypoints, because it considers acceleration forces and unsteady flight attitudesReference Rosenow and Fricke
59
at each computation time step. This is why the real speeds, given by the so6 m3 flight plan, cannot be used as input parameters for COALA. Instead the target speed is internally calculated for a maximum specific range and controlled by the lift coefficient as controlled variableReference Rosenow and Fricke
59
. These speeds are obviously similar to the true air speeds given in the flight plan. This is why the integrated time of flight is very similar in both model approaches (compare Table 2). Due to predefined lateral paths, the integrated distance flown is very similar as well. From this follows that the spatial and temporal resolution of TOMATO (0.25° and 1s, compare Section 2.2) are sufficient or at least similar to those used by AirTOp. Both models use the BADA
62
,
63
provided by EUROCONTROL for the estimation of the fuel burn. For this case study, AirTOp relies on the BADA version 3
62
, whereas TOMATO uses the BADA Family 4
63
whenever possible. Performance data of aircraft which are not covered by BADA 4 are estimated with BADA 3. Nevertheless, both fuel burn estimations are very similar (with differences of
 $$\Delta \dot{m}_{f} {\equals}1.73\,\%\,$$
) and do not differ by more than the accuracy (i.e.
$$\Delta \dot{m}_{f} {\equals}1.73\,\%\,$$
) and do not differ by more than the accuracy (i.e.
 $$\Delta \dot{m}_{{f,{\rm BADA}}} {\equals}5\,\%\,$$
) of the BADA flight performance dataReference Poles, Nuic and Mouillet
64
.
$$\Delta \dot{m}_{{f,{\rm BADA}}} {\equals}5\,\%\,$$
) of the BADA flight performance dataReference Poles, Nuic and Mouillet
64
.
Table 1 Comparison of TOMATO and AirTOp regarding the integrated results describing the simulation of 8,800 trajectories and their impact on the ATFM

Table 2 Comparison of TOMATO’s simulated real flights as reference scenario (compare Table 4) and TOMATO’s multicriteria optimised trajectories; 8,800 city pairs, departure times and aircraft types on 17 May 2017, between 12 a.m. and 1 p.m. with cruising pressure altitudes above pcruise=250 hPa and their integrated impact on the ATFM are simulated and optimised. Additionally, the lateral path and altitude changes are used as input parameters for the reference scenario

Large differences in the resultant controller’s taskload between both models indicate uncertainties in the calculation of the controller’s taskload in AirTOp, which could not be cleared completely. It could be determined that AirTOp models the controller’s taskload for conflict resolution in more detail, considering the type of conflict (i.e. the heading, speeds and altitudes of involved aircraft within an FIR). TOMATO assumes constant heading and altitude changes and the number of aircraft per artificial airspace defined by a grid consisting of geographical co-ordinates with a spacial resolution of Δx taskload=1° Reference Rosenow, Fricke and Schultz 22 (compare Fig. 3). For each artificial airspace, TOMATO calculates the controller’s taskload proportional to the number of aircraft within this airspace and does not consider the actual number of separation infringements in this airspaceReference Rosenow, Fricke and Schultz 22 . From this follows that the controller’s taskload cannot be compared between both models.

Figure 3 Airspace structure used for the calculation of the results relevant for the ATFM of TOMATO (left) and AirTOp (right). With TOMATO, the airspace capacity (i.e. number of aircraft per airspace hour), numbers of potential conflicts and controller’s taskload are calculated per artificial airspace defined by 1° latitude times 1° longitude (resulting in 30–60 nautical miles, depending on latitude), whereas flight information regions with non-equal shape and size are used in AirTOp.
4.0 IMPACT OF OPTIMISED TRAJECTORIES ON THE ATFM
With the simulation and comparison of the reference scenario with both models, two important steps have been completed. On the one hand, the simulation environment TOMATO is validated and numerical variables such as spatial and temporal resolution are assessed (compare Section 3). On the other hand, the reference scenario enables a comparison of those conventionally filed flight paths with 4D-optimised free route trajectories, which have been calculated with TOMATO in a second step. Especially the impact of those optimised trajectories on the ATFM is compared with the impact of the conventionally filed trajectories. Figure 4 indicates a more complex airspace in the reference scenario due to a more heterogeneously distribution of aircraft per artificial airspace. Up to 58 aircraft per artificial airspace and hour are simulated over central Europe in the reference scenario (indicated by the black contours in Fig. 4), whereas free routes follow their individually optimised trajectories yielding a maximum number of 42 aircraft per artificial airspace and hour. These optimised trajectories depend on the aircraft type and mass-specific flight performanceReference Rosenow, Förster and Fricke 18 , Reference Rosenow and Fricke 59 . Furthermore, non-constant air speeds and cruising altitudes spread the aircraft more widely within the airspace and therewith increase the possible airspace capacity (i.e. maximum number of aircraft, integrated over the whole European airspace)Reference Rosenow and Fricke 21 , Reference Rosenow, Fricke and Schultz 22 although wind speed and wind direction are considered in the optimisation function, amongst others.

Figure 4 Heat map of airspace capacity (i.e. number of aircraft per artificial airspace defined by 1° latitude and 1° longitude) during 1 h between 12 a.m. and 1 p.m. on 17 May 2017, above Europe (between 30° and 68° latitude and –15° and 45° longitude). Left: TOMATO simulated historical data of 8,800 real flights, right: TOMATO optimised these trajectories considering the requested city pairs, aircraft types and departure times. Colours of dark blue, light blue, green, yellow, orange, red and black indicate 0, 10, 20, 30, 40, 50 and 60 aircraft/h and artificial airspace, respectively.
In the scenario of optimised trajectories, 1,637 artificial airspaces out of 2,739 (61° longitude times 39° latitude) artificial airspaces are used by aircraft during this hour, whereas in the reference scenario, only 1,554 artificial airspaces out of 2,739 artificial airspaces are used (compare Fig. 4). Nevertheless, the proportion of crowded airspaces has dropped in the optimised scenario as well and the maximum number of aircraft per hour and artificial airspace decreased significantly.
Figure 4 indicates a more equally distributed airspace capacity. Aircraft are in conflict for a significantly shorter time and distance (compare Table 2). Due to a real flight plan as reference scenario, longitudinal separation infringements can be excluded. Permanently changing speeds, altitudes and headings eliminate longitudinal separation infringements in the optimised scenario as well.
Nevertheless, a smaller integrated controller’s taskload is generated in the optimised scenario, because of fewer artificial airspaces with serious overload, which is more than 2,520 s or 70% of the controller’s work hour. Whereas 207 airspaces with a taskload have been simulated in the reference scenario, only 188 cells with taskload of more than 2,520 s in the optimised scenario result in a less complex ATFM when aircraft are allowed to follow their optimised flight paths. From this follows that airspace capacity would increase with the implementation of FRAs. In the reference scenario, the taskload exceeds values of 8,265 s/h and artificial airspace, whereas the maximum taskload in the optimised scenario reaches 5,987 s (compare Fig. 5). Specifically, Figure 5 indicates a more widely spread controller’s taskload in the optimised scenario during the estimated peak hour, which enables an implementation of a dynamic airspace sectorisation, as proposed by Gerdes et al.Reference Gerdes, Temme and Schultz 65 However, the controller’s taskload could increase spontaneously, a problem which probably may not be solved by a dynamic airspace sectorisation and needs reliable aircraft self-separation techniques and decision support systems for the ATC.
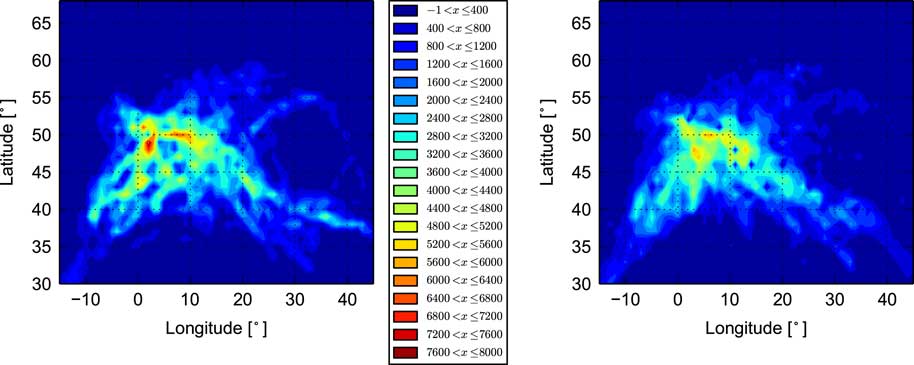
Figure 5 Heatmap of controller’s taskload per artificial airspace and hour between 12 a.m. and 1 p.m. on 17 May 2017, above Europe. Left: TOMATO simulated historical data of 8,800 real flights, right: TOMATO optimised these trajectories, considering the requested city pairs, aircraft types and departure times. Colours of dark blue, light blue, green, yellow, orange, red and black indicate 0, 1,500, 2,800, 4,100, 5,400, 6,700 and 8,000 s, respectively.
TOMATO’s trajectory optimisation has a positive impact on the spatial distribution of potential conflicts as well, because those conflicts are spread more widely over the European airspace and the number of conflicts per hour and artificial airspace could be reduced from 12 in the reference scenario to 9 in the optimised scenario (Fig. 6). From this follows that preferred flight paths are in neighboured airspaces but do not essentially use the same artificial airspace, when 4D free routes are implemented. This has a positive effect on the ATFM-related KPI Capacity utilisation, because high demanded airspaces above central Europe would be used more efficiently.
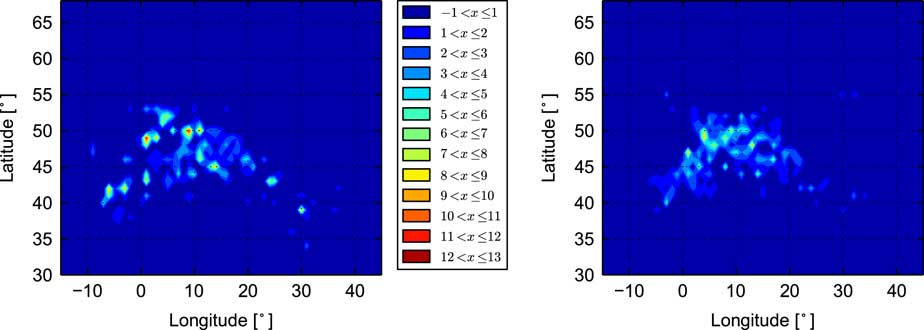
Figure 6 Heat map of the number of potential conflicts (separation infringements of 5 NM in the lateral and 1,000 ft in the vertical direction) per artificial airspace and hour between 12 a.m. and 1 p.m. on 17 May 2017, above Europe. Left: TOMATO simulated historical data of 8,800 real flights, which have been tracked in the upper European airspace between 12 a.m. and 1 p.m, right: TOMATO optimised these trajectories considering the requested city pairs, aircraft types and departure times. Colours of dark blue, light blue, green, yellow, orange, red and black indicate 0, 2, 4, 6, 8, 10 and 12 potential conflicts, respectively.
Airline KPIs such as number of planes and employees, revenue passenger miles, number of departures and passengers and available ton-miles Reference Rai 17 cannot be quantified, because they are used as input parameters (defined in the so6 m3 flight plan) for the simulation. However, KPIs describing efficiency, safety and environmental compatibility can be quantified by the following measures: efficiency includes fuel costs, direct operating costs and time costs (e.g. crew costs, delay costs, overfly charges (ATC costs), amongst others) and could be reduced by 40% (compare Table 2) due to significant savings in fuel burn and ATC costs. The KPI environmental compatibility summarises the aviation impact on the environment (i.e. the contribution to the imbalance of the energy budget of the earth–atmosphere system caused by radiative active emissions and condensation trails) and depends on the emissions quantities, altitudeReference Myhre, Shindell, Bréon, Collins, Fuglestvedt, Huang, Koch, Lamarque, Lee, Mendoza, Nakajima, Robock, Stephens, Takemura and Zhang 66 , latitudeReference Skowron, Lee and De León 40 , Reference Myhre, Shindell, Bréon, Collins, Fuglestvedt, Huang, Koch, Lamarque, Lee, Mendoza, Nakajima, Robock, Stephens, Takemura and Zhang 66 , time of the day and headingReference Rosenow, Förster, Lindner and Fricke 20 , Reference Rosenow 67 and could be reduced by 28% (Table 2), mainly through reduced fuel burn and the consideration of the latitude-dependent environmental costs in the lateral path finding. The KPI safety is considered in the flight performance model COALA and additionally represented by the number of potential conflicts, which also could be reduced by 4.5% (Table 2), although the free route concept is applied in the optimised scenario.
The ATFM-related KPIs capacity utilisation, complexity, traffic variability and productivity can be approximated by the simulation of the time-dependent and spatial variation of the controller’s taskload, the number of potential conflicts and the shape of the individual trajectories (altitude changes, heading changes and speed changes). Although the optimised trajectories consist of continuous changes in altitude, heading and speed, the taskload could be reduced by 5.2% in the optimised scenario.
5.0 CONCLUSION
The aim of this paper was to optimise a conventionally filed flight plan (i.e. a reference scenario) and compare the induced impact on the ATFM with a simulation of multicriteria optimised trajectories. Thereby, significant differences between the reference scenario and the optimised scenario could be identified. Specifically, fuel burn, ATC charges and the environmental impact of the aircraft trajectories could be reduced, when the trajectories were optimised as 4D free routes. Even the controller’s taskload could be reduced, through rescinded constraints given by waypoints in the reference scenario. The latter and the strong impact of wind direction and wind speed cause interesting differences in the patterns of the optimised lateral trajectories in the airspace with significant influence on the airspace capacity and controller’s taskload.
This study suggests that even in the European airspace during a peak hour between 12 a.m. und 1 p.m. Greenwich Mean Time, SESAR’s proposed 4D free route concept is possible with a positive impact on both airline and ANSP efficiency and on the environmental compatibility. Integrated over the whole European airspace, the 4D free route concept has a further positive effect on safety, because the aircraft are more equally distributed, resulting in a reduced controller’s taskload. Highly overloaded airspaces are avoided and more airspaces are used by aircraft. However, although the number of conflicts is reduced, the remaining conflicts are much more complex and difficult to solve.
Acknowledgements
This research is financed by the Federal Ministry of Economic Affairs and Energy in the framework of the research project ProfiFuel. The authors would like to thank Stanley Förster and Martin Lindner for technical support in the post analysis of the optimised trajectories.


 Open access