

Introduction
Policy making often depends on sound analysis of policy alternatives to evaluate likely outcomes. Given an array of policy questions concerning ecosystem services, and climate change mitigation and adaptation, federal forest policy makers and managers need relevant and timely economic metrics and analyses for evaluating policy alternatives using the best data and methods currently available (e.g., Kline et al. Reference Kline, Mazzotta, Spies and Harmon2013). Although developing sound economic analysis and valuation methodologies is a necessary first step in this process, it is also important to demonstrate whether existing data and methods permit conducting applied analysis of policy questions given staffing and other resources at hand. In line with U.S. Department of Agriculture (USDA) workshop objectives to “explore new methods, data, and approaches to valuing ecosystem services and applying the results to Federal programs and policies” (https://www.fs.fed.us/esv2019/), our focus in this article is to demonstrate applied analysis of USDA policy alternatives focused on increasing carbon sequestration in U.S. forests, to support policy analysis and program development.
Forests of the United States sequester significant amounts of atmospheric carbon. According to the 2017 Inventory of U.S. Greenhouse Gas Emissions and Sinks (U.S. Environmental Protection Agency 2017), 272 million hectares of forest land in the coterminous 48 states and southeast and south-central Alaska sequestered 571.1 Tg CO2eq through forest growth in 2015 alone. This amount equaled 8.7% of total U.S. carbon emissions that year (6,586.7 Tg CO2eq). Should the United States opt to implement a domestic greenhouse gas reduction strategy, improvements in forest management and increases in forest land are likely to play prominent roles in any cost-effective policy portfolio (Jackson and Schlesinger Reference Jackson and Schlesinger2004; Lubowski, Plantinga, and Stavins Reference Lubowski, Plantinga and Stavins2006). Proposed USDA programs seeking to improve forest sequestration include using financial and other incentives to protect private forest land from development, increase afforestation of marginal agricultural lands, and improve the management of nonindustrial forest lands (Lewandrowski et al. Reference Lewandrowski, Peters, Jones, House, Sperow, Eve and Paustian2004; McKinley et al. Reference McKinley, Ryan, Birdsey, Giardina, Harmon, Heath and Houghton2011). The degree to which policy alternatives such as these would lead to significant increases in carbon sequestration has been of significant policy interest, leading to a significant body of research examining carbon sequestration potential is the United States with a focus on interactions between policy, prices, land-use change, and other factors (e.g., Alig et al. Reference Alig, Adams, McCarl, Callaway and Winnett1997, Reference Alig, Latta, Adams and McCarl2010; Adams et al. Reference Adams, Alig, McCarl, Callaway and Winnett1999; Stavins Reference Stavins1999; Newell and Stavins Reference Newell and Stavins2000; Lewandrowski et al. Reference Lewandrowski, Peters, Jones, House, Sperow, Eve and Paustian2004; Murray et al. Reference Murray, Sohngen, Sommer, Depro, Jones, McCarl, Gillig, DeAngelo and Andrasko2005; Lubowski, Plantinga, and Stavins Reference Lubowski, Plantinga and Stavins2006; Latta et al. Reference Latta, Adams, Bell and Kline2016).
In this article, we focus on demonstrating how existing data and models, based on this body of previous research, can be used to conduct routine policy analysis to support USDA policy and program development and applications. Rates of forest carbon sequestration are forecast to slow in coming decades because of forest aging, disturbance, and overall reductions in forest land because of development (Wear and Coulston Reference Wear and Coulston2015). These uncertainties point to a continued need for economic evaluation of policy alternatives currently under consideration to facilitate further development and implementation of strategies for sequestering and mitigating greenhouse gases in the United States. For such analysis to be routinely incorporated into policy decisions, it must be of sufficient conceptual and methodological rigor to reasonably address key factors in land-use and carbon interactions and dynamics, while allowing for timely development of applications by USDA staff that meet the needs of policy makers.
With these objectives in mind, we estimated the amount of additional carbon sequestration, as well as the dollar value of associated carbon benefits, likely to result from policy alternatives included in the proposed USDA programs. Specifically, we use existing data and models to project national-level estimates of forest carbon sequestration and its value for the period 2015–2050, for a baseline scenario representing business as usual, and for three policy scenarios: (1) a land-use policy to reduce deforestation from development; (2) an afforestation policy targeting rural landowners in the eastern United States and a reforestation policy targeting understocked federal forest lands in the western United States; and (3) a policy reducing stand-replacing fire events by 10%. For each policy scenario, we first developed forecasts of increased carbon sequestration projected to result from implementation of each policy alternative. We then estimated the dollar value of the increased carbon sequestration using estimates of the social cost of carbon (SCC), which is the present value of monetized damages associated with an additional ton of carbon dioxide emissions. Finally, we compared our estimates of carbon sequestration benefits with rough estimates of the likely costs of implementing each policy alternative examined. A diagram of our modeling framework is shown in Figure 1, using an afforestation/reforestation program as an example.

Figure 1. Conceptual Diagram Connecting Actions, Ecological Outcomes, and Dollar Values
We used models of forest dynamics and land-use change to forecast our national-level estimates of forest carbon stocks and fluxes. These models were previously developed by Coulston, Wear, and Vose (Reference Coulston, Wear and Vose2015) and Wear and Coulston (Reference Wear and Coulston2015) for The U.S. Forest Carbon Accounting Framework (Woodall et al. Reference Woodall, Coulston, Domke, Walters, Wear, Smith and Andersen2015). The models were subsequently used for the 2016 Second Biennial Report of the United States of America, Under the United Nations Framework Convention on Climate Change (U.S. Department of State 2016) to forecast forest carbon stocks and sequestration as part of an assessment of U.S. programs to meet 2025 carbon emissions targets. The forest dynamics module includes a stage-structured model of forest growth by forest type, combined with carbon stock models that estimate eight different carbon pools: down dead wood, forest floor, live trees aboveground, live trees belowground, standing dead wood, soil organic carbon, understory vegetation aboveground, and understory vegetation belowground. These models account for disturbances, including harvesting, wind, wildfire, and flooding. The land-use dynamics module was used to assess carbon stock transfers to and from forest land associated with afforestation and deforestation. The forecasting models project the forest stage distribution and carbon sequestration by forest type at the state and regional levels starting with 2015 forest stage distributions estimated from USDA Forest Inventory and Analysis (FIA) plots. The key feature of our approach is that the initial carbon stock and parameters of the forecasting models are estimated from observations of forest attributes in FIA inventory plots throughout the United States during the period 1990–2015 (Woodall et al. Reference Woodall, Coulston, Domke, Walters, Wear, Smith and Andersen2015).
For comparison, carbon sequestration in the U.S. forest sector more typically has been forecast using structural dynamic economic models that allow price endogenous forest management and land-use choices (e.g., Adams et al. Reference Adams, Alig, McCarl, Callaway and Winnett1999; Sohngen and Mendelsohn Reference Sohngen and Mendelsohn2003; Latta et al. Reference Latta, Baker, Beach, Rose and McCarl2013; Tian et al. Reference Tian, Sohngen, Baker, Ohrel and Fawcett2018). In these models, future harvest levels, replanting rates, and intensity of replanting are determined to maximize the present value of consumer and producer surplus subject to forest age class dynamics. Carbon stocks in forest and wood products pools are computed from the forest age structure and harvest levels that result from optimization. These models simulate the impacts of alternative policies on carbon sequestration (e.g., Tian et al. Reference Tian, Sohngen, Baker, Ohrel and Fawcett2018) or determine policies that minimize the social cost of achieving a desired level of sequestration (e.g., Adams et al. Reference Adams, Alig, McCarl, Callaway and Winnett1999). A key feature of these models is that they allow for carbon stocks to be an outcome of endogenous forest management and land-use decisions, which in turn depend on endogenous prices. However, their resulting aggregate forecasts of forest conditions may not be as precise as forecasts based on observations of individual plots. Moreover, such models require estimation of many additional economic parameters. Our alternative approach thus takes advantage of the additional information provided by individual FIA plots, while avoiding the necessity of developing estimates of additional economic parameters.
Additionally, economists have long called for developing dollar estimates (or pricing) of carbon to reflect the social damages associated with the adverse impacts resulting from carbon dioxide emissions on the global climate (see Aldy et al. [2010] for a review). For policy makers, estimates of this SCC can be used to monetize the benefits of reduced carbon emissions associated with incremental investments in climate change mitigation programs. Comparing the dollar value of carbon emission abatement to likely mitigation program costs enables policy makers to determine which proposed programs are likely to yield net benefits to society. However, estimating the SCC can involve contentious issues, including how to evaluate adverse climate impacts, extreme climate risks, and intergenerational discounting (Aldy et al. Reference Aldy, Krupnick, Newell, Parry and Pizar2010). To address these issues, the U.S. government tasked an Interagency Working Group on the Social Cost of Carbon with developing a transparent and economically rigorous way to value reductions in CO2 emissions resulting from federal programs (Greenstone, Kopits, and Wolverton Reference Greenstone, Kopits and Wolverton2013). These estimates have been integrated into the evaluation of rules and programs (those with costs or benefits above $100 million in any given year) across several federal agencies (Greenstone, Kopits, and Wolverton Reference Greenstone, Kopits and Wolverton2013). We used these estimates to develop our dollar value estimates of likely program benefits resulting from increased carbon sequestration in U.S. forests.
Policies that increase carbon sequestration on forest lands or the expansion of private forest lands via afforestation would likely influence the provision of other valued ecosystem services, including water quality, habitat for terrestrial and aquatic species, and timber, to name a few. In particular, increasing carbon sequestration potentially would increase the provision of complementary ecosystem services and decrease competitive services (e.g., Englin and Callaway Reference Englin and Callaway1995; Kline et al. Reference Kline, Harmon, Spies, Morzillo, Pabst, McComb, Schnekenburger, Olsen, Csuti and Vogeler2016). Although enhancing valued ecosystem services has long been a goal of USDA policies and programs (e.g., Claassen et al. Reference Claassen, Hansen, Peters, Weinberg, Breneman, Cattaneo and Feather2001), we do not address associated changes in other ecosystem services and instead focus on a key component of an overall climate change strategy: increasing forest carbon sequestration to mitigate climate change.
We begin with an overview of the estimates of the SCC. Then, we describe the two primary tasks needed to evaluate the benefits of increased carbon sequestration associated with changes in USDA policy: (1) projecting forest carbon stocks and fluxes over time for the baseline and alternative policy scenarios, and (2) estimating the value per ton of carbon sequestered over time. We present the results of our analysis followed by a discussion of caveats. Finally, we present our conclusions.
The Social Cost of Carbon
Carbon sequestration on U.S. forest land is valuable because carbon that would otherwise be emitted into the atmosphere as CO2 is instead trapped in living trees, thereby mitigating climate change and its damages. Reducing or avoiding the economic damages associated with carbon emissions are key economic benefits of carbon sequestered in forests. Because the value of carbon sequestration involves avoided social costs, the unit value of a ton of carbon dioxide sequestered is typically referred to as the SCC and is measured in dollars (e.g., U.S. dollars per ton of CO2 sequestered).
Economists typically use integrated climate-economy simulation models—called integrated assessment models—to estimate the SCC. Three of the more commonly used models are the dynamic integrated climate economy (DICE) model (Nordhaus Reference Nordhaus1992); the climate framework for uncertainty, negotiation and distribution (FUND) model (Tol Reference Tol1999); and the policy analysis of the greenhouse effect (PAGE) model (Hope, Anderson, and Wenman Reference Hope, Anderson and Wenman1993). Each model estimates the SCC for a given year of a defined time horizon while accounting for likely damages to agricultural productivity, human health, and property, as well as ecosystem services, at spatial scales ranging from regional to global. According to convention, the SCC in any given time period during which carbon is emitted is a nominal value that measures the economic cost of future damages discounted to that period. Estimating the SCC therefore requires the selection of a discount rate that reflects societal impatience and the effect of output growth over time (Arrow et al. Reference Arrow, Cropper, Gollier, Groom, Heal, Newell and Nordhaus2014).
In 2009, the U.S. government convened an interagency working group to estimate the SCC over time (Greenstone, Kopits, and Wolverton Reference Greenstone, Kopits and Wolverton2013). The working group assumed a global perspective and estimated the SCC using the three major integrated assessment models, three discount rates, and five socioeconomic scenarios. Focusing on a global SCC was deemed appropriate, because climate change is, of course, a global problem. Perhaps for this reason, in its report recommending revisions to SCC estimation methodologies, the National Academies of Sciences, Engineering, and Medicine (2017) does not recommend using a country-specific SCC. Indeed, it finds that even defining a country-level SCC would be very difficult.
One recommendation of the National Academies of Sciences, Engineering, and Medicine (2017) is to use a more theoretically motivated discount rate based on the so-called Ramsey formula (Ramsey Reference Ramsey1928) that is amended to take into account uncertainties in future capital productivity and potential linkages between productivity and climate change.Footnote 1 This recommendation is in contrast to the discount rate sensitivity analysis approach used by the interagency working group. As discussed by Arrow et al. (Reference Arrow, Cropper, Gollier, Groom, Heal, Newell and Nordhaus2014) and elsewhere, if implemented, this revision would imply a declining discount rate as a function of time and almost assuredly a lower average discount rate than the 3% preferred scenario discount rate discussed subsequently and used in this article.
The interagency working group recognized that projections of Earth's average surface temperature increase associated with a doubling of CO2 concentrations in the atmosphere are highly uncertain and modeled this uncertainty with an appropriate probability distribution. Because this climate sensitivity parameter was modeled probabilistically, the group used stochastic simulation to produce a distribution of SCC values for each year to 2050. This exercise produced 45 separate distributions of the SCC for a given year—one for each model, discount rate, and socioeconomic scenario.
To produce a range of plausible estimates, the distributions from each of the models and socioeconomic scenarios were weighed equally and combined to produce three separate probability distributions for the SCC in a given year, one for each of the three discount rates. The average of each distribution was taken as the point estimate of the SCC. For example, the nominal 2010 SCC was $21 per additional ton of CO2 emitted measured in 2007 U.S. dollars and computed with a 3% discount rate. The SCC estimates were revised in 2013 and again in 2015 using updated versions of the DICE, PAGE, and FUND models.
For our calculations, we used estimates of the SCC from the 2015 interagency working group report (U.S. Interagency Working Group on Social Cost of Carbon 2015). Columns 2–4 of Table 1 show the estimates of the nominal, average SCC (2016 U.S. dollars per ton of CO2 sequestered) over time for discount rates from 5%, 3%, and 2.5%. The SCC estimates increase over time because CO2 concentrations in the atmosphere are expected to rise, and higher concentrations imply greater damages from each additional ton emitted. Because sequestering carbon in the future mitigates more damages than sequestration in the present, the estimated value of sequestering CO2 increases over time. Column 5 of Table 1 uses the 95th percentile of the distribution of SCC estimates and a 3% discount rate. This scenario shows what would happen to the SCC if the climate-changing effects of CO2 emissions turn out to be much stronger than expected. In this SCC scenario, economic damages are larger and SCC estimates are three times greater than average estimates for a 3% discount rate.
Table 1. Nominal Social Cost of Carbon (SCC) Estimates (2016 U.S. dollars per ton of CO2 sequestered)

Source: U.S. Interagency Working Group on Social Cost of Carbon (2015). SCC estimates from the interagency working group were reported in 2017 U.S. dollars. We inflated those values to 2016 U.S. dollars using the consumer price index from the Bureau of Labor Statistics.
Estimates for the SCC have been made in other countries, and most are higher than the U.S. values. Table 2 presents estimates over four time frames for select Organization for Economic Cooperation and Development countries reported as “carbon values” in Smith and Braathen (Reference Smith and Braathen2015). This table is for evaluation of public policies, but values (typically lower than in Table 2) are reported (though not for the United States) for transportation, energy, and other investments. Ricke et al. (Reference Ricke, Drouet, Caldeira and Tavoni2018) estimate country-level SCCs along with global figures and find that India has the highest SCC at $86 per ton of CO2 and the United States is second at $48 per ton.
Table 2. Carbon Values per Ton of CO2eq (2014 U.S. dollars) for Ex Ante Evaluations of Public Policies

Source: Smith and Braathen (Reference Smith and Braathen2015).
Quantifying and Projecting Forest Carbon
We start by estimating current (2015) carbon stocks and flux for the 264 million hectares of forest land in the coterminous 48 states. Our estimates rely on empirical data from the USDA Forest Service's FIA Program (Woodall et al. Reference Woodall, Coulston, Domke, Walters, Wear, Smith and Andersen2015). These data include measurements of live and dead trees, dead wood, forest litter, understory vegetation, and soils in more than 350,000 permanent plots across the coterminous 48 states. From these data, carbon densities (mg/ha) were predicted in each plot for eight carbon pools (live trees aboveground, live trees belowground, standing dead wood, down dead wood, forest floor, soil organic carbon, understory vegetation aboveground, and understory vegetation belowground) using models of the 2017 national greenhouse gas inventory (U.S. Environmental Protection Agency 2017). The carbon stock and annual carbon flux in year 2015 are 332,000 Tg CO2eq and 480 Tg CO2eq/yr., respectively (Woodall et al. Reference Woodall, Coulston, Domke, Walters, Wear, Smith and Andersen2015). The carbon flux in year 2015 is 16% less than the carbon flux (571.1 Tg CO2/yr.) reported in the 2017 Inventory of U.S. Greenhouse Gas Emissions and Sinks (U.S. Environmental Protection Agency 2017). In contrast to the 2017 inventory, we excluded Alaska from our projections and do not count the current transfer of soil carbon into the forest land base because of afforestation.
Our models for projecting forest carbon were developed by Coulston, Wear, and Vose (Reference Coulston, Wear and Vose2015) and Wear and Coulston (Reference Wear and Coulston2015). We projected forest carbon stocks and fluxes over a 35-year horizon (2015–2050). Forest carbon flux results from the net effects of carbon accumulations and emissions of standing forests, emissions from disturbances (e.g., fire, insects, weather, and harvest), and conversions of forest land to and from other uses. The largest share (~85%) of carbon flux occurs in standing forests, where carbon accumulation has long exceeded emissions from disturbances. Land-use changes generally result in concurrent gains or losses in forest area, with net gains accruing in the United States over the past 20 years (Oswalt et al. Reference Oswalt, Smith, Miles and Pugh2014).
To project forest carbon in the coterminous 48 states, we divided forest land into four regions—Pacific Coast, Rocky Mountain, North, and South (Figure 2). We modeled change in forest carbon in each region as the sum of the forest growth component, including disturbances, and a land conversion component. The projection models differ in the western and eastern United States because of differences in the intensity of permanent plot sampling.

Figure 2. Carbon Assessment Regions
Western Projection Model
In the western regions (Pacific Coast and Rocky Mountain) where forest sampling is less intense and repeated measures of forest plots are not available, we modeled carbon flux using a stage class model of forest population growth. We quantified and predicted changes in forest carbon at the state level except in California, Oregon, and Washington where we separated the states into areas on the western and eastern sides of the Cascade mountain divide because of vast differences in forest productivity. For each state/substate, we queried the FIA inventory for all plot records and stratified them by stage class i and forest type j. Each stage was defined by a 5-year age class (from age 1–5 to greater than age 200) for each of 27 forest types. From the plot records, we estimated the initial area (ha) F ij0 and carbon density (mg/ha) D ij of each stage and forest type. The estimate of current forest carbon for state/substates is the sum of the products of forest area and carbon density across stages and forest types:

We projected forest carbon in each state/substate using a stage-class model of forest dynamics. Given parameters p ij for the proportion of stage i forest type j that moves up one stage; d ij for the proportion of stage i and type j that is subject to stand-replacing disturbance by fire, insects, weather, or harvest; and L ijt for the area of land of stage i forest type j in period t that conversions to or from forest land use during projection interval t, the stage class model for each forest type is as follows:


for periods t = 0,…,T – 1. Equation (1) updates the area in of the youngest stage by subtracting the proportion of area that moves up one stage, adding all of the disturbed area across the forest, and adding the net change in forest land use (positive for net additions, negative for net subtractions). Equation (2) subtracts the areas that either move up one stage or are subject to stand-replacing disturbance, adds the area that moves up from the younger stage, and adds net change in forest land use. Equation (3) accumulates area in the oldest stage while accounting for changes because of disturbance and land use of the oldest stage. Given these dynamics, the time-sequence of total forest carbon for the state/substate is the following:

Simulations proceeded by applying equations (2) to (5) over the T-period horizon. Then, change in forest carbon during period t is as follows:

To apply the model, we made several assumptions about its parameter values. The average historical stand-replacing disturbance rate d ij was obtained by dividing the area of forest of type j currently in the youngest stage, F 1j0, by total forest area, $< . Assuming that the recent disturbance pattern leading to forest replacement carries into the future, we divided this average disturbance rate equally across stages. Note that d ij includes all events that reset the forest to the youngest stage including fire, weather, insects, and harvesting. We also estimated the average annual disturbance rate (percent of forest area) for each type of disturbance (Table 3). For example 8.2% of the forest area in the Pacific Coast region had some amount of forest cutting. Then, the harvested forest carbon was transferred to a durable forest product carbon pool, and the change in forest carbon associated with the harvested portion of disturbance was adjusted to account for carbon storage in wood products. From a subset of plots with repeated observations, we observed that not all of the plots moved up one stage every 5 years. Therefore, we defined a stage transition rate p ij of 0.85 for all stages. The values of L ijt, t = 1, …, T are defined for a set of projection scenarios (described subsequently). For net gains in forest area, we assumed that new forest is added to the youngest stage; for losses, we removed forest area proportionately across stages. We assumed that carbon density associated with each land-use conversion L ijtis limited to the soil organic carbon pool. Separate simulations were constructed for each of the 18 state/substate units, and results were summarized for Pacific Coast and Rocky Mountain regions.
Table 3. Disturbance Levels by Region and Disturbance Type

Eastern Projection Model
The projection models for the two eastern regions (North and South in Figure 2) are based on estimates of land use and forest stage transitions obtained from remeasured, permanent inventory plots in those regions. For each region, remeasured plots were grouped according to seven land-use change and disturbance classes: undisturbed forest remaining as undisturbed forest, nonforest to forest conversion, forest to nonforest conversion, cut forest remaining as forest, forest remaining as forest disturbed by fire, forest remaining as forest disturbed by weather, and forest remaining as forest disturbed by insects and diseases. Plots were not grouped by forest type, so we drop the index j. For each land-use and disturbance class (indexed by k), the observed transitions of plot conditions were used to estimate forest stage transitions p ik, forest disturbance proportions d ik, carbon density change by age class δD ik, and land conversions L ik0.
The primary disturbance in the east was cutting, where 12.7% and 7.0% of the forest area in the South and North, respectively, experiences some level of forest cutting over the remeasurement period (Table 3). Given assumptions about future land conversions (see the next section), L ikt, t = 1, …, T − 1, these parameters were used to update the forest age distribution, F iktt = 0, …, T − 1, for each disturbance class k using equations (2)–(4), and then compute the carbon flux for each region:

Projection Scenarios
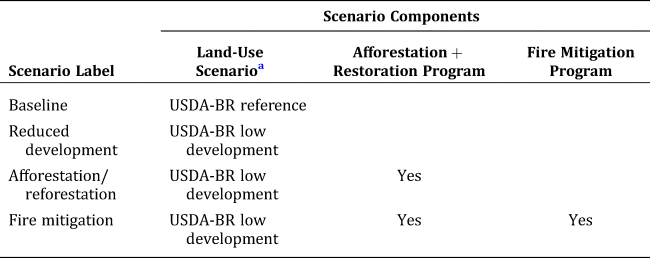
We projected carbon sequestration in each region under a baseline scenario and three alternative policy scenarios that are structured in an additive fashion (Table 4). The baseline scenario anticipates the elimination of net gains in forest area by 2025, followed by a slight decline in forest area through 2050, and represents assumptions developed for the 2016 U.S. biennial report (U.S. Department of Agriculture 2016).
Table 4. Definition of the Baseline and Policy Scenarios Used to Estimate the Present Value of the Increase in Forest Carbon Sequestration

a Land-use scenarios are from the 2016 U.S. biennial report by the U.S. Department of Agriculture (2016).
Note: See text for explanation of scenario components.
The first policy scenario—reduced development—assumes that land-use policies are implemented to reduce development intensities in future years, resulting in no net loss of forest area beginning in 2025. Current USDA projections anticipate increasing land development in response to a growing U.S. population and economy resulting in a net decline in forest area over the coming decades (e.g., USDA 2016), and so this policy alternative anticipates countering that trend.
The second policy scenario—afforestation and reforestation—assumes that landowner incentives can be implemented to encourage afforestation of private land in the eastern United States and funding is provided for reforestation of understocked federal forest land in the western United States, along with implementation of land-use policies to reduce development as described in the first policy scenario. In the eastern United States, the Conservation Reserve Program (CRP) currently funds the retirement of private marginal cropland to support conservation efforts, and the cap on program size has reached as high as 14.9 million hectares. In this second policy scenario, we assume in the eastern United States that a CRP-like program compensates landowners for establishing trees on 12.1 million hectares of marginal cropland between 2015 and 2020. Currently, in the western United States, 5.3 million hectares of forest land remains persistently understocked, of which 3.7 million hectares is federal forest land. We assumed that funding is provided for reforestation of 80% (3.0 million hectares) of the understocked federal forest land between 2015 and 2020.
The third policy scenario—wildfire mitigation—assumes a 10% reduction in the area of stand-replacing wildfires throughout the United States, along with the land-use and afforestation and reforestation policies. Wildfire causes significant releases of carbon and lateral transfer of carbon among pools followed by recapture of carbon by growing forests. Wildfire, therefore, is an important consideration in any overall carbon sequestration strategy.
Estimating the Value of Forest Carbon Sequestration
We estimated the present value (PV) of forest carbon sequestration associated with the baseline and three alternative policy scenarios in Table 4. The increase in PV under each of the three policy scenarios relative to the baseline scenario is an estimate of the dollar value of carbon sequestration under each policy scenario. Because the policy scenarios are structured in an additive fashion, we also report estimates of the incremental changes in the PV of each additional policy component. In this way, our analysis assumes that the effects of each policy component are strictly additive—that land-use policies would have the same incremental carbon sequestration effect if implemented on their own as if implemented along with an afforestation and reforestation policy, for example.
To compute the PV of the stream of carbon sequestration benefits under any one of the three alternative policy scenarios relative to a baseline scenario, we needed three sets of parameter values. Let $\Delta C_t^b$ and $\Delta C_t^p$
 be the Tg CO2eq sequestered in period t for the baseline and policy scenarios (based on equations 6 and 7, for the western and eastern regions). Let SCC t be the social cost of carbon ($ per ton CO2) in period t, which is the discounted value of the annual damage caused by 1 metric ton of CO2 released in period t, summed over the expected number of years that the unit of CO2 is present in the atmosphere, and discounted to period t. Let i be the discount rate used to discount the nominal values of SCC back to the base year t = 0. Then, the PVs of the baseline and policy scenarios (in millions of dollars), computed over a T-period planning horizon, are as follows:

The difference, PVp – PVb, is our estimate of the additional value of carbon sequestered under each policy scenario. This difference in PV assumes that the activities and resulting carbon sequestration in the policy scenario are additive, reducing atmospheric CO2 beyond what would occur without the policy.
Further, we assumed that activities to promote carbon sequestration in the policy scenario do not affect activities and carbon emissions in other sectors (i.e., no leakage). For example, leakage occurs when afforestation policy converts marginal agricultural land to forest but simultaneously results in the conversion of forest to agriculture in other areas (beyond the amount specified by the transition probabilities) to make up for portions of the afforested agricultural land. When our assumption of no leakage is violated, our estimate of the difference, PVp – PVb, is an overstatement of the value of the policy to promote forest carbon sequestration. We note that we have not considered the costs of implementing and administering any of the alternative policies considered; we are only valuing the benefits of carbon sequestration and will consider the implications of this approach in our later discussion.
We computed the PVs of the baseline and three alternative policy scenarios (Table 4) using projections of annual carbon sequestration (Tg CO2eq/yr., 2015–2050). For each of the reference and policy scenarios in Table 4, we made four PV calculations using the four SCC scenarios in Table 1. First, for each SCC scenario, we computed annual SCC levels ($/t C02) for the years 2015–2050 by interpolating between the SCC estimates for the 5-year intervals in Table 1. We then multiplied the projections of annual carbon sequestration and SCC together, discounted each product to the base year, and summed to get total PV (in millions of dollars).
Results
Forest Carbon Projections
Our results project annual carbon sequestration for the baseline scenario to decline from 480 Tg CO2eq/yr. in 2015 to 323 Tg CO2eq/yr. by 2050, largely because of the combination and interaction among forest aging, forest disturbance, and land-use change (Figure 3). This projected decline is projected in all four regions of the United States. Projections indicate that carbon sequestration by 2050 would be 85% of 2015 levels in the North, 65% of 2015 levels in the South, and 68% of 2015 levels in the Pacific Coast region. Sequestration in the Rocky Mountain region is projected to decline to near zero by 2030 and is slightly negative thereafter, suggesting that forests in this region become sources of carbon emissions because of disturbances such as wildfire and insect infestations. Nationally, projections suggest that 80% or more of baseline carbon sequestration would occur in the eastern U.S. forests.

Figure 3. Projected Annual Forest Carbon Sequestration in Regions of the Coterminous 48 States
Our projections indicate that implementing land-use policies to reduce development (resulting in no net loss in forest area beginning 2025) would increase the annual rate of forest carbon sequestration in all four regions relative to the baseline scenario (Figure 3). The largest gains in annual sequestration rates relative to the baseline would occur in the Rocky Mountain region, at 10–40 Tg CO2eq/yr. after 2025. These gains in the Rocky Mountain region keep the region from going to a net source of CO2 emissions beyond 2030 (which is the case under the reference scenario). In 2050, the sum of the annual sequestration rates across all four regions would increase from 323 Tg CO2eq/yr. in the baseline scenario to 362 Tg CO2eq/yr. in the reduced development scenario. Despite these projected regional gains in sequestration relative to the baseline, nationwide annual carbon sequestration under the reduced development is projected to decline throughout the United States over the time period examined.
Policy intervention to increase afforestation and reforestation, in addition to the policy to reduce development, would greatly increase annual carbon sequestration relative to the baseline scenario. By 2050, total annual sequestration would increase from 323 Tg CO2eq/yr. in the baseline scenario to 469 Tg CO2eq/yr. in the afforestation and reforestation scenario (Figure 3). Gains in sequestration would occur in all four regions, with the largest gains in the South (25–75 Tg CO2eq/yr.) after 2030. This result would largely mitigate nationwide losses in annual sequestration projected under the baseline scenario.
Policy intervention to mitigate wildfire, in addition to policies to reduce development and increase afforestation and reforestation, were projected to have relatively minor effects on annual carbon sequestration (Figure 3). Projected effects were greatest in the Pacific Coast and Rocky Mountain regions, where average annual sequestration rates would increase by 7–11 Tg CO2eq/yr. over the horizon.
The Value of Forest Carbon Sequestration
Our results concerning the dollar value of carbon sequestration suggest that under the baseline scenario, sequestration in U.S. forests over a 35-year horizon (2015–2050) would have a very high PV (Table 4). Further, changes in USDA policy to boost forest carbon sequestration would also have very high value (Table 5 and Figure 4).
Table 5. Present Value (billions of dollars) of Projected Annual CO2eq Sequestered in U.S. Forests from 2015 to 2050 under Alternative Policy and Social Cost of Carbon (SCC) Scenarios


Figure 4. Increase in Present Value (billions of dollars) of Each Policy Scenario Relative to the Baseline Scenario (discount rate = 3%).
Under the baseline scenario, in which net gains in forest area in the next decade fade into a decline in forest area through 2050, forest carbon sequestration values would range from $125.5 billion (5% discount rate) to more than $1,551 billion at a 95th percentile of the probability distribution of SCC (3% discount rate) (Table 5). Although these forest carbon sequestration values are high, they are not unreasonable on a per hectare basis. Using a 3% discount rate, the PV of carbon sequestration in the years 2015 to 2050 is $517.3 billion, which is $1,959 per hectare over the 264 million hectares of forest land in the 48 coterminous states. These values suggest that, at a minimum, maintaining current forest policy has a clear value to society, especially when projections estimate declines in forest land and carbon sequestration over the next several decades.
The carbon sequestration values resulting from the reduced development scenario range from $134 billion (5% discount rate) to $555.4 billion (3% discount rate), to $1,668 billion at a 95th percentile scenario discounted at 3% (Table 5). Implementing policies to protect forest land from development would result in an increase in net PV over the baseline scenario of about $38 billion (3% discount rate) (Figure 4). Although all four regions exhibit gains in PV, most of the gain (54%) occurs in the Rocky Mountain region, where annual carbon sequestration would increase 10–40 Tg CO2eq/yr. relative to the baseline scenario following 2025. These results suggest that there would be significant social gains in using policy to minimize adverse development effects on forests over the next 35 years.
The policy scenario advancing afforestation in the eastern United States and reforestation in the western United States, in addition to reducing development, would result in a carbon sequestration value of $649 billion (3% discount rate) (Table 5) with an increase in PV over the reference scenario of $131.6 billion and an increase in PV over the reduced-development scenario of $93.6 billion (Figure 4). The biggest gains in PV (58%) would occur in the eastern United States, where 12.1 million hectares of currently unforested rural land would be converted to forest cover. Gains in the PV from reforesting more than 3 million hectares of forest land in the western United States would be almost as large as gains in the east, because boosts in carbon sequestration from reforestation would occur earlier in the time horizon of analysis (Figure 3). The afforestation and reforestation policy would yield the greatest marginal increase in PV ($93.6 billion), suggesting that there would be high social gains to increasing USDA policy emphasis on afforestation of marginal agricultural lands in the eastern United States and reforestation of currently understocked forest lands in the western United States.
To help put the projected increase in carbon sequestration benefits resulting from the afforestation and reforestation scenario into perspective, we computed an approximate cost of implementing such a policy using data describing the actual costs of tree-planting projects proposed by individual national forests in the western United States during the 2017 fiscal year (USDA Forest Service National Forest Systems’ National Reforestation and Nurseries Program). These costs varied, for example, depending on the seedling costs for each species to be planted, project size (number of hectares), access to the planting site, and contract labor costs. The average project cost for the western national forests was $1,178 per hectare. Assuming that this average project cost represents typical reforestation costs throughout the western United States, the cost of a program to reforest 3.0 million hectares of understocked federal forest land would be about $3.5 billion. Assuming that a government subsidy of $247 per hectare paid to private landowners would induce afforestation of 12.1 million hectares of other rural lands in the eastern United States (Lubowski, Plantinga, and Stavins Reference Lubowski, Plantinga and Stavins2006), we estimated that the cost of the afforestation program would be about $3.0 billion. Under these assumptions, the total cost of the afforestation and reforestation policy ($6.5 billion) is a fraction (0.07) of the marginal increase in carbon benefit ($93.6 billion) relative to the reduced development policy.
The wildfire mitigation scenario, which assumes a 10% reduction in the area of stand-replacing wildfires throughout the United States in addition to the policies to reduce development and increase afforestation and reforestation, would have a PV of $660 billion (3% discount rate) (Table 5), for a gain in PV relative to the baseline scenario of $142.8 billion (Figure 4). Although the projected gain in PV relative to the baseline scenario is highest of all of the scenarios we examined, the marginal gain from adding wildfire mitigation to the afforestation and reforestation scenario is relatively small ($11.1 billion), suggesting that wildfire mitigation alone would not yield significant benefits toward the goal of carbon sequestration. Most of the marginal gain in PV from wildfire mitigation (80%) would occur in the Pacific Coast region.
To help put the marginal gain in carbon benefits from wildfire mitigation ($11.1 billion) in perspective, we computed a rough estimate of the cost of attaining a 10% reduction in the area of stand-replacing wildfire in the United States (see also Sohngen and Haynes Reference Sohngen and Haynes1997). Federal appropriations for wildfire management, including preparedness, suppression, hazardous fuels reduction, and rehabilitation activities at the USDA Forest Service and Department of Interior averaged $3.3 billion per year for FY2011–FY2015 (Hoover and Bracmort Reference Hoover and Bracmort2015). On average, 29% ($0.966 billion) of this annual funding was for preparedness to support fire prevention and detection, equipment purchase, and personnel training, and10% ($0.327 billion) was for hazardous fuel reduction on federal lands to make fires less intense and more controllable. Assuming that a 10% increase in the annual preparedness and fuel reduction appropriations ($0.129 billion) results in a 10% reduction in the annual area of stand-replacing wildfire, then the discounted (3% discount rate) annual cost of this fire mitigation policy over the period 2015–2050 is $2.855 billion, which is 26% of the marginal increase in carbon benefit ($11.1 billion). These estimates are consistent with those produced by Sohngen and Haynes (Reference Sohngen and Haynes1997) in their pioneering analysis.
Caveats Associated with the Analysis
Cobenefits
Our analysis estimated changes in carbon sequestration rates and their monetized values resulting from hypothetical USDA policies and did not address potential changes to other valued ecosystem services that would potentially result from changes in carbon sequestration or other alternative policy effects. These changes could involve either enhancement or impairment of water quality, habitat for terrestrial and aquatic species, and resource outputs, including timber and wood fiber, among many others. Regional analysis of forest management effects on carbon sequestration suggest that increased sequestration can be associated with both increases in some ecosystem services and decreases in others (e.g., Seidl et al. Reference Seidl, Rammer, Jager, Currie and Lexer2007; Schwenk et al. Reference Schwenk, Donovan, Keeton and Nunery2012; Kline et al. Reference Kline, Harmon, Spies, Morzillo, Pabst, McComb, Schnekenburger, Olsen, Csuti and Vogeler2016). In analysis from the United States, for example, Schwenk et al. (Reference Schwenk, Donovan, Keeton and Nunery2012) found in their Vermont study that forest management prescriptions that increased carbon sequestration also resulted in reduced timber harvest. Kline et al. (Reference Kline, Harmon, Spies, Morzillo, Pabst, McComb, Schnekenburger, Olsen, Csuti and Vogeler2016) found in western Oregon that forest management alternatives that increased carbon sequestration led to increases in species favoring late successional forest conditions, decreases in species favoring more open conditions, and highly variable responses for species that depend on particular spatial patterns of key ecological conditions, such as edge contrast involving tree heights.
Similarly, afforestation also can affect a range of other ecosystem services, both positively and negatively. For example, McKinley et al. (Reference McKinley, Ryan, Birdsey, Giardina, Harmon, Heath and Houghton2011) suggested that although afforestation of agricultural lands and grasslands generally improves water quality, it can reduce water quantity (e.g., streamflow) when trees uptake more water than crops or grass cover. Plantinga and Wu (Reference Plantinga and Wu2003) found that conversion of agricultural lands to forest via afforestation programs reduces negative externalities associated with agricultural land, such as soil erosion, and improves wildlife habitat roughly commensurate with the costs of administering such programs. Afforestation cobenefits, including species diversity, generally are enhanced where seedlings are established on lands that historically were tree covered, with the greatest improvements to wildlife habitat and biodiversity arising from plantings of native species (McKinley et al. Reference McKinley, Ryan, Birdsey, Giardina, Harmon, Heath and Houghton2011).
Although the potential cobenefits and costs associated with complementary and competitive ecosystem services undoubtedly should be an important consideration in evaluating the efficacy of proposed USDA efforts to increase carbon sequestration, we elected not to attempt to address such effects largely because of the complexity of doing so at a national scale. We feel that such effects are likely to be highly variable across regions and localities, as well as across the spatial and temporal scales of analysis. For these reasons, we suspect that evaluating potential cobenefits (and costs) associated with changes in other ecosystem services may be more feasible at the regional scales or at individual national forest levels. Alternatively, opportunities may exist to draw on existing national-level analysis of other ecosystem services to augment our analysis of carbon sequestration.
Policy Costs
Our analysis considered only rough estimates of the costs associated with the policies and program alternatives that define our scenarios. Ideally, a more detailed accounting of the costs would be included in any analysis of the efficacy of policy and program options, such as would be accomplished in a cost-benefit analysis (e.g., Mishan and Quah Reference Mishan and Quah2007). Such an analysis would be necessary to determine whether the net gains in carbon sequestration resulting from the policy and programmatic scenarios examined are worth the investment necessary to achieve those gains.
One thing to consider when thinking about likely policy costs is that our baseline scenario itself is the result of an array of policies, programs, and market forces that have affected changes in land use and forest cover in the several decades leading up to the present. These factors have exerted influence at a variety of spatial scales and via various administrative or jurisdictional authorities. For example, land use—and thus the amount of forest land—can be influenced by federal, state, and local policies, which all carry their own costs borne by the entities that enforce those policies. Similarly, how forests are managed can be influenced by local, regional, and international market forces. Although a full accounting of the costs and benefits of any given policy change to increase carbon sequestration necessarily would focus on the costs of implementing the policy and expected incremental gains in sequestration, it is important to remember that current levels of sequestration are at least partly because of past investments in various policies and programs that have, for example, incentivized landowners to retain land in forest and to manage it in a particular way.
Forest Carbon Projections
There are several uncertainties associated with our forest carbon sequestration projections that are common to all similar studies, including sample error, measurement error, modeling error, and error in the future state (Coulston, Wear, and Vose Reference Coulston, Wear and Vose2015). Because FIA data are sampled based, each estimated component (e.g., forest carbon sequestration by age class) has a standard error. Westfall and Patterson (Reference Westfall and Patterson2007) found that measurement error of changes in tree volume was approximately 4% of sampling error. Tree volume change is highly correlated with carbon sequestration in the live tree carbon pool. The combined uncertainty of historical sequestration estimates, developed using Monte Carlo analysis, is about ±17% (US EPA 2017). However, uncertainty approaches ±40% using error propagation techniques, suggesting that uncertainty is somewhat dependent on the assessment method. Our projected change in sequestration encompasses the previously mentioned uncertainties but has additional modeling uncertainty and error in the future state. Error in the future state includes error arising from, for example, unknowable future land-use changes, potential atmospheric CO2 and N fertilization effects on sequestration rate by age class, and changes in temperature and precipitation patterns. Further, our projection approach relies on an age transition matrix arising from field observations of disturbance, cutting, and normal mortality rates. There can be significant temporal variability in the amount and types of forest cutting (e.g., clearcutting, partial cutting) and in the amount and severity of disturbance, which suggests that there could be significant variability in the age transition matrix.
Social Cost of Carbon
Discount rates (typically annual) make present and future benefits (or costs) fully comparable, because they take account of (a) human (including policy maker) impatience and (b) the effect of output and consumption growth over time. If discount rates are positive, future benefits are worth less than current benefits, and higher discount rates imply lower future values relative to present benefits. The choice of discount rates is therefore very important for our analysis.
Discount rate choice affects our results through two channels. First, it is a particularly important SCC parameter, because the SCC is essentially an estimated PV of the future damages of climate change at the time a ton of CO2 is emitted. Second, we estimate the effect of carbon sequestration over the coming several decades. The rates chosen to discount values from the time of sequestration back to 2016 also have very important effects on our estimates. Analysts differ in their estimates of the impatience and output growth that underpin discount rates, and therefore, discount rates vary across studies. Because there is no universally accepted set of discount rates, analysts (e.g., Greenstone, Kopits, and Wolverton Reference Greenstone, Kopits and Wolverton2013) often conduct sensitivity analysis to illuminate the influence of the discount rate.
As discussed by many authors (e.g., Arrow et al. Reference Arrow, Cropper, Gollier, Groom, Heal, Newell and Nordhaus2014), uncertainties about the future affect discount rates and make them uncertain. As shown by Weitzman (Reference Weitzman2001) and many others, when key aspects of the future (e.g., output and consumption) are uncertain, lower discount rates should be applied to benefits and costs that occur further into the future. For example, Weitzman (Reference Weitzman2001) suggests that the immediate future (1–5 years) be discounted at 4% per year; 6 to 25 years, at 3%; 26 to 75 years, at 2%; 76 to 300 years, at 1%; and more than 300 years, at 0%. These findings are not incorporated into the interagency working group analysis, but as discussed in Arrow et al. (Reference Arrow, Cropper, Gollier, Groom, Heal, Newell and Nordhaus2014), the French and British governments apply lower discount rates to benefits and costs that occur further in the future, and revisions in this vein are recommended by the National Academies of Sciences, Engineering, and Medicine (2017).
An additional and particularly important type of uncertainty related to climate change is uncertainty regarding climate-induced catastrophe. Climate change is expected to create many types of damages in the United States, but how large will they be? How likely are extreme damages that significantly affect future welfare? There is, of course, significant uncertainty regarding such extreme effects, but hedge investments like carbon sequestration can reduce the chance of catastrophes.
Healthy forests often enhance and support ecosystem services (e.g., water quality and biodiversity) that are endangered by climate change and help mitigate extreme downside risk. As Weitzman (Reference Weitzman2013) discusses, if investments like carbon sequestration mitigate large downside risks, this also reduces the discount rate(s) that should be applied and increases the SCC. As possible in the three integrated assessment models used, the interagency working group included aspects of extreme risk in its SCC estimates. Fully incorporating risk and especially risk of catastrophe in such models is very challenging, however, particularly when analyzing forests, which likely reduce those risks.
Voluntary Incentives and Adverse Selection
Two of the scenarios include afforestation of 12.1 million hectares in the eastern United States, which would largely be achieved by providing incentives to private landowners. The USDA has five voluntary incentive programs, which account for more than 95% of USDA conservation spending (USDA 2014). When estimating benefits, the possibility of incentive-related adverse selection would need to be taken into account (Claassen, Cattaneo, and Johnson Reference Claassen, Cattaneo and Johnson2008).
First, it is possible in practice that carbon estimated to be sequestered by voluntary incentive programs may not be fully additional. The USDA is unable to observe what would have happened had a given incentive program not been implemented, and it is possible that some of the resulting gains in carbon would have been sequestered without the program. For example, landowners concerned about climate change may enroll in USDA conservation programs to get credit for steps they would have taken without such programs (Duke, Dundas, and Messer Reference Duke, Dundas and Messer2013). Lubowski, Plantinga, and Stavins (Reference Lubowski, Plantinga and Stavins2006) estimate that about 10% of land enrolled in the CRP between 1982 and 1997 would have been taken out of agricultural production anyway, because of market factors.
Second, slippage (or leakage) can also occur. Although steps are taken to avoid landowners “gaming” USDA incentive programs (Claassen, Cattaneo, and Johnson Reference Claassen, Cattaneo and Johnson2008), landowners may sometimes bring land into production that was previously unfarmed to compensate for land enrolled in a USDA voluntary conservation incentive program. Murray, McCarl, and Lee (Reference Murray, McCarl and Lee2004), for example, estimated that leakage from program effects can range from less than 10% to more than 90% depending on sequestration activity and where it occurs. Wu (Reference Wu2000) found that in the central United States, such slippage offset between 9% and 14% of erosion control benefits resulting from the CRP, for example. Lubowski, Plantinga, and Stavins (Reference Lubowski, Plantinga and Stavins2006) estimated that the CRP reduced unenrolled forested area by about 200,000 acres or approximately 15% of the measured impact on forests. Despite leakage effects, carbon-positive externalities also can accrue from USDA conservation policies and programs targeted toward other ecosystem services. For example, landowners interested in retiring land may participate in the Wetlands Reserve Enhancement Program, which will likely generate carbon benefits. Incorporating carbon-specific criteria in project selection may help moderate leakage while improving multibenefit returns on program investments. Accounting for leakage, as well as potential complementary benefits, would enable further refinement of our estimates of carbon sequestration policy effects but was beyond the scope of this particular study.
Conclusions
Federal forest policy makers and managers need timely and relevant economic analyses using the best data and methods currently available for evaluating policy alternatives. We found that existing data and models permit developing national-level estimates of carbon sequestration and its monetary value, in response to hypothetical land-use and forest disturbance policy scenarios. Our projections of carbon sequestration resulting from various policy scenarios suggest that U.S. forests hold large amounts of valuable carbon that will over time become more valuable. The greatest carbon gains and monetary values are estimated to be generated from the afforestation/reforestation policy, followed by reduced development, and then reducing wildfire. Our rough estimates of the costs of the afforestation/reforestation and fire mitigation policies suggest that both policies are cost effective. Full cost-benefit analyses of these polices are called for and would provide a more complete picture of net economic benefits.
Given that afforestation/reforestation policies have long played roles in USDA conservation efforts, they would seem to be viable approaches should the USDA choose to pursue opportunities for increasing carbon sequestration in the United States by offering financial incentives to private landowners to plant trees and emphasizing the reforestation of public forest lands. Although afforestation and restoration policies may be viable approaches for increasing carbon sequestration, analyses of the degree to which landowners might respond to any afforestation or restoration incentives, including analysis of potential slippage, are somewhat limited. Focused research may be warranted to improve understanding of the degree to which private landowners might respond to incentives of varying amounts, as well as whether some behavioral changes might be possible in the absence of financial incentives (e.g., outreach and technical assistance).
Key components of our analysis were the models of forest dynamics and land-use change to forecast national-level estimates of forest carbon stocks and fluxes (Coulston, Wear, and Vose Reference Coulston, Wear and Vose2015; Wear and Coulston Reference Wear and Coulston2015; Woodall et al. Reference Woodall, Coulston, Domke, Walters, Wear, Smith and Andersen2015). We believe continued support of the USDA Forest Service's FIA Program, which develops and maintains data useful for making national-level carbon estimates and projections, is warranted, as is support for research and development efforts to improve data development, including refining estimates of the per ton value of carbon. Additionally, improvements in the ability to evaluate regional differences in per ton and per hectare values of carbon, including the nature of sequestration over time for different management regimes, would allow for more specific policy recommendations.
Funding statement
Partial funding for this study was provided by the Council on Food, Agricultural and Resource Economics, Washington, DC.


 Open access