
A major contribution of environmental economics has been the technical ability to estimate a price for the marginal value of nonmarket goods and services, and in particular, to value the injuries to environmental services that result from the emission of pollutants. The generally recommended approach for bringing this information to policy is the damage function approach, an integrated assessment that, for atmosphere resources, links emissions to atmospheric transport of pollutants to pollutant exposure to injury from exposure and ultimately to valuation of the injury. The estimate of total damages represents the change from a reference case representation of the service flows in absence of the emissions. This quantification of damages provides an evidentiary basis for applying the polluter pays principle—in which the emitter is required to bear the costs of the pollution—to atmosphere emissions based on the change caused by emissions in the value of environmental services. This information should inform the quantity of emissions allowed under regulations such as cap-and-trade, or the emissions price that might be charged under a fee or tax approach.
However, lest we allow the perfect to be the enemy of the good, this framework for public policy has not been used directly in environmental regulation. Even in cases where market-based approaches have been used, damage function estimates have not determined regulatory stringency. Instead, this scientific information has simply been a data input to regulatory negotiations that balance a multitude of other political considerations.
There are two dominant observations to make about the experience with market-based approaches to atmosphere resource regulations. First, emissions targets adopted in these environmental markets have usually been higher (less stringent) than would be recommended by a straightforward balancing of benefits and costs. Among many factors contributing to this outcome, it is sufficient to note the logic of collective action, which prescribes that diffuse benefits from environmental improvement will be devalued in the political context compared to the concentrated costs that accrue to well-identifiable and consequently well-motivated opponents (Olson Reference Olson1965). This appears to apply especially well when environmental policy instantiates economic value in a new asset by introducing a scarcity of tradable emissions allowances. The typical experience is that the regulatory goal in atmosphere markets is initially set at an emissions target where the marginal benefits of additional reductions would be greater than the marginal costs, i.e., the regulation is too lax from an economic viewpoint. Furthermore, new information in science and economics has tended to cause the estimated benefits of emissions reductions to increase and the balance of benefits and costs to evolve even further in the direction of low stringency. Even where there has been approximate balancing of marginal benefits and marginal costs in setting the initial environmental target, for example, as may have applied in the case of the 1990 Clean Air Act emissions cap for sulfur dioxide (Portney Reference Portney1990), the revelation of new scientific and economic information typically has led the initial assessment of the benefits of emissions reductions to rapidly become out of date and be revised upwards (Chestnut and Mills Reference Chestnut and Mills2005).
The second observation, which is the focus of this essay, concerns the costs of achieving the stated emissions target. In atmosphere resource markets, the marginal cost of achieving the target is manifest in emissions allowance prices. Historically, emissions allowance prices consistently have fallen below the values anticipated ex ante when the regulations were initially promulgated. We describe this factor as a strong force in the title of this essay to indicate, by way of a mash-up analogy to the fundamental interactions of physics, that the downward tendency for prices in allowance markets persists strongly even in the face of other factors that affect market dynamics.
Lower-than-expected prices may appear less like a problem than a virtue because they may represent lower-than-expected costs of compliance. However, programs that do not behave as expected by policymakers or as described in economic theory can pose a political problem. Moreover, if programs behave in a way not described by theory then it undermines the credibility of economic perspectives. As science and policy lead us toward deep decarbonization of the economy, the design of environmental markets must account for the likelihood of declining prices if economic tools and their associated advantages will be influential in achieving environmental goals.
The ability of markets to anticipate and respond to this tendency in allowance prices has proven essential to their durability. The primary response of successful programs involves enforcing a minimum price, implemented using a reserve price in emissions allowance auctions, as occurs in all the North American carbon dioxide (CO2) emissions markets. More generally, a strong program design would include a price-responsive (elastic) schedule for introducing emissions allowances into the market; that is, an upward sloping supply schedule. All North American programs provide for increases in supply at specified (high) trigger prices, but except for the provision of a minimum price, providing for decreases in supply at low trigger points is less prevalent.
Like the other North American programs, the Regional Greenhouse Gas Initiative—a carbon trading program in nine northeast US states—has adopted both a minimum price and a schedule for introducing allowances into the market at high prices. In addition, it adopted a third feature, a schedule to decrease the supply of allowances in the market at low allowance prices, an approach it describes as an emissions containment reserve. After a decade of prices that trended well below expected levels, the EU's CO2 Emissions Trading System adopted another approach to respond to the downward tendency in allowance markets by back-loading (delaying) auctions and prescribing in 2019 the movement of allowances into a reserve in response to allowance surpluses. After that approach had little effect on current allowance prices, in 2018 the EU introduced another provision for cancelling allowances beginning in 2023 if the surplus grows large, which has in fact triggered a response with an increase in prices.
This essay surveys the performance of emissions allowance trading programs and the trend for emissions allowance prices to fall below initial expectations. We describe several factors influencing that trend and conclude with a discussion of how market design can take this strong tendency into account.
The Political Narrative Has Focused on Potentially High Prices
Our premise is that the dominant feature of emissions allowance markets has been a downward trend in allowance prices. However, ex ante, the possibility of a price increase has dominated the political narrative when introducing emissions markets. Like Rougarou, the seldom-seen mythical beast of the French alps, a price spike has been observed rarely, and a sustained price increase has never been witnessed in emissions allowance markets – at least not yet. Nonetheless, if one were representing the interests of a firm with a compliance obligation and exposure to a potential price spike that might dramatically increase costs, one would advocate for a program design to mitigate that risk.
There is good reason for prices to be expected to rise. A fundamental observation from economic theory is that an efficient policy will achieve the least-cost emissions reductions first, a result facilitated by allowance trading. If it were less expensive to reduce emissions at a facility than to use an allowance valued at the market price to cover incremental emissions, the firm should reduce its emissions and sell the saved allowance back into the market (or not purchase an additional allowance); if it were more expensive, then the firm would save money if it were to buy an allowance from the market rather than reduce its own emissions. This process leads the marginal cost across all firms to equilibrate and equal the market price of an allowance. As the stringency of an emissions cap is increased (the emissions cap is lowered), the marginal cost of achieving emissions reductions should increase also. All the existing atmosphere resource programs exhibit increasing stringency (lower caps) over time, and so prices might be expected to rise in those programs.Footnote 1 Moreover, firms might be especially concerned about unanticipated price increases that might result, for example, from disruptions in related energy factor markets. For example, the experience in the sulfur dioxide market shows that Hurricane Katrina, which knocked out natural gas supply and boosted coal use, led to a short-term spike in allowance prices.
Several features in emissions markets help mitigate the chance of sudden price spikes. One of the most important is emissions allowance banking, which enables an allowance to be eligible for use in compliance at any time after its initial issuance so that firms can ration their compliance activities over time. A firm might choose to make a major investment in emissions control and over-comply with its compliance obligation, knowing that an allowance saved is a dollar earned – that is, allowances not used for compliance in the current compliance period will continue to hold their value for future compliance periods and can be expected to increase in value if compliance costs across the industry increase. The ability to bank conveys convenience value to the firm, not only in scheduling investments and production activities, but also hedging against a potential spike in allowance prices. Banking converts a single-year compliance obligation into a multi-year compliance horizon for planning purposes, yielding an expanded pool of allowances to use for compliance in the face of any short-run disruptions in relevant factor markets. In fact, where a short-term runup of allowance prices has occurred, it has occurred in programs that lacked banking.
Economists have often advocated for the opportunity to borrow allowances from a future compliance period as another way to mitigate a potential price spike, but the challenges of moral hazards are severe. For instance, the least solvent firm in an industry might be most likely to borrow on its future allocation of allowances and sell them into the market, and if the firm ever becomes insolvent the obligation might not be repaid. However, most programs enable implicit short-term borrowing through multi-year or overlapping compliance periods, another method for softening the impact of short-term pressures on the allowance market.
The carbon markets also allow for the use of out-of-market compliance, or offsets, which provide an additional way to achieve compliance. By bringing additional compliance instruments into the program, the introduction of offsets effectively expands the supply of compliance instruments and lowers allowance prices in the market.
Where all else fails, the existing carbon programs have a reserve of allowances that enter the market and increase the supply of allowances at a trigger price. California's extension to its cap-and-trade program through 2030, which takes effect in 2021, introduces for the first time a hard price ceiling at a level to be determined by the state's Air Resources Board, at which an unlimited supply of allowances would become available in the market. This event would not supersede the Board's obligation to achieve statutory requirements to achieve specified emission reductions, but they would have to occur outside the market. California and the RGGI program also incorporate a cost-containment reserve, a quantity of allowances that are made available if allowance prices exceed a predetermined level.
In summary, there are a number of reasons why allowance prices typically are expected to rise over time in most programs, and this expectation is built into the policy design. Moreover, policymakers and compliance entities often focus their concern on the possibility of allowance prices rising at an even faster rate than anticipated. As described above, this political narrative has had a substantial impact on program design: allowance markets generally integrate a set of mechanisms to protect against the risk of price spikes. However, the prevalent trend is not rising prices but lower-than-expected or even falling prices. The following sections will highlight some of the reasons for this outcome and describe mechanisms that can be used in allowance markets to address this reality.
The Actual Outcome in Markets
The experience across atmosphere resource markets has not been rising prices, and only rarely have the markets experienced short-run price spikes. Across all these markets, the trend has consistently been lower than expected and frequently falling prices.
US Sulfur Dioxide Market
The first grand experiment in emissions allowance trading was the trading of sulfur dioxide allowances in the US electricity industry, authorized by the 1990 Clean Air Act Amendments. Sulfur dioxide (SO2) contributes to acidification of terrestrial ecosystems and to formation of fine particulates, which affect public health. The first phase of the program began in 1995 and affected 110 of the largest and most polluting coal-fired generating stations. In the second phase, beginning in 2000, the program expanded to cover the entire industry. Banking of allowances over time and between phases was allowed. Virtually all allowances were distributed for free, based on historic use of facilities, but 2.8 percent of the allowances were withheld and distributed through a consignment auction, with revenues distributed proportionately back to the facilities. The first bilateral trades occurred at prices between $200 and $400 per allowance (Ellerman et al. Reference Ellerman, Joskow, Schmalensee, Montero and Bailey2000). The first annual auction, held in 1993, helped identify a market price and stimulated transactions. Over the first six years, auctions cleared at prices ranging from $70 to $190, and bilateral trades in the market fell in the same neighborhood, well below the band of values forecasted by the US EPA and market analysis, shown in the yellow band in Figure 1 (ICF 1990). The figure also displays the draft and final versions of the Clean Air Interstate Rule (CAIR) that fundamentally restructured the market by changing the value of allowances that would be issued after 2010, and the price spike associated with Hurricane Katrina, which disrupted natural gas facilities and led to an increase in coal use. From the first year of compliance in 1995 until the introduction of CAIR, marginal costs and allowance prices were one-third to one-quarter the values anticipated before implementation, and prices fell again after CAIR provisions pertaining to SO2 were suspended by the courts. A multitude of reasons contributed to the lower-than-expected prices, including the expanded availability and low cost of low-sulfur coal, falling prices for post-combustion controls (scrubbers), and unexpected success in blending of low- and high-sulfur fuels (Burtraw and Szambelan Reference Burtraw and Szambelan2009). These innovations played an important role, but the low prices were also due in a major way to the dynamic flexibility of the program design, which allowed compliance entities to use a broad range of abatement options and to bank their allowances, thus enabling the allowance market to capture the benefits of trends in the electricity and related factor markets (Reference Burtraw and SzambelanBurtraw and Szambelan).
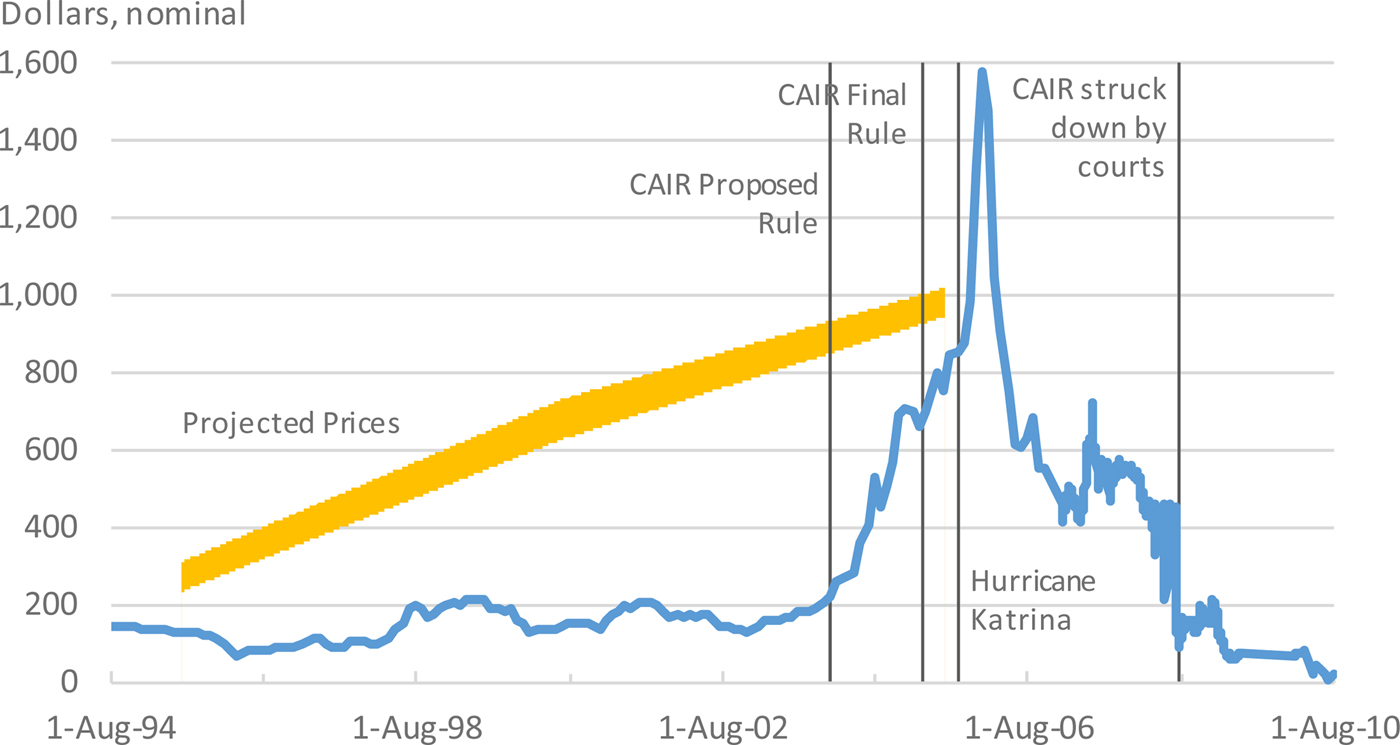
Figure 1. US sulfur dioxide allowance prices
US Nitrogen Oxides Market
The second important trading program regulated emissions of nitrogen oxides from the power sector in 19 states in the eastern United States. Nitrogen oxides (NOx) are a precursor to ozone formation, a summer season problem, and contribute to the formation of fine particulates and acidification on a year-round basis. This program was applied during the five-month ozone season and was the outgrowth of a previous program involving only northeastern states. It was precipitated by the US Environmental Protection Agency's call for states to revise their state implementation plans, as shown in Figure 2. The late entry of Maryland to the trading program and a dramatic increase in natural gas prices caused a short-term price spike at the outset of the program, but prices soon fell to a fairly stable level with the widespread adoption of selective catalytic reduction, and boiler-level adjustments in facility operations (Burtraw and Szambelan Reference Burtraw and Szambelan2009). The advent of the CAIR program for nitrogen oxides drove further investments in emissions reductions and further depressed allowance prices.
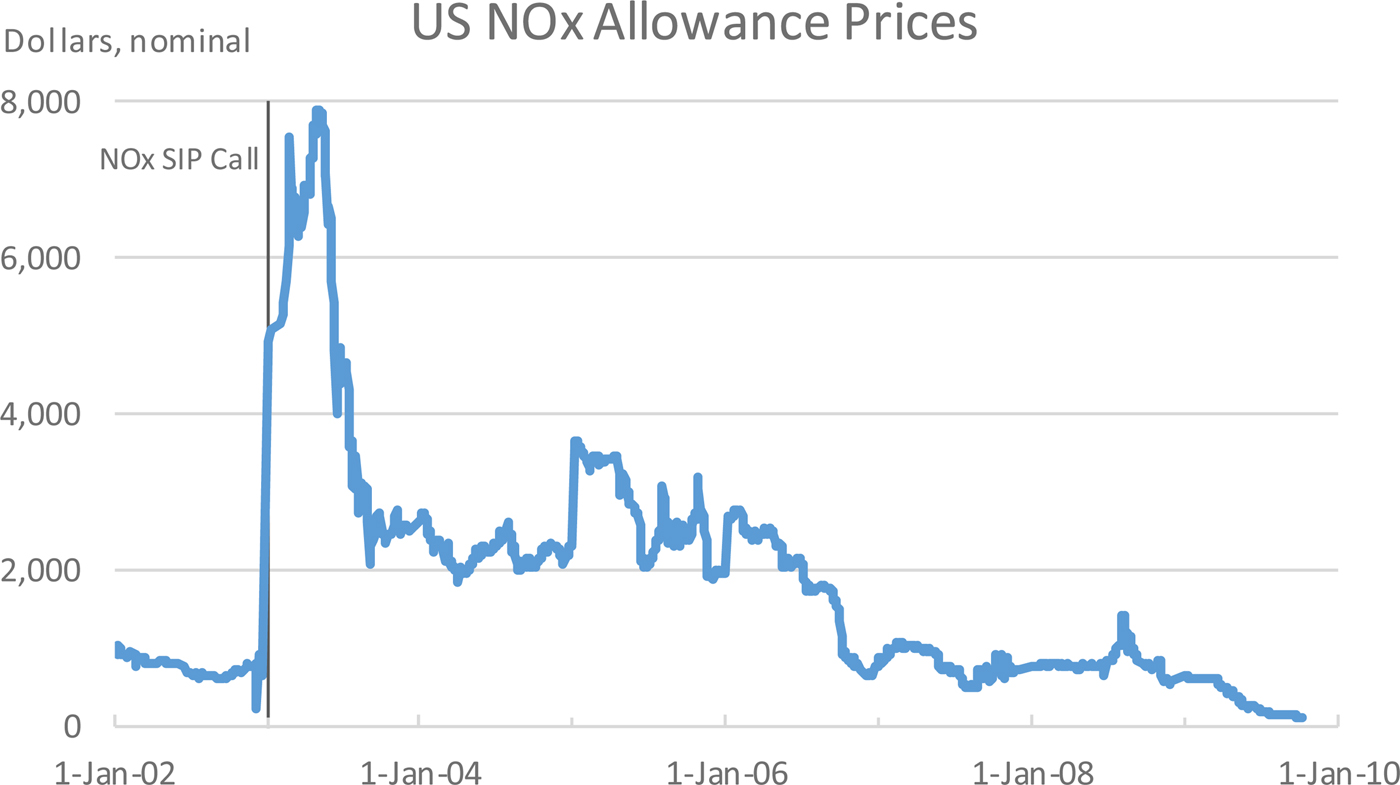
Figure 2. Regional nitrogen oxide emission budget prices
Chicago ERMS for Volatile Organic Compounds
A third example is the local Emissions Reduction Market System (ERMS) in the Chicago area for volatile organic compounds (VOCs), precursors to formation of ozone (Figure 3). This program began in 2000 and was designed to be a lower-cost approach to reduce VOCs emissions in the Chicago ozone nonattainment area. Similar to the NOx program, ERMS compliance applies only during the summer ozone season. Contrary to expectations, emissions in the first years of the program were substantially lower than their annual caps; consequently, allowance prices declined and were far lower than originally predicted—in 1996 the Illinois EPA predicted allowance prices of $344, and since 2003 the average annual allowance price has been at or below $20 (Evans and Kruger Reference Evans and Kruger2007). Due to the lack of allowance scarcity, minimal trading occurred, and many allowances expired without being used. Unused allowances and lower-than-expected allowance prices were attributed in part to an initial over-allocation of allowances that failed to create scarcity. Allowances were distributed at no cost to compliance entities based on their highest summer emissions, and the cap was set as the sum of allocated allowances. This method is distinct from the common method in which an emissions cap is predetermined and allowances are distributed based on sources’ historical share of total emissions. There is evidence suggesting that baseline emissions in ERMS were inflated; emissions in 1998 before the program began were only 67 percent of the total allocated emissions in 2000, the first year of the program (Evans and Kruger). Throughout the life of the program, emissions may also have been driven down by other regulations, including Illinois state regulations for ozone compliance and federal controls for hazardous air pollutants (Kosobud et al. Reference Kosobud, Stokes, Tallarico and Scott2004). Compliant sources also experienced a number of shutdowns over the course of the program and continued to receive allowance allocations, putting further downward pressure on allowance prices. In 2005, 36 sources with no emissions were still receiving allowance allocations (Evans and Kruger).
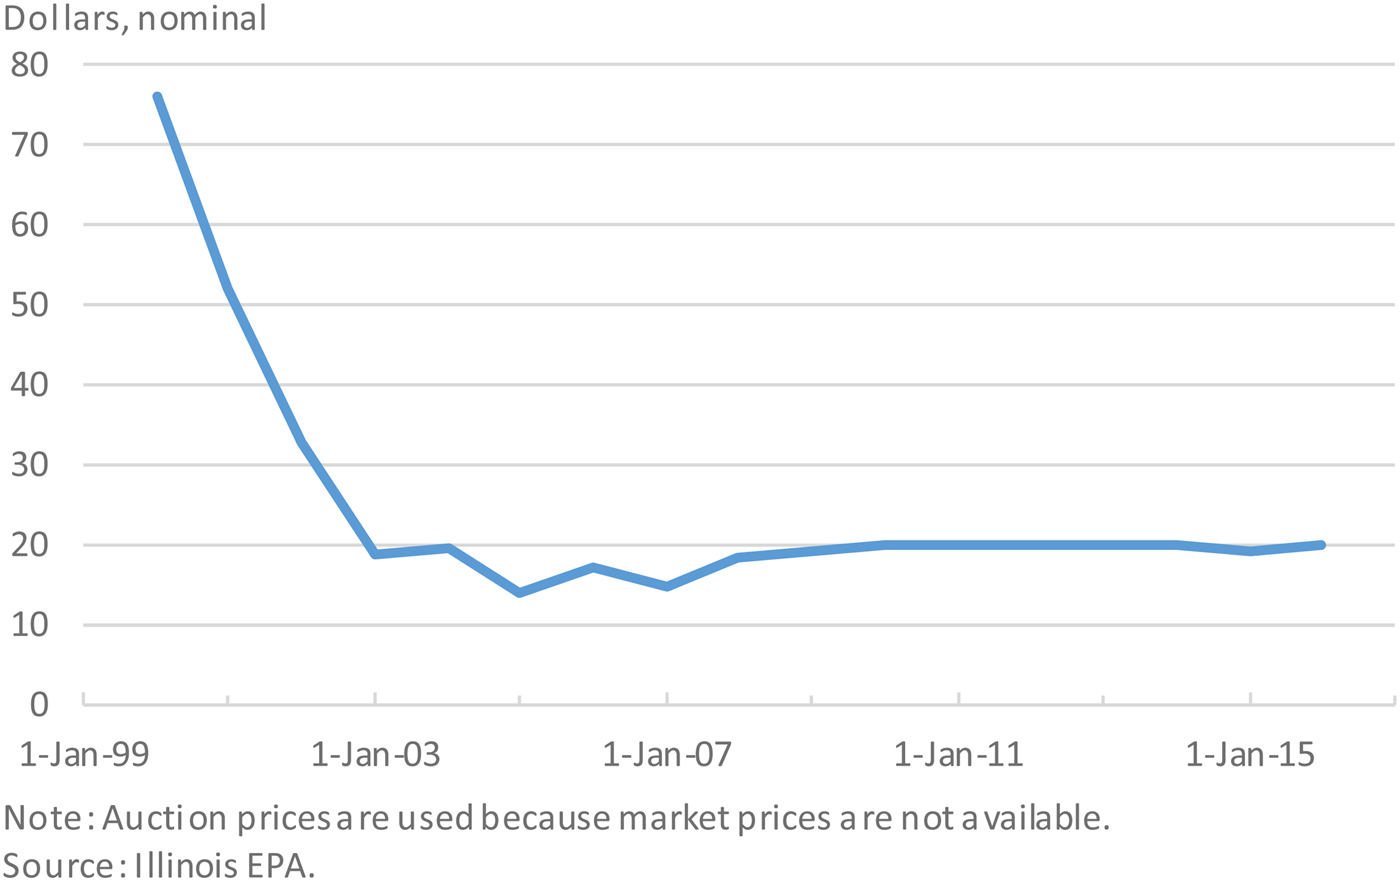
Figure 3. Local volatile organic compound prices
California RECLAIM for Sulfur Oxides and Nitrogen Oxides
Another example of a local emissions trading program is the Regional Clean Air Incentives Program (RECLAIM) in southern California, which is the exception that establishes the rule. It is the one program that had a spectacular increase in prices that led to the temporary suspension of the program. The RECLAIM program began in 1994 and created markets for both sulfur oxides and NOx emissions. For the first six years of the program, emissions by compliance entities were below the declining annual cap, and allowance prices remained low and stable (US EPA 2002). However, in 2000–2001 the prices for NOx allowances in RECLAIM soared, interacting with the dry hydro year and the California electricity crisis. NOx allowance prices in compliance year 2000 reached above $45,000 per ton, over ten times the average price in 1999 (US EPA). The key feature of the RECLAIM program that enabled this outcome was the absence of banking. Compliance entities were organized in two groups with one-year compliance periods that overlapped by six months. Consequently, there was a limited ability to purchase allowances from a compliance entity with a different compliance period and effectively borrow from the short-term future. In practice, the absence of banking led to “just-in-time” emissions reductions. That design, coupled with increasing stringency of the program, a low hydro year, other changes in the electricity markets, and intentional market manipulation, created the circumstances that led to the program's collapse. The experience shows that, just as a poorly designed house will fall down, a poorly designed program might collapse also.
EU ETS for Carbon Dioxide
The first trading program for CO2 took shape in the EU's emissions trading system (ETS), which began in what has been called a trial period from 2005–2007. The program covers about 11,000 stationary facilities accounting for about 45 percent of EU emissions. The EU ETS Phase 1 had a design feature in common with RECLAIM—it broadly limited banking of allowances into Phase 2 of the program. In a program without banking, towards the end of the compliance period when allowances become worthless two things can happen. Prices may go to zero because allowances the day after the end of the compliance period are worthless, as was observed in the EU ETS (Figure 4). Or allowance prices may go toward infinity because supply is exhausted, as in RECLAIM. The EU ETS and RECLAIM illustrate these two possibilities coming to life.
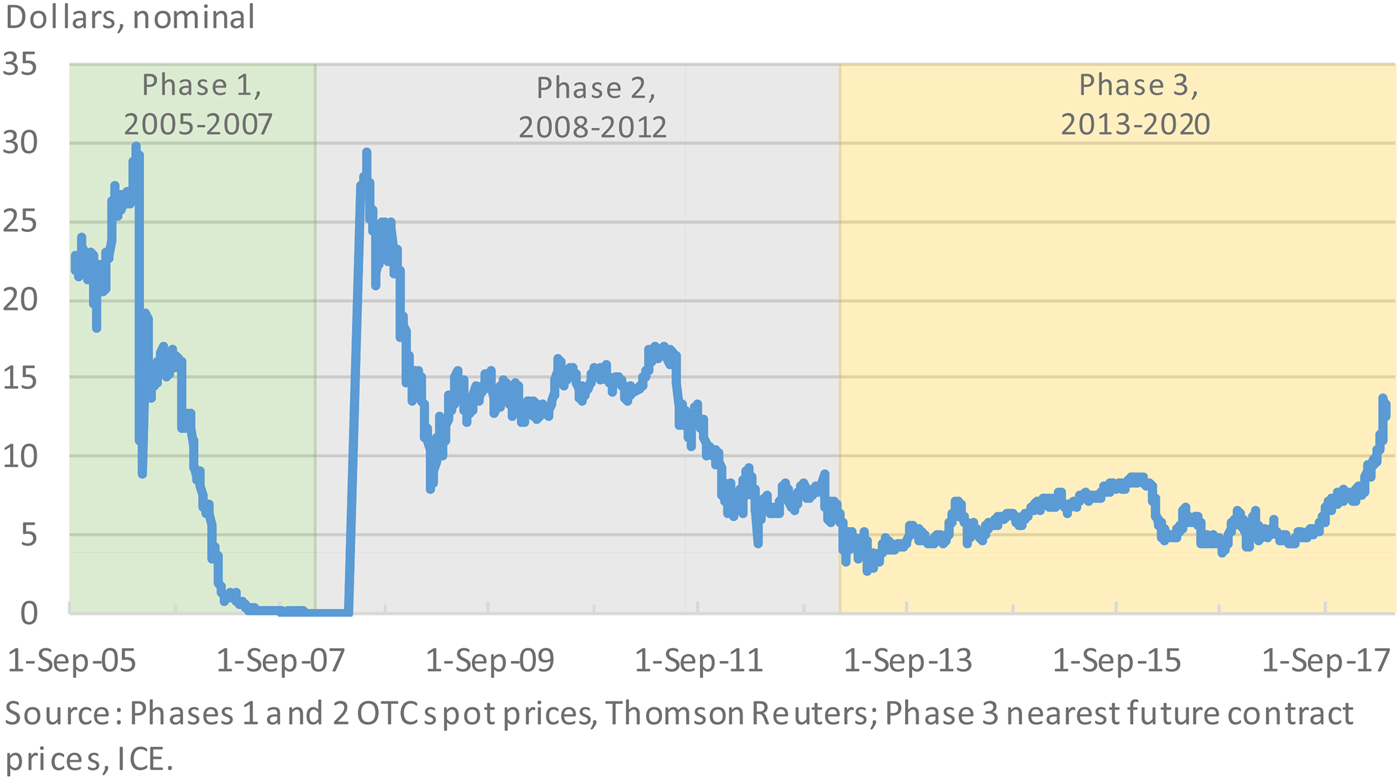
Figure 4. Prices in the EU carbon dioxide emissions trading system
In the subsequent Phases 2 (2008–2012) and 3 (2013–2020) of the EU ETS, allowance banking has been allowed. The relaunch of the program in Phase 2 led to an initial recovery of prices, approaching the level forecasted by analysts as necessary to achieve the EU's long-term climate goals. However, those prices have fallen substantially and consistently over the program's history. Several factors contributed to this price trend, including the recession, the availability of offsets through the international Clean Development Mechanism, and the substantial development of renewable energy promoted by government programs (Knopf et al. Reference Knopf, Koch, Grosjean, Fuss, Flachsland, Pahle, Jakob and Edenhofer2014, Bel and Joseph Reference Bel and Joseph2015). These factors have driven down the demand for emissions allowances, and allowance prices have fallen accordingly. With the ability to bank allowances beginning in Phase 2, allowance prices have reflected not just the relationship between allowances and emissions in the current period, but also the expectations of future allowance scarcity (Knopf et al. Reference Knopf, Koch, Grosjean, Fuss, Flachsland, Pahle, Jakob and Edenhofer2014). Persistently low allowance prices motivated repeated reforms to the program, and beginning in 2018 the most important of these reforms had its desired effect, leading to an important uptick in prices.
Northeastern US RGGI Carbon Dioxide Market
RECLAIM notwithstanding, because it did not allow banking, the general trend across programs discussed so far was falling prices. This observation was evident and supported two program design innovations in the Regional Greenhouse Gas Initiative (RGGI) CO2 trading program. One innovation was a central role for auctions in the initial distribution of emission allowances, motivated by observations in the EU ETS of the transfer of wealth and windfall profits to emitters due to free allocation. The second innovation was the introduction of a minimum price, enforced through what is called a reserve price in the quarterly auctions. A reserve price prohibits allowances from being sold at any price below an established minimum price. This works just like the option to specify a minimum price on eBay; it constricts the supply of allowances when prices fall to the identified reserve price, thereby supporting the price in the market.
In RGGI, the auction reserve price has proven crucial to the survival of the program. After the first few auctions, the auction price settled at the reserve price for eleven consecutive auctions before changes in the program led to a recovery of prices. The reserve price was low, at about $2 per ton, illustrated as a “price floor” in Figure 5. However, the reserve price helped the auction net over a billion dollars in revenue in that period, which were primarily invested in program-related activities such as energy efficiency. By maintaining an active market and preserving the value of early investments and banked allowances, the reserve price provided buoyancy to the program until scarcity was adjusted to lift prices off the minimum price level in the auction.
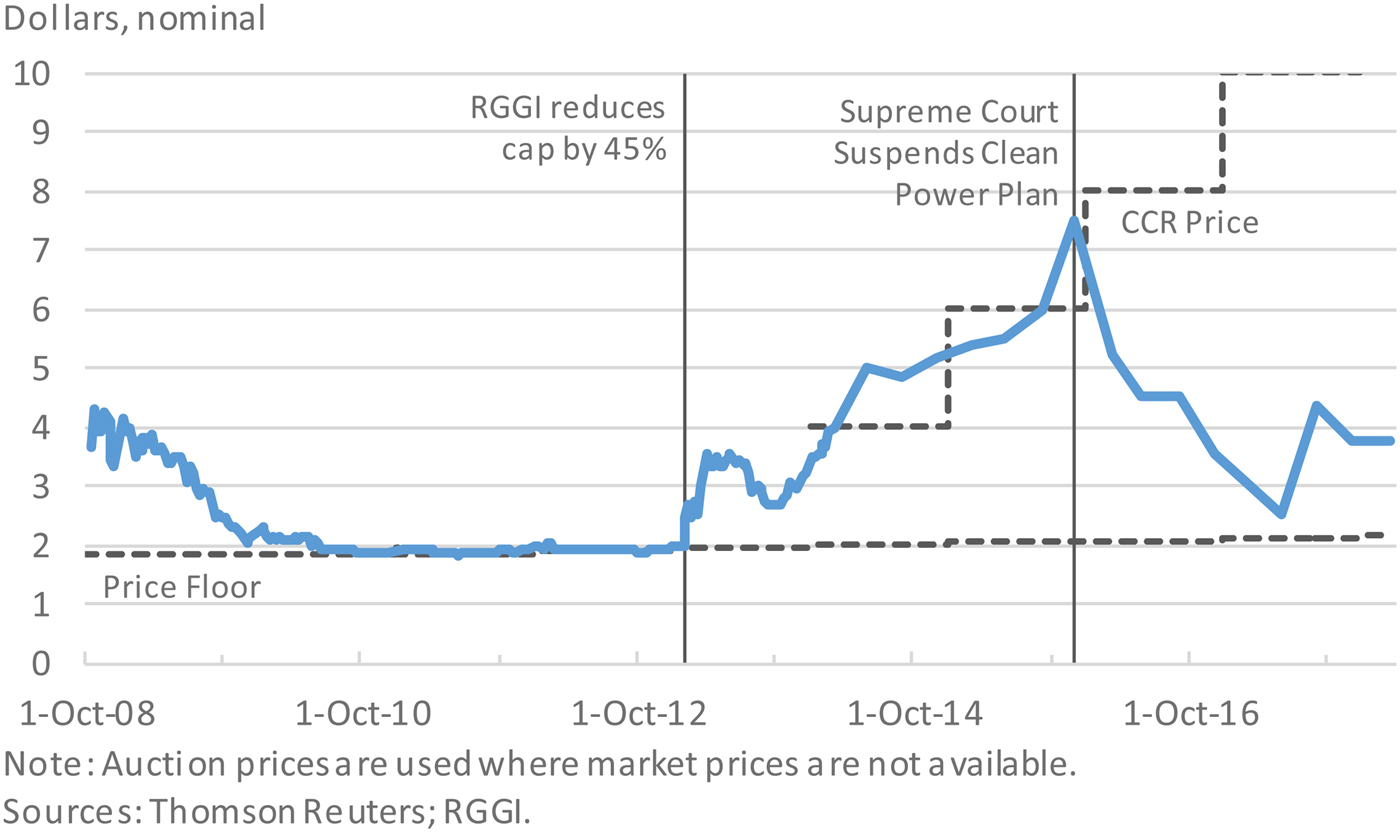
Figure 5. Prices in the Regional Greenhouse Gas Initiative carbon dioxide program
The experience with the RGGI program offered a model for the proposed national trading program known as the Waxman-Markey proposal, which passed the US House of Representatives in 2009. That proposal included an important and growing role for an auction, with a reserve price in the auction beginning at $10 per ton and increasing over time. That proposal was never adopted into law, but the model was propagated further in the California program, illustrated in Figure 6.
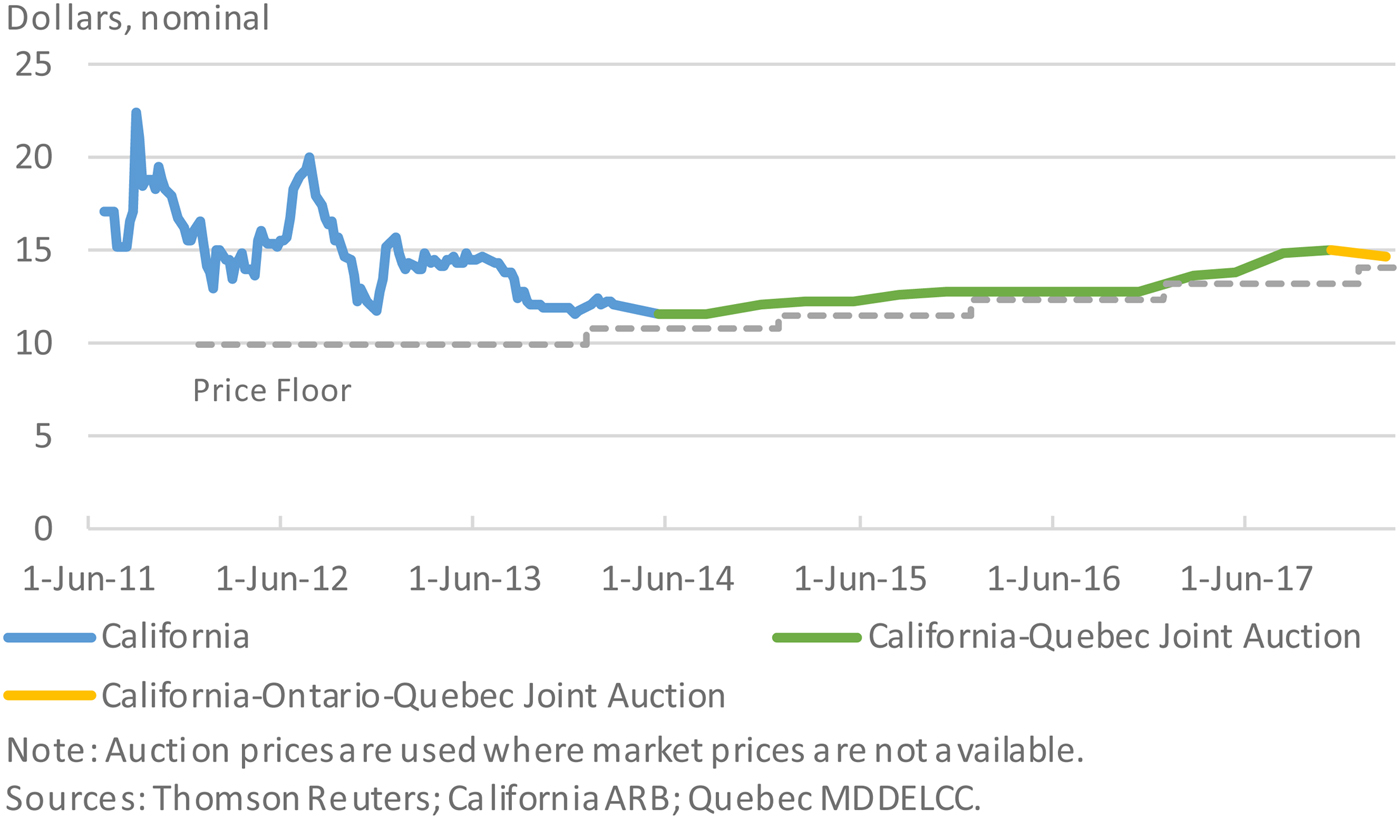
Figure 6. Prices in California, Quebec and Ontario carbon dioxide cap-and-trade programs
California Carbon Dioxide Market
The first trades in the California CO2 market occurred in 2011, auctions began in 2012, and compliance began in 2013, covering only the electricity sector and large stationary sources. In 2015 it expanded to an economy-wide program, covering about 85 percent of emissions in the state, linked with Quebec, and subsequently linked with Ontario in 2018. The program has a reserve price in its auctions that increases at 5 percent per year plus inflation. The reserve price caused some allowances to remain unsold in five consecutive auctions in 2016, before demand stiffened and the auction supply was again fully sold.
Factors that Explain Downward Trends in Allowance Prices
We argue that the most important and consistent phenomenon in emissions trading programs has been falling allowance prices. The next question follows – why? A number of factors contribute to the “gravitational” force witnessed so often in trading programs.
The first and most obvious cause of low prices is over-allocation of allowances. The determination of annual emissions caps and allowance allocation is subject to political influence. Frequently, emissions caps are set at levels that are less stringent than would be suggested if emissions caps were informed by the damage function approach to measuring marginal benefits of emissions reductions. This was particularly evident in the Chicago ERMS program, where the emissions cap was based on the sum of compliance entities’ baseline emissions. Evidence suggests that baseline emissions in ERMS were inflated, leading to an emissions cap that required minimal abatement and enabled low allowance prices (Evans and Kruger Reference Evans and Kruger2007).
In some cases, low allowance prices reflect program uncertainty. If compliance entities do not have confidence in a program's future, they may bet against it and reduce their demand for allowances. Knopf et al. (Reference Knopf, Koch, Grosjean, Fuss, Flachsland, Pahle, Jakob and Edenhofer2014) found evidence suggesting that political factors and regulatory uncertainty played the most important roles in the price declines in earlier phases of the EU ETS.
Allowance prices often fall below expectations because the incentives created by emissions trading programs work as intended. Burtraw and Szambelan (Reference Burtraw and Szambelan2009), in their analysis of the SO2 trading program, found that the costs of abatement fell over time in part because trading triggered a search for ways to reduce emissions at lower costs. The trading program provided flexibility in the abatement methods that compliance entities could use, such as fuel blending and switching, which allowed them to fully exploit innovations and trends in fuel and technology markets. Additionally, flexibility allowed for competition among abatement options, which helped to further reduce compliance costs (Burtraw Reference Burtraw1996, Reference Burtraw2000). Analysis of the NOx Budget Program found similar results. Under this program, an estimated 10 to 15 percent of emissions reductions resulted from small-scale modifications to existing capital that would not likely have occurred under a command-and-control policy (Linn Reference Linn2008, Burtraw and Szambelan Reference Burtraw and Szambelan2009). These innovations, along with fuel switching and the retirement of noncontrolled units, contributed to lower compliance costs and falling allowance prices. In general, innovations such as these are difficult to anticipate, so they often cannot be enumerated in advance, and hence they are often not reflected in modeling that provides ex ante estimates of the cost of compliance and that influences decisions about the stringency of the emissions caps.
Another driver of falling allowance prices is subjurisdictional policy. Jurisdictions within a trading regime may choose to implement more stringent policy measures, which can reduce the total demand for allowances. For instance, in the EU ETS several member states, including Sweden, Norway, Denmark, the UK, and Ireland, have implemented domestic carbon taxes or other forms of carbon pricing on top of the international emissions trading scheme. Many member states also provide significant subsidies to renewable energy that affect allowance prices (Van den Bergh, Delarue, and D'haeseleer, Reference Van den Bergh, Delarue and D'haeseleer2013, Koch et al. Reference Koch, Fuss, Grosjean and Edenhofer2015).
Finally, and importantly, emissions trading programs exist within a landscape of other policies and companion policies, such as regulatory standards and government investment, that have a significant effect on the outcomes of trading programs. These companion policies are more often called “complementary policies” by economists who envision emissions pricing as the primary policy. However, in every case, the pricing policies follow earlier regulatory efforts that employ standards or promote technologies, and these policies are typically maintained and sometimes strengthened with the advent of emissions pricing (Meckling, Sterner, and Wagner Reference Meckling, Sterner and Wagner2017, Pahle et al. Reference Pahle, Burtraw, Flachsland, Kelsey, Biber, Meckling, Edenhofer and Zysman2017). Hence, we might ask whether or not emissions pricing is a complementary policy. In any event, we choose to call them companion policies because they always are apparent wherever emissions pricing is observed.
Companion policies often exist to address concerns beyond the targeted type of emissions. These policies can address air quality, job creation, economic development, institutional development, and good old-fashioned fighting for rents. Companion policies can be particularly useful for jurisdictions that take leadership positions on addressing emissions and are concerned about leakage, because companion policies can have a smaller effect on the changes in final prices of goods and services, which can help preserve the competitiveness of trade-exposed industries. However, companion policies always reduce the demand for emissions allowances and push down prices. In the EU ETS, the use of offsets through the Clean Development Mechanism and the development of renewable energy encouraged by government programs have put downward pressure on allowance demand and prices. In California, companion policies played an early role and continue to play a major role in meeting emissions reduction goals and reduce the cost of compliance in the cap-and-trade program. The state's first and second emissions reduction scoping plans expected that the regulatory standards and measures were sufficient to achieve over 80 percent of their targeted emissions reductions, with the cap-and-trade program accounting for the remainder of reductions. Their recent third scoping plan expects regulatory standards and measures to continue playing a major role by achieving 60 percent of reductions, and leaving the remaining 40 percent to cap and trade. Similarly, complementary policies are a prominent feature of the RGGI program, where over 85 percent of the revenue from the auction of allowances has been invested in program-related spending including energy efficiency programs and clean energy investment. These program-related investments are designed to reduce the demand for allowances and keep allowance prices low. The RGGI program is given credit for about half of the total emissions reductions observed in the region over its timeframe (Murray and Maniloff Reference Murray and Maniloff2015).
Trading programs have also been influenced by exogenous conditions such as technology changes and economic shocks. The greatest of these exogenous influences on CO2 emissions markets in recent years were the economic recession, and in the United States, the shale gas boom. The economic recession reduced demand for goods and services and therefore decreased baseline emissions, putting downward pressure on allowance prices. The shale gas revolution led to a greater supply of low-cost natural gas, which, because of its low emissions profile compared to coal, provided a lower cost emissions abatement option and put downward pressure on allowance prices. Although these phenomena contributed to declining prices, it is equally possible for exogenous economic and technology changes to have an increasing effect on allowance prices – but this is not what we have observed.
What are the Consequences of Falling Prices?
As we discussed above, the possibility of rising allowance prices is one that has been discussed extensively, and mechanisms are designed into emissions trading programs to address it. However, the trend of falling prices is far more prevalent and merits a discussion of the consequences and the mechanisms that can help avoid it.
One might ask, what is wrong with a low price if the emissions target is being achieved? The concern is that low allowance prices may fail to create price incentives that facilitate investments that lead to reductions in an economy's emissions intensity over the long term. Low prices, for example, may not trigger changes such as fuel switching or renewables uptake, because compliance entities can purchase allowances at a lower price than would be required to make these investments. This is an issue even if the emissions trading program is meeting its short-term emissions targets. For example, Knopf et al. (Reference Knopf, Koch, Grosjean, Fuss, Flachsland, Pahle, Jakob and Edenhofer2014) found that the allowance price path in the EU ETS has not matched a socially optimal CO2 price path that would achieve climate targets at the least cost over time.
There is another implication of prices that fall well below expectations – companion policies may not have their anticipated effect on the emissions outcome. Companion policies, such as subjurisdictional policy efforts within regional programs in the EU or RGGI, do not change the emissions cap. Instead, they change the profile of emissions reductions that would occur if the emissions price were the sole influence on behavior, and under a cap they lead to 100 percent leakage among jurisdictions (Goulder and Stavins Reference Goulder and Stavins2011). This is known as the waterbed effect, which describes the fact that when you push down on emissions in one place it leads to an increase in emissions in another place, without any change in total emissions. This outcome is insidious because, as we have argued, companion policies have been essential in developing the opportunity for emissions pricing to emerge initially and continue to play a role in price emission jurisdictions, especially carbon. At the same time, however, the waterbed effect may have the perverse effect of undermining the effectiveness of other policies that remain necessary to achieve climate policy outcomes.
A New Generation of Market Designs?
Falling prices in previous emissions markets, especially in the EU ETS, led the architects of the North American carbon markets to innovate in designing a minimum auction price into the market, which we have described previously. Although the minimum price was binding in 11 consecutive auctions, RGGI was nonetheless also confronted with accumulation of a large, privately held allowance bank. In its first program review, RGGI adjusted the quantity in the market by cancelling unsold allowances and by reducing the number of new allowances entering the market to absorb the surplus of allowances then in circulation.
In 2017, RGGI issued an updated model rule to take effect in 2021 that adds an important new program element: the emissions containment reserve (ECR). The ECR introduces a price step below the expected market price and above the price floor. A quantity of allowances (10 percent of the annual cap) would not be sold for a price below the trigger price on the price step ($6 per ton, rising at 7 percent per year). If these allowances are not sold, the price could fall below $6, which is why we refer to the ECR as a soft price step. The unsold allowances are permanently canceled. The price could still fall to the price floor, which applies to all other allowances and provides an absolute minimum price in the auction. The RGGI design is illustrated in Figure 7, where a price below the ECR leads to a reduction in supply. Note also the cost-containment reserve, that in parallel fashion would introduce a quantity of additional allowances at a trigger price above the expected price. In principle, additional price steps could be added to make the allowance supply schedule increasingly responsive to the market price. A price-responsive supply schedule is a characteristic of commodity markets; for example, if the price of natural gas declines, less natural gas enters the market. This characteristic helps reduce price volatility (Burtraw et al. Reference Burtraw, Holt, Palmer, Paul and Shobe2018). In emissions markets, however, supply has usually been inelastic and has not varied with respect to the allowance price.
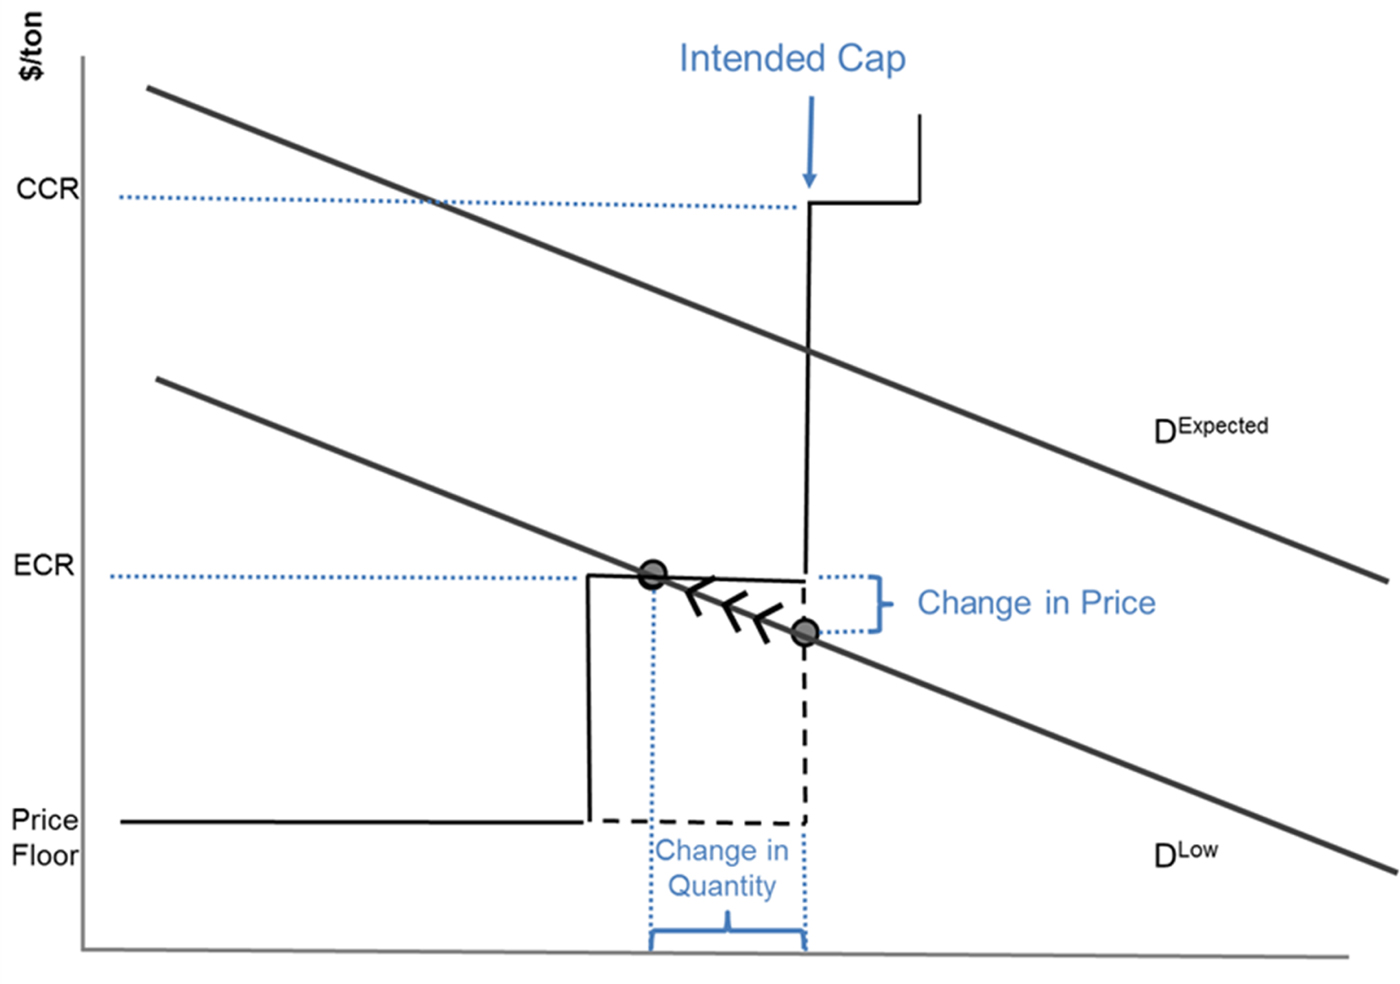
Figure 7. The Emissions Containment Reserve in the RGGI market
What is the consequence of the falling demand for emissions allowances under the ECR? It is manifest in a lower-than-expected price, which works to the benefit of compliance entities and perhaps economic interests more broadly. But, there also is a contraction in the supply of allowances that limits the fall in price and works to the benefit of the environment by reducing emissions below the emissions target. Consequently, there is a “sharing” of the advantageous gains resulting from falling prices, which is different from the way emissions markets have worked previously. The result is a hybrid instrument, combining elements of an emissions tax with cap-and-trade, an approach that has long been suggested in the economic literature (Roberts and Spence Reference Roberts and Spence1976). A program might consider one price step, several price steps, or if a modeler will see right away that the best design (because it is easiest to model!) is a ramp, which would provide a continuous adjustment to both quantity and price.
The EU ETS has recently adopted a different, quantity-based approach, to address their challenge of a low allowance price accompanied by a large emissions bank. In 2015, the EU delayed the issuance of a large volume of allowances and introduced the Market Stability Reserve (MSR), which would automatically restrict the quantity of allowances to be sold in the auction and direct the unsold allowance into the MSR when the quantity of allowances in circulation exceeds a threshold value. Allowances held in the MSR could be returned to circulation if the number of allowances fall below a low threshold value. Analysts were generally skeptical of the effectiveness in delaying the sale of allowances. However, because with banking, the allowance price in the present should anticipate the expanded supply that would ultimately occur (Hepburn et al. Reference Hepburn, Neuhoff, Ackworth, Burtraw and Jotzo2016). In 2018, the EU took an important further step in prescribing the cancellation of a portion of allowances from the MSR each year when the MSR exceeds a specified volume. This approach appears to have immediately affected the allowance price in the EU (Figure 4), and analysis suggests it will partially, but not fully, remedy the waterbed effect (Perino Reference Perino2018).
Changes may also follow in California, where the allowance price is supported by the minimum auction price, but nonetheless a substantial quantity of allowances have accumulated in public and private accounts. In legislative testimony in January 2018, the chairperson of the California Air Resources Board acknowledged the need to make sure that the trading program is sending the message to promote investments that are going to reduce emissions over the long run.Footnote 2 As we noted above, cap-and-trade is expected to be twice as influential relative to other regulatory measures in driving emissions reductions over the next decade in California. One might interpret this to suggest that regulators will consider measures to enable allowance prices to increase.
Conclusion
In review, we argue that a strong force in emissions allowance markets is gravity – that is, a tendency for prices to fall over time. There are several reasons for this, and they are not all bad. Furthermore, emissions markets that have anticipated falling prices in their program design have been successful; those that have not have been less successful.
It is critical to note that our observation of gravity as a strong force does not imply that prices will always fall. Perhaps with new levels of ambition for emissions abatement, prices will rise, even above expectations. Indeed, the programs with a price floor also have a cost-containment mechanism to guard against price increases. These cost-containment reserves take the form of price steps, implemented symmetrically to the idea of an emissions containment reserve that we have described. At specified trigger prices, additional allowances enter the program.
Combining the cost-containment reserve for prices above expected levels with an emissions containment reserve for prices below expected levels maps out a price-responsive allowance supply schedule that might better reflect the politically negotiated scarcity that we observe in market-based programs. We think of the emissions cap as an instruction to the market, but if it turns out that emissions reductions are less expensive than anticipated, then regulators might be expected to purchase more of them. Emissions markets are an important effort to try to take advantage of the power of incentives to achieve environmental outcomes in an efficient way. One might observe that program adjustments are a proven way to adjust supply in response to unanticipated market conditions, but relying on administrative interventions introduces an unpredictable element that accentuates uncertainty associated with environmental markets. Design elements such as an auction reserve price and emissions containment reserve, and potentially the market stability reserve, are rule-based mechanisms that are built into trading programs and automatically adjust the market to deal with low allowance prices. We view these developments as the most encouraging innovation in emissions markets since the widespread introduction of auctions, in lieu of free allocation a decade ago, and the improved design significantly expands the potential for environmental markets.


 Open access