

Introduction
“What products, services, systems, or technologies shall we design next?” This is a lasting question that designers often ask themselves. Designers need to constantly explore new design opportunities departing away from their prior designs. Herein, the notion of design opportunities refers to the open-ended design opportunities or high-level design directions that need to be identified at the fuzzy front end of a design process (Cagan and Vogel, Reference Cagan and Vogel2002), in contrast to the concrete concepts that are needed for prototyping or implementation at later stages of design. Traditionally such design opportunities are conceived based on knowledge, experience, intuition, or gut feelings of designers or time- and resource-consuming marketing research and user studies in large established companies (Tauber, Reference Tauber1975; Ulrich and Eppinger, Reference Ulrich and Eppinger2015). As a result, designers are faced with high uncertainty in the search for new design opportunities and directions.
Despite the existence of user-centered or market-driven methods (Brown, Reference Brown2008; Chen et al., Reference Chen, Hoyle and Wassenaar2012; Kang et al., Reference Kang, Ren, Feinberg and Papalambros2016), design opportunities can also be explored according to the technologies and their relationships. Herein, we aim to develop a rapid design opportunity ideation tool based on the relationships of various technologies. Our focus is motivated by the fundamental understanding that ideation is the analogical transfer, synthesis, blending, or transformation of existing technologies or knowledge into new ones (Weisberg, Reference Weisberg2006; Linsey, Reference Linsey2007; Arthur, Reference Arthur2009; Hatchuel and Weil, Reference Hatchuel and Weil2009; Taura and Nagai, Reference Taura and Nagai2012). However, a designer's prior knowledge and expertise may influence his or her ability to conceive the relevance of other technologies, in particular those in distant domains (Shai and Reich, Reference Shai and Reich2004; Hatchuel and Weil, Reference Hatchuel and Weil2009; Reich and Shai, Reference Reich and Shai2012).
Thus, for conceiving innovative design opportunities, graphical representation of the various existing technologies and their distances may prompt designers with technologies they would not have easily thought of for analogy, synthesis, or blending. Conceptually, the set of all proximate or distant technologies that humankind has created to date constitutes the total technology space (Alstott et al., Reference Alstott, Triulzi, Yan and Luo2017a). In the space, two technologies are proximate if similar knowledge or capabilities are required to design them, or are distant if designing them requires distinct knowledge and capabilities. To recall, comprehend, learn, and use the technologies in the proximity of known technologies will be easier, than those further away in the technology space. As a result, the structure of the total technology space, together with the specialized technology position(s) of a designer, will condition or enable his or her next design opportunities.
We operationalize the total technology space as a network map of technology domains positioned according to knowledge proximity. The patent classes defined by the International Patent Classification (IPC) approximate the domains, and their knowledge proximities are computed based on the references of patents to other patents. Our computation utilized more than five million patents for statistical significance. Designers can browse the map to navigate and relate various technologies as inspiration for new design opportunities. Such conception with a map of aggregate domains is expected to be rapid and result in abstract design opportunities and high-level design directions. These can then be used to start an actual design process and later generate more specific concepts. The utility of the total technology space map (TSM) for conceiving design opportunities and directions in the technology space is analogous to that of the geographical map for exploring places and finding directions in the physical space.
In brief, the goal of this paper is to introduce the total TSM as a rapid ideation tool for conceiving design opportunities at the fuzzy front end of the design process. In the following sections, we first introduce the TSM and demonstrate its use for design opportunity conception of spherical rolling robots (SRRs). Then we analyze its applications in two experiments (for artificial neural network (ANN) design opportunity conception and entrepreneurial design opportunity conception) to show its effectiveness and limitations as a rapid ideation aid. We further discuss the opportunities to digitalize the map for interactive browsing, integrate it with patent retrieval functions for technical concept generation, and embed machine-learning and artificial intelligence (AI) algorithms, in order to develop a system for computer-aided ideation.
Literature review
In the literature and practice, some processes and methods have been in place for identifying new design opportunities at the fuzzy front end of the design process. With abundant time and resources, design engineers in established companies often conduct user studies, market analysis, marketing research, expert panels, brainstorming sessions, etc., to explore new design opportunities (Chen et al., Reference Chen, Hoyle and Wassenaar2012; Ulrich and Eppinger, Reference Ulrich and Eppinger2015; Kang et al., Reference Kang, Ren, Feinberg and Papalambros2016). Recently, design thinking (Brown, Reference Brown2008) has gained popularity in practices for its emphasis on empathizing with and understanding of users to identify design opportunities. Cagan and Vogel (Reference Cagan and Vogel2002) had proposed integrated analysis of social, economic and technology factors and trends to identify the product opportunity gap. Such methods and processes are normally time- and resource-consuming. Entrepreneurs are often motivated by an intuitively conceived design opportunity from their own experiences, frustrations in daily life, dissatisfaction as a consumer, or hobbies to start up a new business (Rohan and Hornblower, Reference Rohan and Hornblower2008).
In this paper, we focus on the ideation regarding technologies and their relationships for design opportunities at the fuzzy front end of a design process, and aim to develop a rapid design opportunity ideation tool. Despite the awareness of the importance to analyze the technologies to identify design opportunities (Cagan and Vogel, Reference Cagan and Vogel2002; Rohan and Hornblower, Reference Rohan and Hornblower2008; Ulrich and Eppinger, Reference Ulrich and Eppinger2015), structured methods or tools are still underdeveloped in the literature.
Prior studies have suggested that new designs arise from analogical transfer (Weisberg, Reference Weisberg2006; Linsey, Reference Linsey2007), synthesis (Arthur, Reference Arthur2009; Youn et al., Reference Youn, Strumsky, Bettencourt and Lobo2015), blending (Taura and Nagai, Reference Taura and Nagai2012), or other forms of transfer or transformation of existing knowledge, concepts, or technologies, often across different domains (Hatchuel and Weil, Reference Hatchuel and Weil2009). However, it remains a question which technologies to transfer or transform and how a designer may proactively search for technology-based design opportunities. In particular, given the vast number of available technologies, the specialization of designers may condition their awareness of the technologies distant from the ones they are familiar with (Hatchuel and Weil, Reference Hatchuel and Weil2009).
In fact, several methods and tools have been developed to facilitate the search for technologies across domains or disciplines. For instance, infused design facilitates the discovery and use of knowledge, methods, and solutions across domains using so-called combinatorial representations (Shai and Reich, Reference Shai and Reich2004). The Interdisciplinary Engineering Knowledge Genome aids in the retrieval of knowledge and method structures in different technological domains (Reich and Shai, Reference Reich and Shai2012). Design-by-analogy leverages the existing solutions in the source domain to solve a design problem in a target domain (Linsey, Reference Linsey2007).
In particular, computational methods have been developed to retrieve patents as design stimuli from the patent database to support TRIZ (Cascini and Russo, Reference Cascini and Russo2006; Li et al., Reference Li, Tate, Lane and Adams2012) or design-by-analogy (Linsey et al., Reference Linsey, Markman and Wood2012; Fu et al., Reference Fu, Cagan, Kotovsky and Wood2013a, Reference Fu, Murphy, Otto, Yang, Jensen and Wood2014, Reference Fu, Murphy, Yang, Otto, Jensen and Wood2015). For example, Fu et al. (Reference Fu, Cagan, Kotovsky and Wood2013a) quantified the functional analogy distance between different patented technologies, and created Bayesian networks of patents based on such distances to facilitate patent retrieval. Fu et al. (Reference Fu, Chan, Cagan, Kotovsky, Schunn and Wood2013b) further reported that it is difficult for designers to conceive the relevance of analogically far patents, whereas “near-field” patents could effectively stimulate new concepts but with limited novelty. Their studies focused on the analogical distance between technologies as the key variable that condition analogical transfers.
The conceptual leap hypothesis in the design creativity literature has suggested that design stimuli from “far” sources contribute to novelty and are the best for creative breakthroughs (Gentner and Markman, Reference Gentner and Markman1997; Ward, Reference Ward, Holyoak, Gentner and Kokinov1998; Tseng et al, Reference Tseng, Moss, Cagan and Kotovsky2008; Wilson et al, Reference Wilson, Rosen, Nelson and Yen2010), but it is difficult for designers to conceive the relevance of distant domains (Gick and Holyoak, Reference Gick and Holyoak1980; Weisberg, Reference Weisberg2006; Chan et al, Reference Chan, Dow and Schunn2015). Chan et al. (Reference Chan, Fu, Schunn, Cagan, Wood and Kotovsky2011) observed that far-field analogies led to new concepts of higher novelty but fewer concepts than near-field analogies. In a different experiment, Chan et al. (Reference Chan, Dow and Schunn2015) further observed that the most creative solutions arise from near distance stimuli, owing to easier perception and more obvious relevance to the design problem.
Fu et al. (Reference Fu, Chan, Cagan, Kotovsky, Schunn and Wood2013b) posited that stimuli across a moderate analogical distance between source and target domains are most favorable. Likewise, by measuring the historical combination frequency (which is opposite to novelty) of the set of prior technologies used in a patented invention, He and Luo (Reference He and Luo2017) found that the inventions with moderate combination frequency, which Chan et al. (Reference Chan, Dow and Schunn2015) termed combination distance, present the highest invention value, measured by the future citations of a patented invention. In addition, Srinivasan et al. (Reference Srinivasan, Song, Luo, Subburaj, Elara, Blessing and Wood2017) allowed designers themselves to search and choose patents from the entire patent database (of Google Patents) for inspiration, and found that designers most frequently obtained inspiration from patents in a medium knowledge distance to the design problem. As such a distance increases, the novelty of generated concepts increases but their quality decreases. Despite the general understanding of the influences of such “distances” on ideation outcome, empirical findings have been mixed, in part due to the variety of ways to measure nearness or farness in contexts.
Taken together, the literature has implied the difficulty to conceive new design opportunities by relating to technologies in domains that are distant from the designer's specialization or design problem. Therefore, designers can be more guided and informed by a macro picture of the various technologies in the total technology space, as well as the information regarding their distances in the space, to seek for systematic inspiration. The Bayesian network of patents of Fu et al. (Reference Fu, Cagan, Kotovsky and Wood2013a) quantifies and visualizes the analogical distances between different patents and the design problem, and thus designers can potentially use the network to identify patent stimuli near or far from the design problem. Their network only covers a small set of patents, and addresses a specific predefined design problem, as in most prior studies on patent retrieval for design stimulation.
Recent studies of patent data mapping have presented some large technology maps that are potentially useful for design ideation. These studies normally utilize an entire patent database to construct network maps of all the technology domains defined in patent classification systems (Kay et al., Reference Kay, Newman, Youtie, Porter and Rafols2014; Leydesdorff et al., Reference Leydesdorff, Kushnir and Rafols2014). Such network maps have been used to analyze the patent portfolio diversification of individual inventors (Alstott et al., Reference Alstott, Triulzi, Yan and Luo2017b), firms (Yan and Luo, Reference Yan and Luo2017a), regions (Boschma et al., Reference Boschma, Balland and Kogler2015), and the design space evolution of a system product (Song et al., Reference Song, Triulzi, Alstott, Yan and Luo2016), but not yet to support design ideation. The aim of such maps to cover the entire technology space determines the nodes on the maps are technology domains (i.e., aggregations of technologies) and makes it not useful to inspire designers for concrete technical solutions. In this research, we propose to use such a macro TSM to aid in the rapid ideation of high-level design opportunities at the fuzzy front end of the design process.
Methodology
The total TSM
We use the entire utility patent database of United States Patent and Trademark Office (USPTO) from 1974 to 2016 to construct the technology network map to represent the total technology space. We call the resultant map the total TSM. The database contains 5,256,505 US utility patents, and each of them is classified in one or multiple seven-digit IPC classes. The patent classification system provides a natural and hierarchical means to approximate all known technology domains and categorize the patents belonging to different domains. In the network map (Fig. 1), different nodes represent different technology domains and can be operationalized at different aggregation levels, for example, three-/four-/five-/six-/seven-digit IPC classes. Prior research has suggested that three-digit IPC classes provide the best resolution and ease for visual analytics (Leydesdorff et al., Reference Leydesdorff, Kushnir and Rafols2014). For example, the node F02 categorizes the patents for combustion engine technology, and B82 categorizes the patents for nanotechnology. This level of abstraction is the most suitable for our aim of conceiving design opportunities and directions.
The total technology space map (TSM). Node size corresponds to the patent count from 1974 to 2016 in each represented IPC class.
After removing several undefined ones, we included a total of 121 three-digit classes in the network map to approximate the widest possible technology space. The 121 nodes, that is, technology classes or domains, are positioned on the map according to knowledge proximity. A qualified measure of knowledge proximity must capture the intuition that the knowledge and capabilities (e.g., human skills and physical equipment) required to design technologies in one domain can also be easily used for designing technologies in the other. In the literature, various measures for proximity have been proposed, primarily using the information of citations and classifications in patent documents (Joo and Kim, Reference Joo and Kim2010; Kay et al., Reference Kay, Newman, Youtie, Porter and Rafols2014; Leydesdorff et al., Reference Leydesdorff, Kushnir and Rafols2014).
In this study, we adopt the knowledge proximity metric depicted in Eq. (1), that is, the cosine of the angle between the two vectors representing two patent classes’ distributions of citations to specific unique patents, formulated as
 $${\rm \varphi} _{ij} = \displaystyle{{\sum\limits_k {C_{ik}C_{\,jk}}} \over {\sqrt {\sum\limits_k {C_{ik}^2}} \sqrt {\sum\limits_k {C_{\,jk}^2}}}}\comma \, $$
where C ij denotes the number of citations of all patents in patent class i to the specific patent j; k belongs to all patents. The proximity value is between (0, 1) and indicates the similarity of the knowledge bases of two domains. This metric was found highly predictive on cross-domain technology diversification in the case study of Google and the development of its driverless car project (Luo et al., Reference Luo, Yan and Wood2017) and highly correlated with and representative of many other alternative measures (Yan and Luo, Reference Yan and Luo2017b). In this research, we used more than five million US patent records and their citation information to calculate Eq. (1) and estimate the proximities between all pairs of the 121 patent classes. The use of the richest possible historical data provides the best empirical approximation of knowledge distance.
The original technology network showed connection between almost all nodes: of a total of 7260 (=121 × 120/2) possible links, only 65 of them are not connected (i.e., cosine = 0). Meanwhile, we found most links are extremely weak and thus not informative. We then filtered the original network to a maximum spanning tree (MST) that only includes the strongest 120 links that connect the 121 technology domains, to reveal the backbone structure of the technology space. Finally, a force-directed algorithm minimizing graph energy (Kobourov, Reference Kobourov and Tamassia2012) was applied to the MST to generate an aesthetically pleasing network layout. This layout is shown in Figure 1.
We visually examined the relative positions of different technology domains on the map based on our engineering knowledge. Its structure is generally satisfactory in that the technologies based on highly similar knowledge bases, for example, “electric communication” and “computing”, are positioned proximately, and the technologies based on distinct knowledge bases, for example, “machine elements” and “infographics and display”, hold distant positions on the map. Especially, the map reveals a few clusters of technologies, indicating such mega technology regions as mechanical, electronics, materials, bioengineering, information technology, etc.
The TSM provides a systematic picture of various technologies and the visual information of their relative distances or proximities. The designer may simply browse the technologies on the map to conceive design opportunities that relate his or her current technologies and expertise with other technologies found on the map. In the following, we use an example to demonstrate how to use the TSM to aid designers in the exploration and conception of new design opportunities.
Design opportunity conception using TSM
Assume we explore new product design opportunities for “Sphero”, a SRR toy designed and commercialized by the company Sphero Inc.Footnote 1 Sphero has a spherical shape and is propelled by a self-contained cart, as shown in Figure 2. It has an on-board micro controller unit, and users may manipulate its motion remotely via a handset. Sphero has been designed and commercialized as a toy, falling into the domain “sports and amusements” on the map. The company wants to explore new product design opportunities extending beyond their prior toy products. This is indeed a common practice of designers, product managers, and companies.
Sphero (a generic SRR). Picture source: http://www.sphero.com/sphero.

The designer explores new design opportunities for SRRs by browsing the map and navigating the various technologies throughout the TSM, some of which are farther or closer than others to the domain “sports and amusement”. Using the map may inspire the designers of Sphero Inc. to consider and relate other technologies for the design of SRRs. Such map navigation behavior is similar to how a traveler uses a geographical map to explore interesting sites or attractions to visit according to their distance or proximity in the physical space. By analogy, when we need the directions for new designs in the technology space, a map of various technologies with their distance or proximity information will be useful. Browsing the overall TSM may inspire the designer to conceive innovative design opportunities in at least two basic manners.
First of all, new design opportunities for SRRs may be conceived as applying SRRs to new applications in other technology domains. When browsing the map, the designer might be reminded of various technology domains, some of which he or she may be unfamiliar with. For instance, seeing “lighting” on the map, a designer may conceive potential applications of the SRRs in providing mobile lighting at home or in public spaces. Finding “agriculture” on the map may inspire the designer about the potential applications of SRRs for agricultural uses, such as soil loosening and fertilizer distribution on farmlands. “Weapon” may stimulate the conception of designing SRRs as bomb carriers or rolling platforms that support machine guns. These ideas are potential SRR design opportunities (see annotations on the map in Fig. 3).
Example design opportunities conceived by applying SRRs to new applications in other domains (oval callouts), or by leveraging technologies in other domains for new designs of SRRs (rectangular callouts).
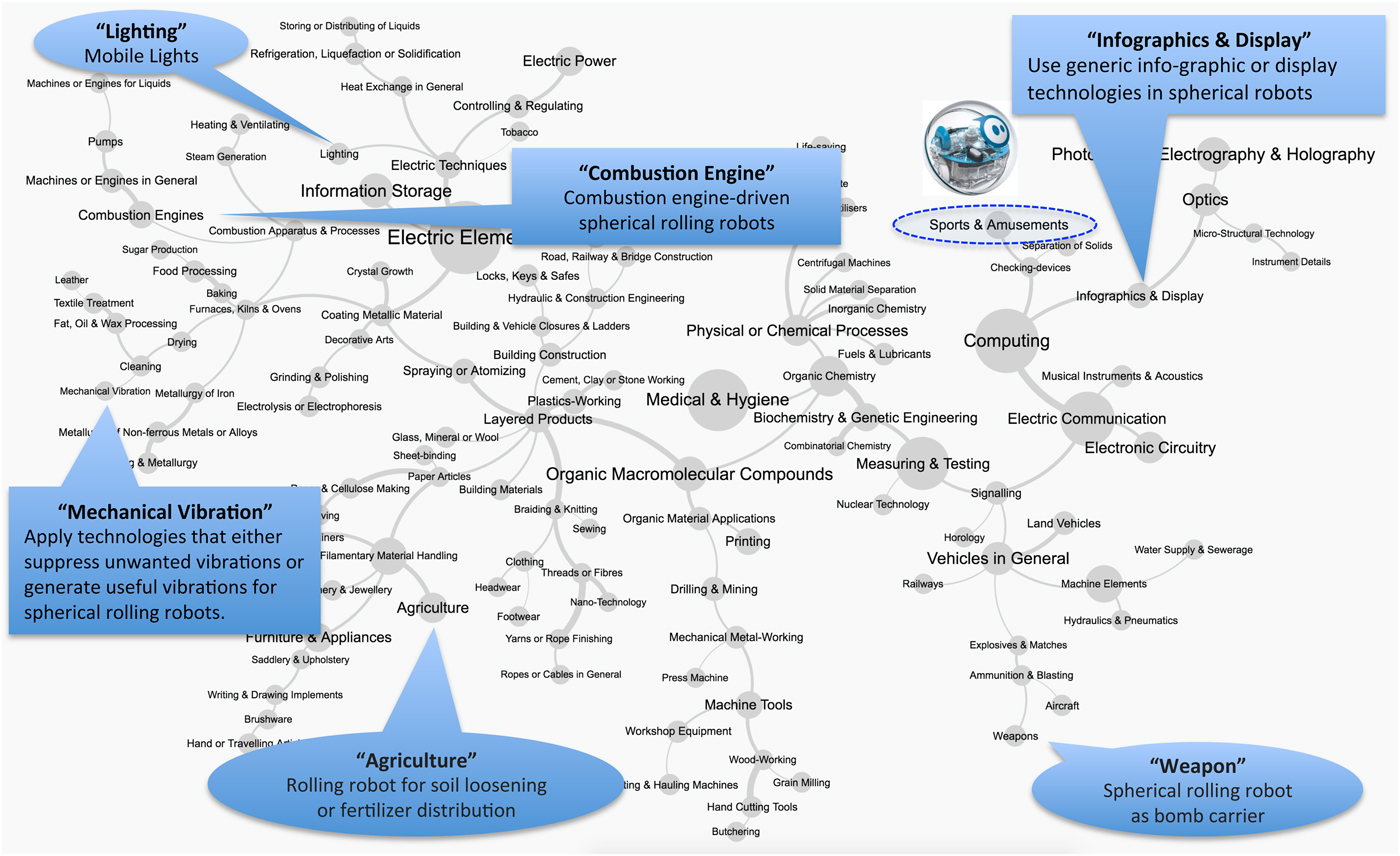
Alternatively, the designer may conceive design opportunities via leveraging technologies or solutions in other domains for new designs of the designer's current technologies or products. In the case of SRRs, seeing “infographics and display” near “sports and amusement” on the map might suggest the exploration of existing infographic or display technologies for potential uses in SRRs. Finding “combustion engines” on the map may stimulate the designer to consider using a combustion engine to propel a large SRR (for carrying goods or passengers). Observing “mechanical vibration” may motivate the designer to explore technologies that either suppress unwanted vibrations or generate useful vibrations for SRRs. These ideas are high-level design directions (annotated in Fig. 3).
The example above is basic and straightforward, and solely for the purpose of demonstrating how to use the TSM as a rapid ideation aid. The first author of the paper rapidly conceived these design opportunities in 10 min, even though he did not have any background in the respective domains, for example, weapons or mechanical vibration technologies. Coming up with these ideas within this short period of time would have been inconceivable without the map. In the next chapter, we present and analyze two experiments (i.e., real TSM use cases), two of several in which we applied the TSM as an ideation tool to enhance ideation practices, to show its value and limitations.
Experiments of TSM as rapid ideation aid
ANN design opportunity ideation
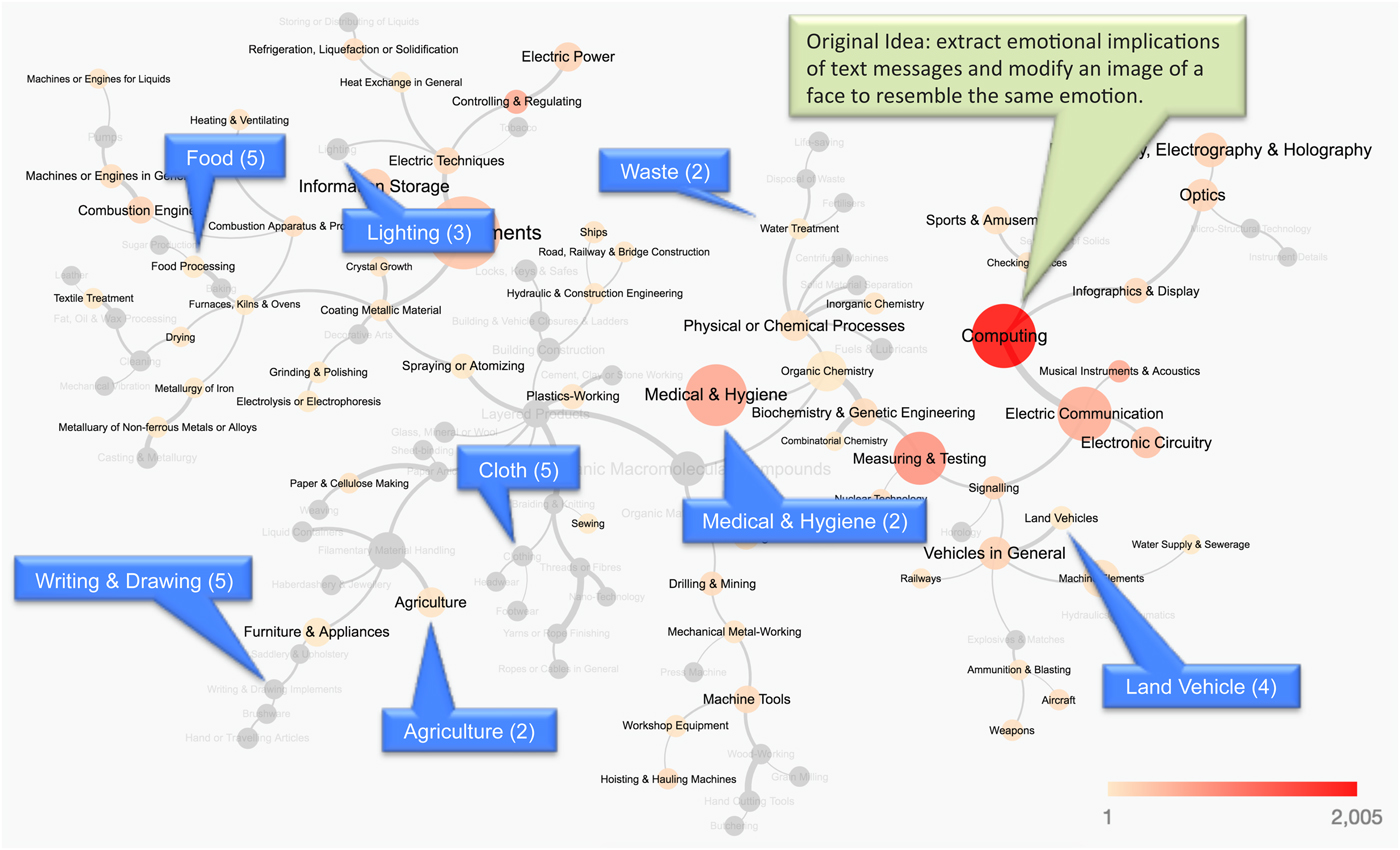
In July 2017, a group of young designers, that is, undergraduate students at Singapore University of Technology and Design (SUTD), took part in an international innovation contest on designing novel and useful applications of “ANN”. This group of young designers brainstormed for 2 days, but only generated one transformative idea they wished to pursue: “extract the emotional implications of text messages and modifying an image of a face to resemble the same emotion”. This idea can be classified in the sole domain “computing” in the TSM. Most ANN technologies today can be found in “computing”. The students were concerned about the limited novelty of their design idea.
To enhance their exploration of design opportunities, we organized a 30-min ideation session using the TSM. We provided each of the designers with the map in Figure 1 printed on an A3 paper, asked them to individually browse the map for opportunities that relate ANN technology to the domains on the map, and annotate the conceived opportunities on the map with pointers to the corresponding inspiration domains. The seven maps annotated by seven designers contained 54 ideas of new ANN design opportunities, with reported inspiration from 29 different domains that have varied distances to “computing” in the technology space.
Some example ideas and the map nodes that inspired these ideas include: ANN suggesting fonts based on the semantics of a paragraph (inspired by the node “writing and drawing implements”), neural network arts (inspired by the node “decorative art”), and protein creation (inspired by “biochemistry and genetic engineering”), and so on. As shown in Figure 4, many ANN design opportunities were inspired by domains that are distant from the main domain of ANN, “computing”. For example, five ideas were in “cloth”, and another five ideas were in “writing and drawing implements”. A search for “neural network” in the patent database found no mention in the classes “cloth” or “writing and drawing implements”. In contrast, the same search term resulted in 2005 patents in the class “computing”, 279 patents in the class “measurement and testing” and 159 in the class “medical and hygiene”. The inspiration domains with no or a small number of ANN prior arts represent the “white space” for innovation and may provide relatively novel design opportunities. The designers compared all the 54 ideas and selected one idea inspired by “writing and drawing implements” for prototyping. They eventually won the first place in the ANN design competition, and the judges gave high scores for novelty of their design.
The map nodes that inspired the largest numbers of new design ideas related to ANN. Numbers of ideas generated regarding a domain are reported in parentheses. Node color intensity corresponds to the number of patents found by the search using “neural network” as keywords. The grey nodes are domains where no ANN patent is found and represent the “white space” for innovation.
We sought feedback from the designers regarding their experiences of using the TSM as a rapid ideation aid. All of them agreed that the map stimulated them to realize the potential of some technology domains that they would not likely have been able to conceive without browsing the map, due to the knowledge distance and their specialization and limited cognitive capacity to cross the knowledge distance. We received the same feedback from other cases in which we applied the TSM as a visual ideation aid, suggesting the map may indeed support designers to think beyond their specialization and familiar domains, and to consider technologies and domains at a large knowledge distance for design.
Entrepreneurial venture opportunity ideation
The ideation activity was conducted in one of the class sessions of the course “30.111 Entrepreneurship” at the SUTD, which is a technical elective course for final year undergraduate engineering students. The core experiential learning component of the course is a semester-long (13 weeks) entrepreneurial design project, which requires the student entrepreneurs to form a team, identify a technology-based venture opportunity, design and produce a working prototype, launch a crowdfunding campaign on Kickstarter.com, and then pitch to angel investors. Most of the projects in this course have been based on hardware designs, and Kickstarter.com requires a working prototype for the crowdfunding campaign. Designs and crowdfunding campaigns from the classes in 2015–2017 can be found at http://www.tech-entrepreneurship.com/.
The design opportunity ideation activity was conducted identically twice for two class sessionsFootnote 2 (group 1 and group 2) in week 3 in September 2017. At that point, the participants, that is, young technical entrepreneurs, have already decided about their venture ideas to design and prototype for the crowdfunding campaign, but have not entered the physical prototyping phase for the project. This situation in the entrepreneurial design project is a typical fuzzy front end. The participants were offered this ideation activity, and told that it would provide them an opportunity to explore broader and possibly better ideas for their design projects. A total of 54 students participated in the activity: 24 in group 1 and 30 in group 2. The activity consisted of the following steps:
(1) Each participant was asked to report the current entrepreneurial vision of his or her team (item #1) and the initial design idea (item #2) to fulfil the vision in a report form, although this ideation activity was individual.
(2) The participants were asked to pivot from their existing idea and generate alternatives that also could potentially fulfil the same vision (item #1). Pivoting is a common practice of technology entrepreneurs, when their original ideas fail to work or they need new opportunities for further growth despite past successes. The participants spent 30 min to rapidly ideate and generate as many new design ideas as possible and reported these as item #3 in the form, using one sentence per idea. Thus, these ideas represent abstract design opportunities.
(3) The participants were given a brief introduction to the total TSM printed on A3 paper, and then asked to spend about 10 min to browse the map, identify the “original domains” on the map, that is, the technology domains of the product or technologies in the original idea (item #2) and report the original domains as item #4 in the form. Such a task allowed the participants to familiarize themselves with the technology domains and structure of the map.
(4) The participants were given 30 min to browse the map and conceive new design opportunities that relate the 121 technology domains labeled on the map to their vision (item #1). They were also encouraged to either (1) apply their original design ideas (item #2) for new applications in other technology domains, or (2) leverage technologies or solutions in other domains to improve their original design idea. Using the provided form, the participants had to report the new ideas (item #5) together with the technology domains that inspired respective ideas, that is, the inspiration domains (item #6). As in step 2, each idea in item #5 had to be described in one sentence.
The resulting data were a one-page form per participant, containing:
(1) A single sentence statement of the vision for his or her entrepreneurial design project;
(2) A brief description of his or her current design idea to fulfil the vision;
(3) New design opportunities rapidly conceived in 30 min;
(4) Original domain(s): the technology domains, that is, three-digit IPC classes, of the product or technologies in the current idea;
(5) New design opportunities rapidly conceived through browsing the map in 30 min;
(6) Inspiration domain(s): the technology domains that provided inspiration for the newly conceived design opportunities in #5.
Data in the report forms allowed us to compare the quantities of design opportunities conceived without versus with browsing the TSM. Assessing the quality and novelty of the design opportunities conceived at this fuzzy front end was not meaningful due to the abstractness of the ideas (described in one sentence) at this stage. The 24 participants in group 1 conceived 126 design opportunities without the map and 165 new design opportunities with the map. The 30 students in group 2 conceived 149 design opportunities without the map and 216 new design opportunities with the map. It seems that the map enhanced rapid ideation productivity, as measured by the number of design opportunities conceived. In particular, we observed that without the map, most participants stopped ideation before 30 min ran out, and the use of the map aid allowed them to conceive new and more design opportunities.
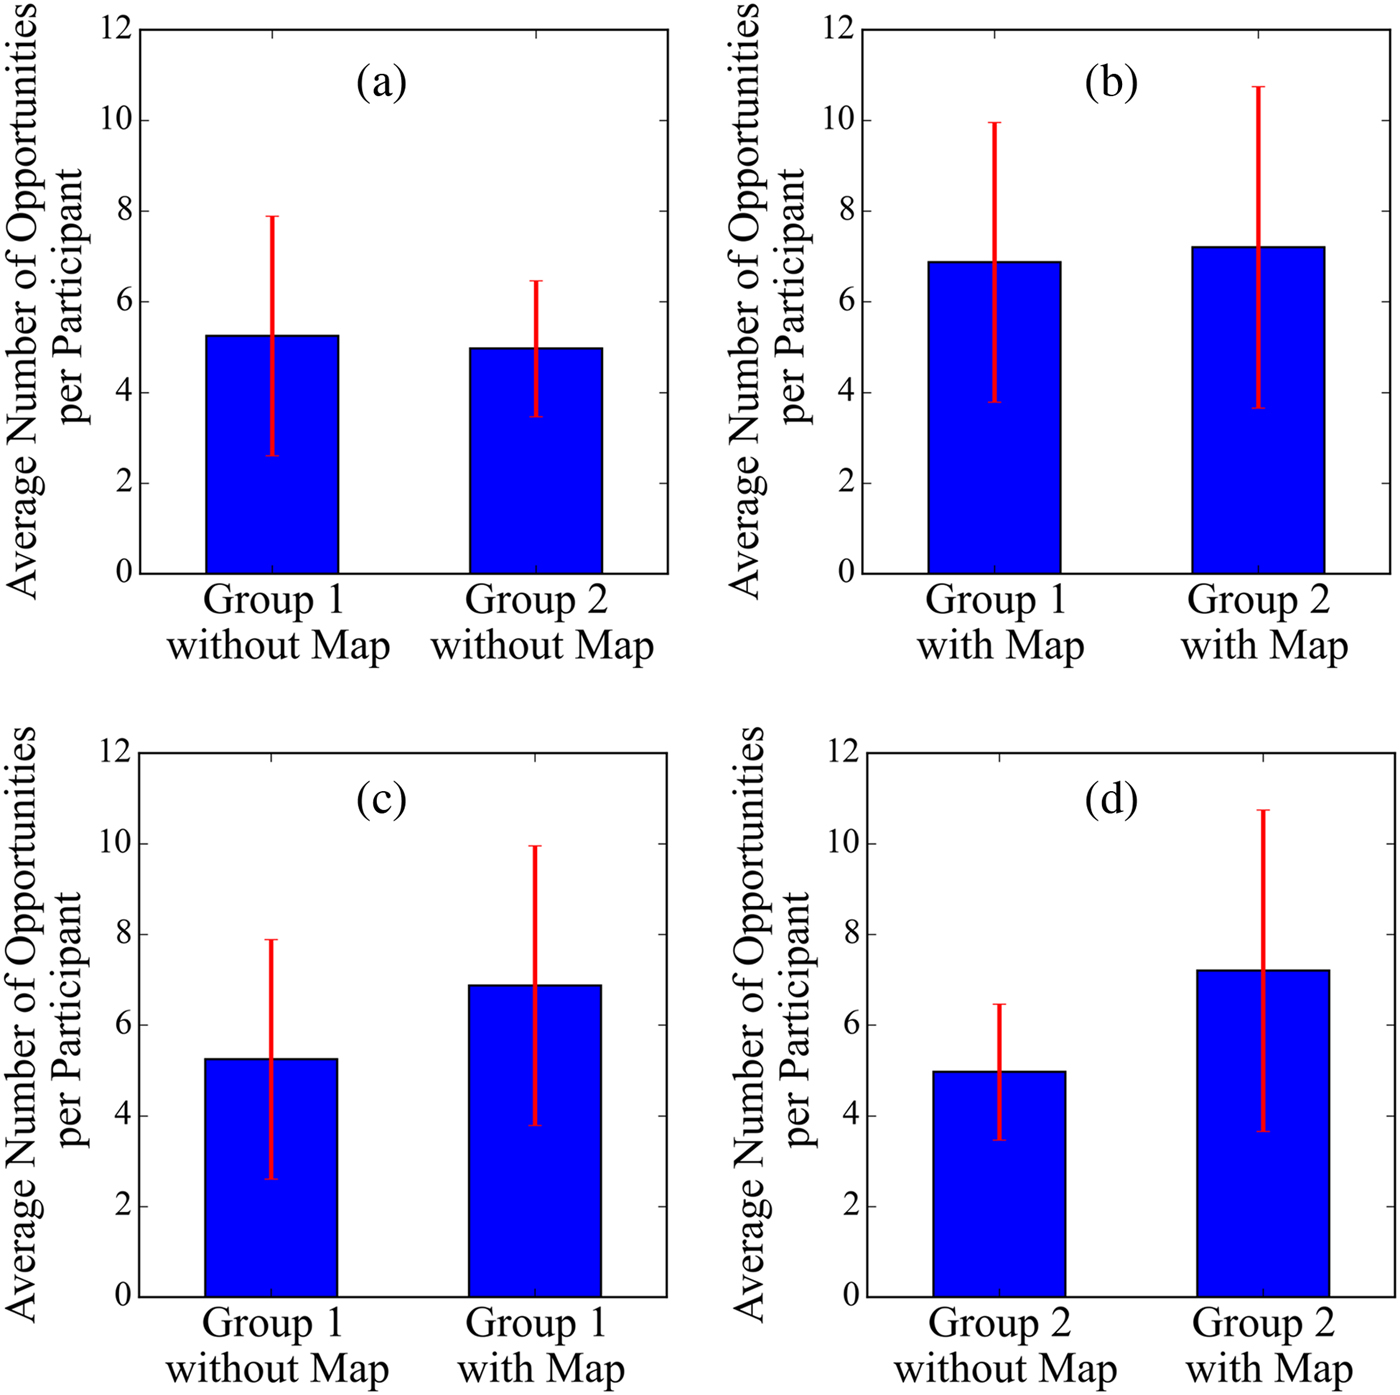
The participants in both groups conceived a similar average number of design opportunities without the map aid (Fig. 5a) and with the map aid (Fig. 5b). With map browsing, the participants conceived about 40% more design opportunities on average (i.e., two more ideas per participant) than they did without the map, in either group (Fig. 5c,d).Footnote 3 These differences are statistically significant based on pairwise t-tests, reported in Table 1. We also communicated with the participants after the rapid ideation activity. The feedback and comments include that the map is inspiring for out-of-the-box thinking, the big picture of various technologies prompts them of the relevance of some technologies or domains that they would not be able to think of or recall without the map, among others.
Comparison in average number of design opportunities conceived per participant with and without using the TSM aid in two groups: (a) distribution by proximity, (b) cumulative distribution by proximity.
The t tests (with p-values in parentheses) for the pairwise comparisons of ideation performances without and with the map in two groups

After the ideation exercise in week 3, students went through additional rounds of ideation, brainstorming, user surveying and market research, prototyping and testing, redesigns, etc. In week 10, 11 teams launched 11 Kickstarter campaigns. Despite the evolution of ideas and projects during the following 8 weeks, we find that the products in later Kickstarter campaigns inherited some elements of the initial design opportunities conceived during the ideation exercise in week 3. Particularly, eight out of 11 Kickstarter products exhibit elements of the initial design opportunities conceived without the TSM, whereas all 11 products inherited elements of the opportunities conceived with the TSM in week 3.
In addition, with inspiration from the literature (see “Literature review” section), we also investigated knowledge distance of conceptual leaps in the technology space between the original domains (item #4) and inspiration domains (item #6) for each new design opportunity conceived with browsing the TSM. Among the total 381 design opportunities, 361 were reported with valid information of their original and inspiration domains for distance analysis. For each of these design opportunities, we first calculated the average knowledge proximity of the inspiration domain(s) to the corresponding original domain(s), and then the proximity percentile of the design opportunity, that is, the percentage of all other non-original domains that have equal or lower average proximities to the original domain(s) than this inspiration domain(s). Figure 6 reports the probability distribution and cumulative probability distribution of the 361 conceptual leaps by their proximity.
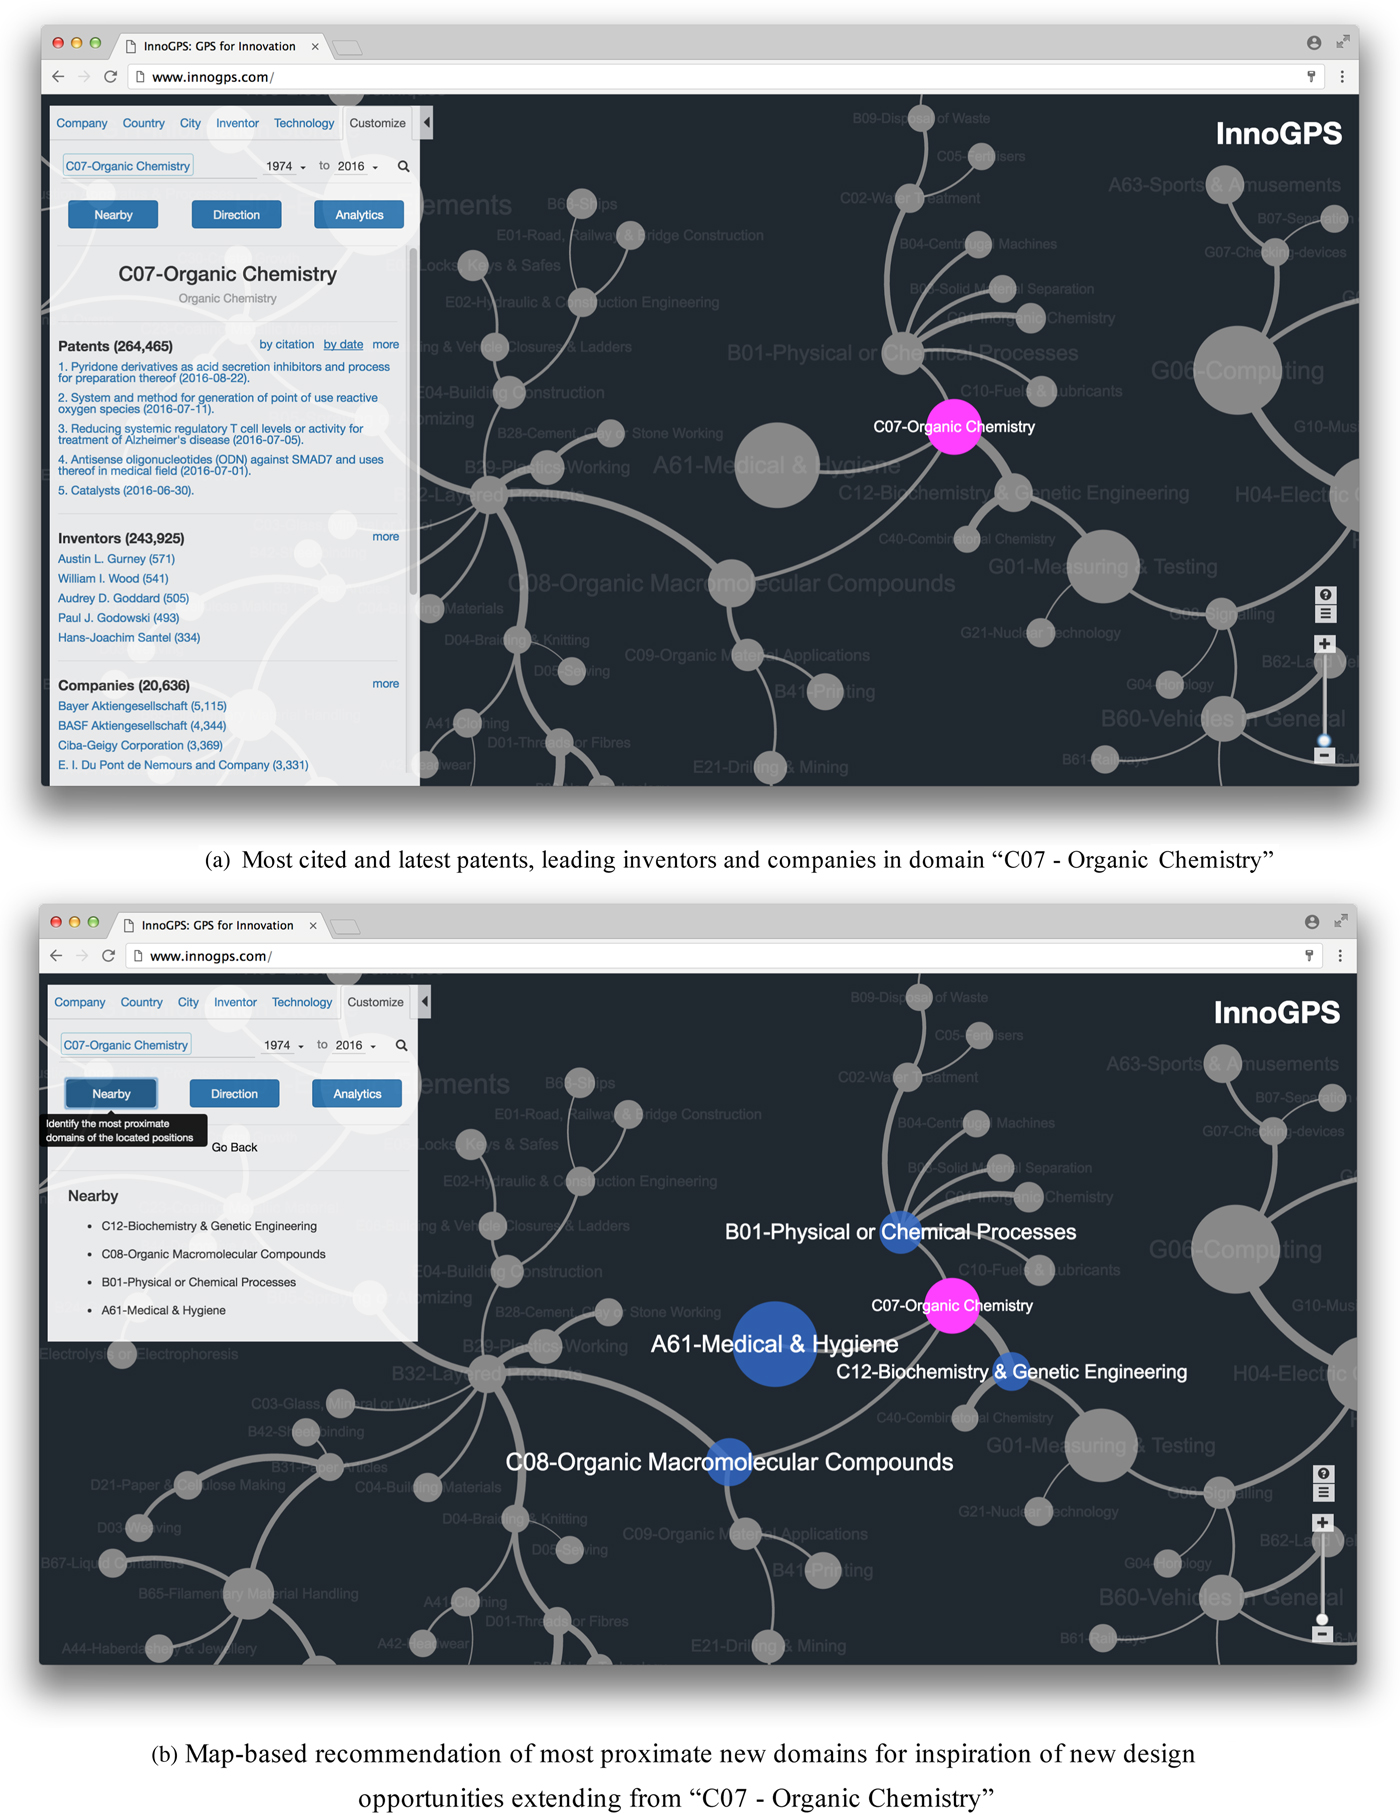
Distribution of conceptual leaps by knowledge proximity in the entrepreneurial design opportunity ideation activity. (a) Most cited and latest patents, leading inventors and companies in domain “C07 – organic chemistry”. (b) Map-based recommendation of most proximate new domains for inspiration of new design opportunities extending from “C07 – organic chemistry”.

The probably distribution's left skewness in Figure 6a and the accumulative distribution curve's being above the main diagonal in Figure 6b suggest that designers are more likely to conceive new design opportunities with the inspiration from domains more proximate to the original domains than from more distant domains.Footnote 4 That is, the inspiration for new design opportunities is strongly conditioned by the knowledge distance between the original domains and the inspiration domains as in our TSM. These results comply with the prior theoretical understanding on conceptual leaps, and suggest that the visual and quantitative information of the relative distances between different technology domains in this specific TSM in Figure 1 may provide indication on the potentials and challenges to conceive design opportunities that relate technology domains with varied distances.
Discussion: potentials and limitations
Computer-aided ideation
Based on the foregoing results and the literature, when navigating technologies on the map to conceive new design opportunities, the designers should be aware of the natural ease and tendency to obtain inspiration from the domains near the present designs, that is, short conceptual leaps, and also be aware of the trade-offs of exploring proximate versus distant domains. In turn, such understanding can be programmed into a computer algorithm to provide intelligent recommendations of new technology domains for consideration and also inform the opportunities and challenges associated with knowledge proximity or distance, when designers navigate the domains on the map for inspiration.
For instance, an algorithm can be developed to recommend the designers a combination of technology domains with near, moderate, and far distances to the original domains of his or her existing products or technologies, and also simultaneously provide theory-based intelligent advice regarding the pros and cons of exploring technologies and domains of different distances to the positions of the designer's current products or technologies. The computer program may embed features to record a designer's browsing behaviors and thus “learn” his or her subconscious preferences. With the machine-learnt preferences of the designer (e.g., novelty vs. ease), the computer algorithm may further make specific recommendations on technologies or domains to the designer, for either meeting the preferences or balancing their biases as aids for design opportunity conception. For example, if the designer has inputted his interest in novelty and radicalness into the software program, but the domains being browsed on the digital map on the computer are always near the original domain(s), the algorithm may intelligently recommend technologies farther from his or her original domain(s) for consideration. By contrast, if the designer prefers the ease and effectiveness of ideation, the system may focus the recommendations on technologies near the original domain(s).
Such machine-learning and intelligent recommendation functions (based on the theoretical understanding) and the TSM (if made digital and interactive) can be potentially integrated into a computer-aided ideation system to enhance designers’ opportunity search and conception process at the fuzzy front end of the design process. With such a computer-aided ideation system, designers still make their own choices to pursue either balanced or biased design opportunity exploration strategies, but the exploration of the vast technology space will be more informed and guided by the theory-based artificial intelligent recommendations and advice. The system does not replace the human in terms of thinking and conceiving new opportunities, but aims to enhance human conception.
Furthermore, the TSM of technology domains illustrated in the present paper is most suitable to conceive abstract design opportunities or high-level design directions, instead of nuanced technical concepts that can be immediately prototyped and implemented. This in part results from our interest and need for the map to represent the total technology space and provide a systematic picture of various technologies that humankind has created today. Thus, the map is naturally at a macro level and the abstract nodes on the map represent domains or aggregations of specific technologies at various levels, rather than actual technologies. In contrast, the patent network of Fu et al. (Reference Fu, Cagan, Kotovsky and Wood2013a) is concrete, but only covers a small set of patents to address a specific predefined function design problem.
After conceiving design opportunities from the inspiration of a domain on the TSM, to further conceive technically detailed design concepts (which have such specifics as sub-functions, components, structures, and working mechanisms for prototyping), the designer may further exploit and learn detailed technologies and specific methods, solutions, and techniques in a domain for inspiration. For instance, the Sphero toy designers can rapidly develop technical knowledge in the “agriculture” domain by working with experts specialized in that domain to actually pursue the perceived high-level design opportunity of rolling robots for fertilizer distribution in farmlands. To pursue vibration-related designs of SRRs, the designer may retrieve and read the patents classified in the IPC class B06 on “mechanical vibration” to learn and use specific mechanical vibration technologies. The designer may start with the most cited patents in B06 to first learn the foundational technologies in the domain and the most recent patents to learn the frontiers. The design information in patent documents may stimulate specific and technical design concepts.
In order to facilitate heuristic interactive map browsing for design opportunity conception, together with domain-specific patent retrieval for stimulating more detailed technical concepts, we have integrated the TSM and map-based functions, such as technology positioning (e.g., position “neural network” or “SRR” on the map), domain recommendation (according to inter-domain knowledge proximity), and domain-specific patent retrieval (via API to directly access live data of the USPTO patent database) in a cloud-based computer-aided ideation system, that is, InnoGPS (accessible at www.innogps.com).
The digitalized TSM and data-driven InnoGPS can potentially enable a knowledge distance-based organization and visualization of the world's existing and growing technologies and design precedents from the patent databases or other design repositories. InnoGPS can further embed the above-mentioned machine-learning and AI functions to enhance the exploration of technology domains for high-level opportunity conception and the search for technologies as stimuli for technical concept generation, according to knowledge distances. Figure 7 shows two screenshots of the interface of InnoGPS. Interested readers are invited to test using InnoGPS.
InnoGPS interface screenshots (www.innogps.com).
Limitations
In the present paper, we have focused on one specific TSM for introduction and demonstration purposes, and only compared the map-aided ideation with the basic ideation with no aid. For further validation of using a TSM with knowledge distance information for ideation, one can compare the outcomes of ideation experiments with browsing the TSM versus just a list of IPC class names. To systematically uncover the advantages, limitations, and applicabilities of the TSM-based ideation, in future research it will be important to conduct human experiments to benchmark it against alternative ideation techniques that are similarly aimed to support early phase design opportunity conception.
Also, the utilities of the TSM might be conditioned by a few design features of the map itself. First of all, the descriptions of technology domains, which are nodes in the map, may use different words and affect human perception about the corresponding technologies and the conception of design opportunities, when the designer browses and reads the map. In particular, the definitional resolution of “technologies domains” also matters. The network map in the present paper is comprised of three-digit IPC classes, which represent relatively broad and general technology domains according to functions and application areas of patents. Each three-digit IPC class can be further decomposed to four-digit classes, each of which can be further decomposed into five-, six-, or seven-digit classes. Maps using finer grained IPC classes may provide more nuanced inspiration, than three-digit IPC classes. Also, patent classes defined in different classification systems, such as IPC, Cooperative Patent Classification (CPC) and United Patent Classification (USPC), as well as other hybrid classification systems, might provide different inspirations and thus conception outcomes.
Secondly, the knowledge proximity between technology domains can be measured using patent data in various ways. Different measures, for example, Jaccard Index, cosine similarity, and co-classification (for a summary and comparison of alternative measures, please refer to Yan and Luo, Reference Yan and Luo2017b) using different information items in the patent documents, may lead to different map structures, which in turn affect the map navigation routes and thus conception outcomes. In this paper, we only experimented with one knowledge proximity measure to construct the TSM. It is still worth exploring the difference in conception outcomes from using alternative maps based on different measures in future research.
In addition, different visualizations and structure layouts of the same network might also affect the map navigation behaviors and conception outcomes. In the present study, the map is created by applying a force-directed algorithm to the MST of the original network. Force-directed algorithm, if applied to a less filtered network, may lead to a different network layout. Heat map, tree map, and contour map are alternatives to network graphs for visualizing the technology space. On such maps, technology domains are still positioned relatively according to their knowledge proximities, despite no links visualized.
In sum, there exist alternative ways to create an empirical map of the total technology space. Despite its demonstrated utility of the TSM based on three-digit IPC classes, cosine similarity metric, and MST layout in this paper, it is unclear if this specific TSM provides the best design opportunity conception outcome. Therefore, the natural next step is to conduct more systemic human experiments to compare alternative TSM designs and also benchmark the TSM-based ideation with other ideation techniques aimed for the same utility. Such comparative and benchmarking studies may potentially identify optimal map designs among the alternatives, as well as proper strategies, procedures, and conditions for the effective use of TSM.
Concluding remarks
To summarize, this paper presents the total TSM as a rapid ideation aid for designers to conceive new design opportunities at the fuzzy front end of the design process. A designer may simply browse the map to navigate various technologies and relate them as a way to quickly conceive new design opportunities. The two experiments suggest that the TSM enables designers to conceive innovative design opportunities across greater knowledge distance, and also conceive more opportunities than they do without the map aid. Interested readers may print out the TSM in Figure 1 and use it to explore design opportunities for their own specialized design practices.
This research contributes to design creativity studies and practice. The TSM aims to make the exploration and conception of new design opportunities more proactive, guided, scientifically grounded, and visually informed. The TSM based on mining the patent data is not new in the information science literature, but was not previously used to support design ideation. Compared with the ideation methods that are used in later stages of design and aimed for solution concepts for prototyping and implementation, the TSM is suitable for conceiving abstract design opportunities and high-level directions at the fuzzy front end. Compared with traditional user studies, expert panels, and market research to identify design opportunities at the fuzzy front end, the TSM does not require any human or financial resources for the rapid ideation of design opportunities.
Particularly, we have integrated the TSM and various map-based functions into the cloud-based system for computer-aided ideation, that is, InnoGPS, to enable interactive digital map browsing for high-level design opportunity conception as well as patent retrieval for stimulating technical concept generation. Machine learning through designers’ map browsing behaviors and creativity theory-based AI recommendation functions can be potentially added into the system to enhance the human process of design opportunity conception.
However, this study is still preliminary. The paper has primarily focused on introducing and demonstrating the method and tool, and only reported evidence on the advantage of ideation using a specific TSM (based on three-digit IPC classes, cosine similarity knowledge distance metric, and MST visualization layout) over basic ideation without any aid. Future research should compare the effects of alternative TSM designs to potentially identify optimal maps for specific use contexts or conditions. Future research should also benchmark the TSM-based ideation method against alternative ideation techniques for early phase design opportunity conception, in order to further uncover the advantages, limitations, and applicabilities of the TSM and then develop procedures and strategies for its effective uses in context.
Acknowledgments
This research is supported by SUTD-MIT International Design Centre (IDC, idc.sutd.edu.sg, IDG31300112) and Singapore Ministry of Education Tier 2 Academic Research Grant (T2MOE1403). The authors are also thankful to the comments from the participants of the Design Creativity workshop at the 17th Conference on Design Computing and Cognition at Northwestern University in 2016.
Jianxi Luo is an Assistant Professor of Engineering Product Development at the Singapore University of Technology and Design (SUTD), where he leads the Data-Driven Innovation Lab. He is also the associate director of SUTD Technology Entrepreneurship Programme. Dr. Luo completed his B.S. (2001) and M.S. (2004) degrees in Thermal Engineering and Automotive Engineering at Tsinghua University, his M.S. degree (2006) in Technology & Policy, and Ph.D. degree (2010) in Engineering Systems at Massachusetts Institute of Technology. His research focuses on mining, analyzing, visualizing and making sense of large scale design and innovation data to develop theories, methods and tools to enhance innovation. Dr. Luo is a chair emeritus of the Technology, Innovation Management, and Entrepreneurship Section of INFORMS.
Binyang Song is a Ph.D. candidate at the Singapore University of Technology & Design (SUTD). She received her B.E. from Tsinghua University in 2011, and she received her M.E. in Power Engineering and Engineering Thermophysics from Tsinghua University in 2014. Her research interests are data-driven design based on technology networks, patent analysis and network analysis.
Lucienne Blessing is Co-Director of SUTD-MIT International Design Centre and Professor of Engineering Product Development at SUTD. She obtained her MSc in Industrial Design Engineering in Delft, the Netherlands and her PhD in Mechanical Engineering at the University of Twente (NL), and an honorary doctorate from the Swedish Mälardalen University. She is a member of the National Academy of Science and Engineering in Germany since 2016, and a member of the steering committee of the European University Association’s Council of Doctoral Education (EUA-CDE) since 2011. Prior to SUTD, Dr. Blessing was the Director of the University of the Greater Region, a network of 6 universities in 4 countries (2013–2016), the vice president for research of the University of Luxembourg (2007–2013), a full professor of at the University of Technology Berlin (2000–2007), and assistant director of the Engineering Design Centre at the University of Cambridge (1995–2000). Her research interests include empirical studies into the product development process, design methodology and theory, methods for early design stages, product service systems, user interface design and user experience, diversity (culture, age and gender), and design research methodology. She is a co-founder and on the advisor board of the Design Society and was co-editor of the journal Research in Engineering Design (1994–2009). She is (co)author of over 160 peer-reviewed publications, and a book on Design Research Methodology together with Prof. Amaresh Chakrabarti. Since 1999 she is co-organizer of the International Summer School on Engineering Design Research.
Kristin L. Wood is the Associate Provost for Graduate Studies, a Professor of Engineering and Product Development (EPD, epd.sutd.edu.sg), founding EPD Head of Pillar, and Co-Director of the SUTD-MIT International Design Center (IDC, idc.sutd.edu.sg) at the Singapore University of Technology and Design (SUTD, sutd.edu.sg). Dr. Wood completed his M.S. and Ph.D. degrees in the Division of Engineering and Applied Science at the California Institute of Technology, where he was an AT&T Bell Laboratories Ph.D. Scholar. Dr. Wood joined the faculty at the University of Texas in September 1989 and established a computational and experimental laboratory for research in engineering design and manufacturing, in addition to a teaching laboratory for prototyping, reverse engineering measurements, and testing. During the 1997–98 academic year, Dr. Wood was a Distinguished Visiting Professor at the United States Air Force Academy. Through 2011, Dr. Wood was a Professor of Mechanical Engineering, Design & Manufacturing Division at The University of Texas at Austin. He was a National Science Foundation Young Investigator, the Cullen Trust for Higher Education Endowed Professor in Engineering, University Distinguished Teaching Professor, and the Director of the Manufacturing and Design Laboratory (MaDLab) and MORPH Laboratory. Dr. Wood has published more than 450 refereed articles and books, has received more than 70 national and international awards in design, research, and education, consulted with more than 100 companies (MNCs, SMEs, and startups) and government organizations on Design Innovation and Design Thinking, and is a Fellow of the American Society of Mechanical Engineers (ASME).


