





Introduction
The aviation industry has become an important part of the global economy as a continuously growing and developing sector. In this industry, the ability of aircraft to operate safely and consistently is a fundamental requirement for both passenger and cargo transportation. Therefore, the maintenance of passenger and commercial aircraft is of great importance. Proper planning and management of maintenance can reduce operating costs and enhance the safety of operations.
Conventional maintenance strategies are generally time-based, requiring aircraft to undergo maintenance at regular intervals. However, this method can be expensive and result in redundant maintenance. Predictive maintenance (PdM) provides an alternative solution. Utilizing data analytics and machine learning (ML) methods, it is feasible to monitor aircraft engines and other vital components in real-time and forecast maintenance needs beforehand. This approach can lower maintenance expenses and reduce operational disruptions for aircraft.
PdM aims to predict future maintenance needs by utilizing time-series data from operational facilities, such as hangars. This approach’s main goal is to accurately determine when an aircraft component requires servicing. Delaying maintenance can extend a component’s usage period, but performing it too late might lead to unexpected failures, reducing the component’s lifespan. Thus, improving the accuracy of predicting component lifespan has been a consistent priority. In this context, this study leverages ML, a subset of Artificial Intelligence, which focuses on analyzing large datasets to uncover complex patterns. Although the fundamental architecture and ideas were developed many generations ago, the necessary amount of data and computational power to make this possible has only recently become available.
The benefits of ML applications include reduced maintenance costs, fewer repair stations, decreased machine failures, extended spare part lifespan, reduced inventory, increased operator safety, enhanced production, and repair validation, as well as improvements in sensor accuracy, fuel level monitoring, ice detection, and overall profitability (EASA, 2015).
The primary objective of this study is to determine the effectiveness of data-driven PdM approaches over traditional methods in the maintenance of aircraft engines and to systematically compare the performance of widely used ML algorithms for this purpose. Efficient and reliable management of maintenance processes in the aviation industry is of great importance from both economic and operational perspectives. Traditional maintenance strategies are based on time-scheduled inspections carried out at regular intervals, which often result in unnecessary maintenance activities, leading to high costs and operational disruptions (Van den Bergh et al., Reference Van den Bergh, De Bruecker, Beliën and Peeters2013). In addition to increasing maintenance costs, this also poses critical safety risks due to the inability to detect potential failures in advance.
PdM methods aim to address these issues by analyzing real-time data collected from sensors to predict potential engine failures and schedule maintenance actions at the appropriate time. In this way, costs can be reduced, operational continuity improved, and safety risks minimized (Capodieci et al., Reference Capodieci, Caricato, Carlucci, Ficarella, Mainetti and Vergallo2020). Although various ML algorithms have been frequently studied in PdM processes for aircraft engines, the literature lacks clear and systematic comparisons that reveal which algorithms perform more effectively under which conditions and performance criteria (Celikmih et al., Reference Celikmih, Inan and Uguz2020; Singh et al., Reference Singh, Kumar, Arya and Kumar2020).
To fill this gap, the present study comprehensively evaluates the performance of 10 different ML algorithms (Support Vector Machine [SVM], Decision Tree [DT], k-Nearest Neighbors [KNN], Extreme Gradient Boosting [XGBoost], Logistic Regression [LR], Random Forest [RF], Naïve Bayes [NB], LightGBM, CatBoost, and Gradient Boosting) and 3 learning models (MLP, GRU, and LSTM) on the Commercial Modular Aero-Propulsion System Simulation (C-MAPSS) dataset. Accordingly, the study analyzes algorithmic performance using objective metrics, such as accuracy, precision, recall, and F1-score, providing a scientifically grounded reference for PdM applications. Such systematic comparisons are critically important, as they serve as a valuable guide for optimizing maintenance strategies in a data-driven manner. Therefore, the study aims to contribute to the aviation industry both economically and in terms of safety by improving the efficiency of PdM processes.
The subsequent sections of this study will begin with Section “Motivation and contribution”, which provides a comprehensive literature review, analyzing prior research and the current state of knowledge on the subject. Section “Background” will focus on the methodology by explaining the methods and analysis processes used in the research. Sections “Related work” and “Materials and methods” will present the findings and discuss the results, respectively. Section “Findings”, the study’s limitations, practical implications, and suggestions for future research will be presented. Finally, Section "Discussion and conclusion" will synthesize the main findings, interpret their theoretical and practical implications for predictive maintenance in aviation, and summarize the overall contributions of the study while outlining concluding remarks.
Motivation and contribution
Background on the economic and safety relevance of PdM is summarized in the Introduction; this section focuses on identified gaps and the study’s specific contributions.
While existing research has made significant progress in applying ML techniques to PdM, most studies have primarily focused on the remaining useful life (RUL) estimation using regression-based approaches. These models aim to forecast the exact time-to-failure, but they often require extensive calibration and are sensitive to noise in continuous target values. Moreover, such models are typically evaluated using limited performance metrics – often relying solely on RMSE (Root Mean Square Error) or MAE (Mean Absolute Error) – without fully considering operational decision-making requirements.
More importantly, there remains a notable gap in the literature regarding classification-based PdM frameworks, especially those designed for binary failure prediction tasks, which are more aligned with real-world decision-making (e.g., “Will this component fail within the next 30 cycles?”). This binary framing reflects how maintenance teams make threshold-based interventions, such as replacing a part once the risk crosses a certain limit.
Additionally, prior works often:
-
• lack systematic hyperparameter tuning, leading to suboptimal performance;
-
• do not address class imbalance, which is a critical issue in rare failure detection tasks;
-
• focus on a narrow subset of ML models, omitting deep learning (DL) techniques; and
-
• use inconsistent preprocessing steps, making comparisons unreliable.
This study aims to bridge these gaps and offers several novel contributions to the field:
-
1. Reframing PdM as a binary classification task: Instead of predicting continuous RUL values, this study formulates the problem as a binary classification – predicting whether an engine will fail within the next 30 cycles – using the widely accepted C-MAPSS dataset. This approach offers practical interpretability and aligns more closely with aviation maintenance decision-making. The 30-cycle horizon reflects typical short-term maintenance planning windows used for shop-visit scheduling and part-replacement thresholds in practice.
-
2. Comprehensive model benchmarking with DL integration: This study compares 13 models – 10 traditional ML models (LR, DT, RF, SVM, KNN, NB, XGBoost, LightGBM, CatBoost, and Gradient Boosting) and 3 DL models (MLP, GRU, and LSTM) – to establish a broad, classification-focused PdM baseline.
-
3. Advanced preprocessing and class imbalance handling: The study applies Min–Max normalization and addresses the common but often overlooked issue of class imbalance by incorporating the Synthetic Minority Over-sampling Technique (SMOTE), particularly to enhance the sensitivity of models like RF in detecting minority (failure) classes.
-
4. Systematic hyperparameter optimization using dual methods: Both GridSearchCV and BayesSearchCV are used to optimize model performance. The study compares these methods in terms of both accuracy and computational efficiency, providing empirical guidance for future research on model tuning strategies in PdM contexts.
-
5. Robust performance evaluation with multiple metrics: Model performance is assessed using accuracy, precision, recall, and F1-score, offering a balanced view that captures both economic efficiency (via precision) and safety-critical concerns (via recall). Additionally, receiver operating characteristic–area under the curve (ROC–AUC) scores –are used to measure discriminative ability across thresholds.
-
6. Model explainability via Shapley Additive Explanations (SHAP): This study conducts a comprehensive SHAP analysis across all learner families, providing global interpretability that clarifies not only what is predicted but also why. The analysis supports auditability for safety-critical contexts and informs feature/sensor prioritization (see Section “Model explainability analysis” and Figure 3).
-
7. Statistical significance of model differences: This study applies a nonparametric repeated-measures protocol with a Friedman omnibus test followed, when significant, by Holm-corrected Wilcoxon signed-rank post-hoc comparisons, confirming that observed performance gaps are robust across folds (see Section “Statistical comparison protocol” and Tables 8–9).
-
8. Cross-study benchmarking and reproducibility: The results are systematically compared with findings from prior works (e.g., Soni et al., Reference Soni, Khan, Zubair and Garg2021; Al Hasib et al., Reference Al Hasib, Rahman, Khabir and Shawon2023; Sharma et al., Reference Sharma, Kodipalli, Rao, BR, Sripradha and Nikita2023, Melkumian, Reference Melkumian2024), providing a performance-oriented benchmark. Unlike earlier studies, this paper ensures reproducibility by unifying preprocessing pipelines, using consistent metrics, and documenting all parameter configurations.
By addressing both technical (e.g., model variety, data balancing, and optimization) and methodological (e.g., problem framing and evaluation criteria) limitations of the existing literature, this study provides a robust and replicable framework for classification-based PdM in aviation. Its contributions support not only academic advancement in PdM research but also practical decision-making in safety-critical operational environments such as aircraft engine maintenance.
Background
The aircraft maintenance process is divided into two categories: traditional maintenance (corrective-preventive maintenance) and PdM.
Traditional maintenance
Aircraft maintenance involves routine tasks performed at specific intervals or after certain flight hours. While this ensures timely and scheduled maintenance, it can also lead to unnecessary procedures. Time-based maintenance includes four main types of checks: A, B, C, and D. These checks vary in their extent, duration, and how often they are needed.
The A-check, which is the most frequently performed, is required approximately every 65 flight hours, or about once a week. B-check maintenance, conducted every 300–600 flight hours, involves a detailed visual inspection and lubrication of all moving parts, such as ailerons and horizontal stabilizers. Major inspections, including C-check and D-check, occur every 4 years and necessitate taking the aircraft out of service for at least a month. Because of their infrequency, C-check and D-check inspections are often not included in regular maintenance planning, highlighting the dynamic nature of the aviation industry. Airlines primarily concentrate on adhering to A-check and B-check schedules within a 4-day maintenance cycle, with inspections and repairs typically conducted overnight until all required conditions are met (Van den Bergh et al., Reference Van den Bergh, De Bruecker, Beliën and Peeters2013).
Terminology note
In this paper, the maintenance terms are used consistently as follows: corrective/reactive maintenance = intervention after a failure; preventive maintenance (PM) = time−/cycle-based, scheduled intervention before failure; PdM = condition-based, prognostics-driven intervention dynamically triggered by estimated failure risk.
Corrective maintenance
This maintenance, also known as reactive maintenance, is unplanned and involves repairing equipment after a failure occurs. This maintenance type is often applied to simple equipment or components and is suitable for situations that do not impact safety but cause operational downtime (Eker, Reference Eker2015). Items like home appliances and mobile devices frequently use corrective maintenance. Since the operational breakdown of these items typically does not lead to severe consequences and can be quickly repaired or replaced, it is usually more practical to address failures as they happen rather than prevent them (Xing and Marwala, Reference Xing and Marwala2018).
However, many complex industrial systems have various issues and weaknesses. For example, functional malfunctions in passenger aircraft are directly related to safety concerns, making corrective maintenance impractical after a failure. Therefore, proactive maintenance is crucial in complex industrial sectors, such as aviation, maritime, automotive, and large-scale industrial equipment.
Preventive maintenance
PM refers to scheduled, time- or cycle-based actions performed before any failure occurs, such as periodic inspections, adjustments, and part replacements planned on fixed intervals. The objective is to reduce the likelihood of unexpected faults and ensure safety and availability (e.g., routine A/B/C/D checks in aviation). Unlike corrective/reactive maintenance (carried out after a fault), PM is planned in advance; unlike PdM, PM does not rely on real-time condition-based prognostics to dynamically trigger interventions.
Predictive maintenance
PdM leverages sensor-driven diagnostics and prognostics to anticipate failures before they occur, thereby reducing unplanned downtime and maintenance costs. In this study, PdM is cast as a short-term, binary decision problem (failure within 30 cycles) to align with operational thresholds. The end-to-end pipeline conceptually comprises standard preprocessing, feature construction, model training, evaluation, and thresholding, and is model-agnostic – compatible with both classical ML and DL classifiers. This subsection provides only the conceptual background; prior art and methodological comparisons are synthesized in Section “Related work”.
Related work
RUL-oriented regression
On turbofan and similar engine datasets, DL approaches for continuous RUL prediction are prevalent (Youness and Aalah, Reference Youness and Aalah2023). LSTM- and Convolutional Neural Network (CNN)–based models capture temporal dependencies and often outperform traditional methods (Sateesh Babu et al., Reference Sateesh Babu, Zhao and Li2016; Zheng et al., Reference Zheng, Ristovski, Farahat and Gupta2017). Likewise, similarity-based prognostics estimate RUL by matching degradation patterns (Wang et al., Reference Wang, Yu, Siegel and Lee2008). However, these studies primarily optimize regression metrics, such as RMSE, and do not align directly with operational decision thresholds (e.g., near-term failure windows). Broad classical-method surveys also exist (Mathew et al., Reference Mathew, Toby, Singh, Rao and Kumar2017), but they remain largely within a regression framing.
Classification-based PdM
A second line of work frames risk as a binary or multiclass problem by labeling remaining cycles into ranges or by directly predicting failure/no failure, typically using RF, SVM, XGBoost, and related classifiers (Soni et al., Reference Soni, Khan, Zubair and Garg2021; Sharma et al., Reference Sharma, Kodipalli, Rao, BR, Sripradha and Nikita2023). In the broader aircraft maintenance ecosystem, text and event logs have been used to anticipate high-priority defects (Yan and Zhou, Reference Yan and Zhou2017), and peripheral maintenance decisions (e.g., spare-part demand) have been modeled with conventional classifiers, such as NB and LR (Capodieci et al., Reference Capodieci, Caricato, Carlucci, Ficarella, Mainetti and Vergallo2020). Some studies apply MLP or SVM for equipment-failure prediction (Celikmih et al., Reference Celikmih, Inan and Uguz2020). Yet many of these efforts feature limited model diversity, minimal DL integration, or narrow comparisons; several focus on a small subset of classifier families (Singh et al., Reference Singh, Kumar, Arya and Kumar2020). Comprehensive reviews of ML in manufacturing (Sarkon et al., Reference Sarkon, Safaei, Kenevisi, Arman and Zeeshan2022) seldom provide a systematic, side-by-side performance assessment tailored to aircraft maintenance.
Class imbalance and hyperparameter optimization
PdM datasets are typically imbalanced – early-failure examples are scarce – which calls for resampling (e.g., SMOTE), class weighting, cost-sensitive learning, or calibrated thresholds. Nevertheless, such techniques are not consistently or systematically applied, and hyperparameter search is often limited. For instance, some classification studies report results without DL components and without comprehensive Grid/Bayesian search (Soni et al., Reference Soni, Khan, Zubair and Garg2021; Sharma et al., Reference Sharma, Kodipalli, Rao, BR, Sripradha and Nikita2023) even broad regression comparisons frequently treat optimization and balancing as secondary (Mathew et al., Reference Mathew, Toby, Singh, Rao and Kumar2017). These gaps hinder alignment with operational objectives and limit generalizability across metrics such as precision, recall, F1-score, and ROC–AUC.
Synthesis and research gaps
-
• GAP-1: Within classification-based PdM, wide-scope benchmarks under a unified protocol are scarce. This study response: A single pipeline benchmarking 10 classical ML models (LR, DT, RF, SVM, KNN, NB, XGBoost, LightGBM, CatBoost, and Gradient Boosting) and 3 DL models (MLP, GRU, and LSTM) with shared preprocessing and evaluation.
-
• GAP-2: Limited DL integration together with systematic class balancing and hyperparameter optimization in comparative evaluations. This study response: Inclusion of MLP, SMOTE for class balance, dual tuning (GridSearchCV + BayesSearchCV), and multi-metric reporting (accuracy, precision, recall, F1-score, and ROC–AUC).
A consolidated side-by-side summary appears in Table 1. In contrast, the present study distinguishes itself through a comprehensive benchmarking framework involving 10 traditional ML models and 3 DL models. It incorporates advanced methodological elements, such as hyperparameter optimization via GridSearchCV and BayesSearchCV, class balancing with SMOTE, and multi-metric evaluation including accuracy, precision, recall, F1-score, and ROC–AUC. Additionally, the classification task is explicitly framed as short-term failure prediction within 30 cycles, offering an operationally meaningful and relatively underexplored perspective in PdM research.
Comparative summary of related studies on PdM using the C-MAPSS dataset

Materials and methods
The methodology of this study is based on a systematic comparison of the performance of ML algorithms on the widely accepted C-MAPSS dataset, with the aim of predicting maintenance needs for aircraft engines. Initially, data normalization was performed using the Min–Max scaling method, and engine failure prediction was formulated as a binary classification problem. Dataset partitioning followed the official C-MAPSS train/test split, and hyperparameters were tuned via cross-validation on the training portion (see Sections “Train/validation protocol and cross-validation” and “Hyperparameter tuning”). Model performances were evaluated using standard metrics, such as accuracy, precision, recall, and F1-score (Capodieci et al., Reference Capodieci, Caricato, Carlucci, Ficarella, Mainetti and Vergallo2020; Celikmih et al., Reference Celikmih, Inan and Uguz2020). All analyses were implemented in a Python-based Jupyter Notebook environment.
Dataset characteristics
Although real-world aircraft engine sensor data would offer the most direct validation environment, such datasets are rarely accessible due to stringent confidentiality agreements and aviation safety protocols. Existing public datasets, such as anonymized subsets of Flight Data Recorder (FDR) data, are typically restricted and only available upon request for research purposes (PHM Society, Reference Saxena, Goebel, Simon and Eklund2008). Similarly, the National General Aviation Flight Information Database provides partial telemetry data (e.g., Exhaust Gas Temperature, Cylinder Head Temperature, and Revolutions Per Minute) from general aviation but lacks the parameter resolution and turbofan-specific detail required for developing and validating comprehensive PdM models (National General Aviation Flight Information Database, 2024; DeCastro, Reference DeCastro2008). This study uses the NASA C-MAPSS turbofan run-to-failure data set (Saxena and Goebel, Reference Saxena and Goebel2008). The run-to-failure trajectories are generated by the physics-based C-MAPSS (Frederick et al., Reference Frederick, DeCastro and Litt2007), and the damage progression used to synthesize degradation is modeled following Saxena et al. (Reference Saxena, Goebel, Simon and Eklund2008). Given its physics-based construction and widespread use in PdM research, C-MAPSS is widely regarded as a practical proxy for real engine behavior and supports reproducible, benchmark-driven studies (Frederick et al., Reference Frederick, DeCastro and Litt2007; Saxena and Goebel, Reference Saxena and Goebel2008; Saxena et al., Reference Saxena, Goebel, Simon and Eklund2008).
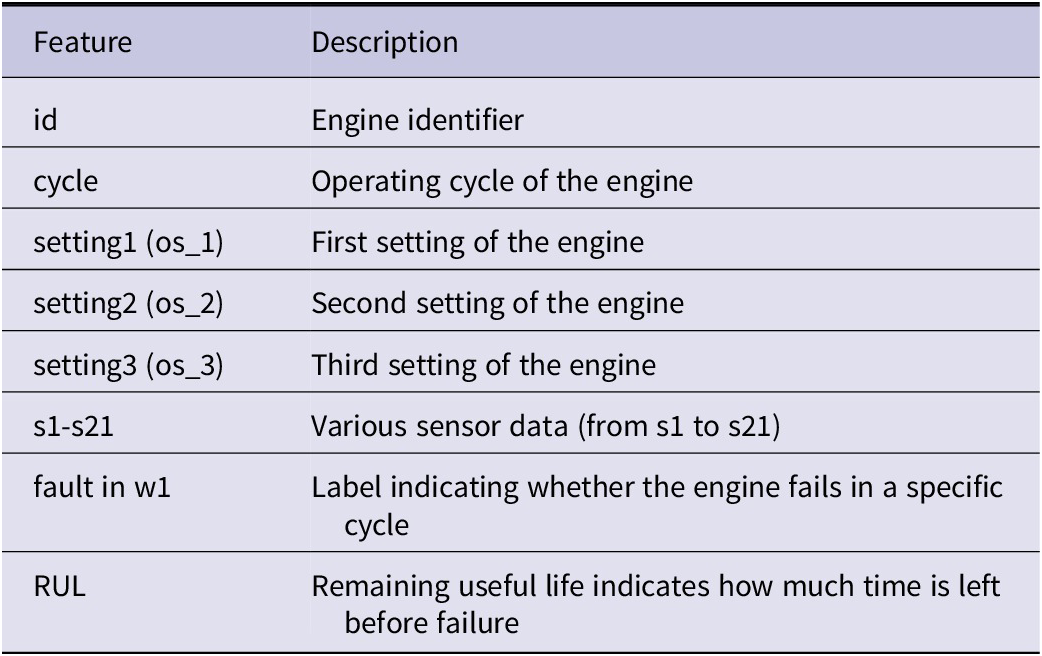
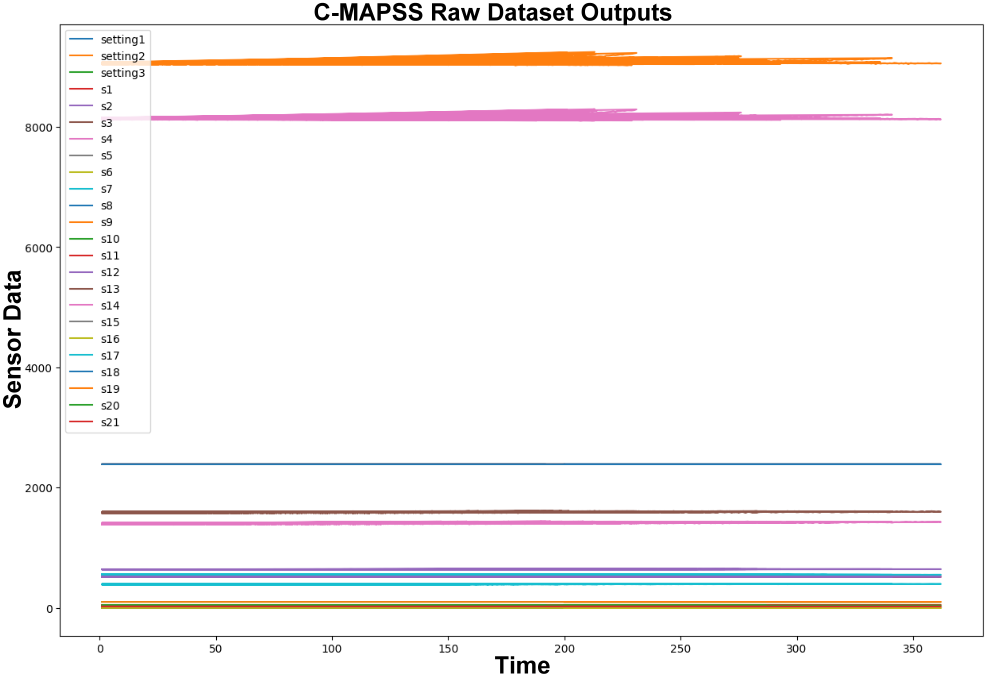
Table 2 and Figure 1 illustrate the characteristics of the C-MAPSS dataset and the outputs derived from the raw data.
C-MAPSS dataset features
Representative raw time-series from the NASA C-MAPSS turbofan dataset showing run-to-failure behavior across engine cycles and selected sensor channels (s1–s21); these raw outputs underpin subsequent preprocessing and label/RUL derivation.

Data normalization
The dataset was normalized using the Min–Max normalization method, which scales the data to a defined range, typically between 0 and 1. Normalized data helps ML algorithms to perform better. The normalization process for the C-MAPSS dataset includes the following steps:
-
1. The dataset was sorted by ID in a loop to process the data for each engine separately.
-
2. The maximum cycle count for each engine was calculated, and this information was added to the dataset.
-
3. RUL was calculated for each engine ID as shown in Table 3.
-
4. Min–Max normalization was applied to the cycle columns.
-
5. A label indicating whether an engine will fail within w1 cycles was created. If $ RUL\le 30 $
cycles, the binary label fault_in_w1 is set to 1; otherwise, it is set to 0. The continuous RUL field is left unchanged. After normalization, the data are shaped as shown in Table 4.
$ RUL\le 30 $
cycles, the binary label fault_in_w1 is set to 1; otherwise, it is set to 0. The continuous RUL field is left unchanged. After normalization, the data are shaped as shown in Table 4.

RUL calculation in C-MAPSS data set preprocessing step

Dataset after w1 label assignment

Results and observations after normalization
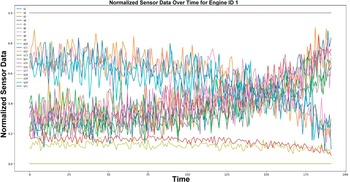
The normalization process makes the dataset suitable for ML modeling. The data are scaled to a range between “0” and “1,” and unnecessary information is cleaned. With the “Failure Within w1” label, the data are made suitable for binary classification methodology in ML. This aims to improve model training and achieve better results. Additionally, using data visualization, how different sensor data of engines change over time is shown in Figure 2. This method provides valuable insights for engine health monitoring and failure prediction.
Post-Min–Max normalization view of scaled C-MAPSS sensor time-series (e.g., Engine ID = 1), providing visual context for the binary label “failure within w1 = 30 cycles.

ML models
ML is a discipline that allows computer systems to perform future tasks better by learning from their experiences. The primary tools used in this process are ML algorithms. These algorithms can identify patterns in datasets, perform classification and regression tasks, discover complex relationships, and make autonomous decisions. Each algorithm offers an approach that is more suitable for a specific type of problem.
In this study, the selection of algorithms was based on a systematic approach that considered both their demonstrated effectiveness in recent PdM literature and their suitability for aircraft engine maintenance applications. Candidate algorithms were identified based on their frequent and successful use in PdM studies (Mathew et al., Reference Mathew, Toby, Singh, Rao and Kumar2017; Capodieci et al., Reference Capodieci, Caricato, Carlucci, Ficarella, Mainetti and Vergallo2020; Singh et al., Reference Singh, Kumar, Arya and Kumar2020). From this pool, models showing high performance in preliminary evaluations, specifically in terms of accuracy, precision, recall, and F1-score.
The selected models include 10 traditional ML algorithms – LR (linear), DT, and RF (tree-based), XGBoost, LightGBM, CatBoost, and Gradient Boosting (gradient-boosted trees), KNN (instance-based), SVM (kernel-based), and NB (probabilistic) – and 3 DL models, including MLP, GRU, and LSTM (sequence models).
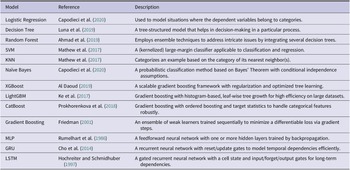
These models not only represent a broad range of algorithmic families but also align well with the data structure and feature space of the C-MAPSS dataset (Capodieci et al., Reference Capodieci, Caricato, Carlucci, Ficarella, Mainetti and Vergallo2020; Celikmih et al., Reference Celikmih, Inan and Uguz2020). Table 5 presents the ML models utilized in this study, along with their descriptions.
Classical and deep learning models for time-series benchmarking. The comparison includes classical ML baselines and deep learning architectures, including sequence models (GRU and LSTM) tailored to the temporal dependencies in the C -MAPSS dataset

This study used a fixed input set of 24 exogenous C-MAPSS variables – operational settings os_1–os_3 and sensors s1–s21 – applied uniformly across all models; engine_id, cycle, and the target (RUL) were excluded. Cross-model global importance and directional effects for these inputs were verified via a model-agnostic SHAP analysis (Section “Model explainability analysis”), ensuring transparency and reproducibility.
Additionally, all models underwent hyperparameter tuning using grid search before final analysis, and the best-performing algorithms – based on objective evaluation metrics – were used for in-depth comparison. This systematic and evidence-based approach ensured methodological transparency, academic rigor, and reproducibility of the results.
Models implementation
The aviation industry possesses extensive operational and maintenance records that, when combined with ML, can be used to forecast failures and inform maintenance actions. A notable study applied ML models to predict failures in aviation systems through feature extraction and data reduction (Yan and Zhou, Reference Yan and Zhou2017).
PdM leverages live condition-monitoring data from contemporary aircraft systems. By analyzing historical maintenance records and flight-recorded sensor streams, a predictive model is trained to anticipate high-priority failures, enabling condition-based, PdM-driven interventions based on the model’s outputs. Following Soni et al. (Reference Soni, Khan, Zubair and Garg2021), forecasting failures with different priorities can be framed as a binary classification problem; this formulation contrasts with the approach detailed in Yan and Zhou (Reference Yan and Zhou2017).
Over time, maintenance technology has advanced with strategies designed to reduce the likelihood and impact of failures. Consistent with the terminology used in Section “Traditional maintenance”, maintenance strategies are generally categorized into three types: corrective (reactive) maintenance (intervention after a failure), PM (time-/cycle-based scheduled intervention before failure), and PdM (condition-based, prognostics-driven intervention dynamically triggered by estimated failure risk). This section details the ML implementation choices within these strategies – particularly PdM, where model design, data pipelines, and evaluation protocols are critical.
Implementation platform
Platforms for Data Science and ML provide tools for the creation, execution, and assessment of ML algorithms Çınar et al. (Reference Çınar, Abdussalam Nuhu, Zeeshan, Korhan, Asmael and Safaei2020). In PdM, sensors are first installed in the system to gather and track condition data. Time-series data plays a pivotal role in PdM, including timestamps, synchronized sensor readings, and device identifiers. The aim of PdM is to predict whether equipment will fail at a specific future time based on accumulated data. There are two main strategies in PdM: using classification techniques to predict the success of actions and employing regression techniques to estimate the time until the next failure (RUL). In this study, a binary classification approach was applied.
Training the data
Before applying classification models, the training data was labeled, and the model was trained on this data. The dataset was separated into features (X) and targets (y). The definitions for data partitioning and training are outlined as follows:
-
• X_train, X_test, y_train, y_test: Data partitioning follows the official C-MAPSS train/test split; validation is obtained within the training portion via stratified fivefold, engine-level cross-validation (see Section “Train/validation protocol and cross-validation”).
-
• Classification model: A classification model is created and trained using the Classifier class.
-
• X_cls: Represents the dataset containing features to be used for classification.
-
• y_cls: Contains the classification labels. In this study, the “failure within w1” label indicates whether there is a failure within the equipment.
-
• X_cls_train, X_cls_test, y_cls_train, y_cls_test: Represent the partitioning of data into training and testing subsets for the classification model.
Train/validation protocol and cross-validation
Official train/test split
This study adheres to the official C-MAPSS train/test split; no engine from the official test sets appears in training (Xu and Goodacre, Reference Xu and Goodacre2018).
Validation for model selection
Within the official training portion, stratified fivefold cross-validation is employed on the binary label (failure within 30 cycles) (Vabalas, Reference Vabalas, Gowen, Poliakoff and Casson2019). To avoid temporal leakage, folds are defined at the engine-unit level, ensuring that all cycles belonging to a given engine remain in the same fold.
Preprocessing in Cross-Validation (CV)
Scaling and, when applicable, SMOTE are fitted only on the training fold of each CV iteration and applied to its corresponding validation fold via pipelines; the official test split is never touched during tuning.
Hyperparameter tuning
GridSearchCV and BayesSearchCV operate inside the CV loop on the training portion only (see Section “Hyperparameter tuning”).
Reproducibility
Random seeds are fixed for splitters and learners to ensure reproducible results.
Hyperparameter tuning
Hyperparameter tuning is a process for enhancing the performance of an ML model. This involves adjusting the hyperparameters of a model through trial and error to achieve optimal results. Numerous ML models come with adjustable parameters that influence their performance. For instance, in SVM, hyperparameters include $ C $
and
$ C $
and $ \gamma $
. There are also hyperparameters such as maximum depth in DTs and the number of trees in gradient boosting models. The
$ \gamma $
. There are also hyperparameters such as maximum depth in DTs and the number of trees in gradient boosting models. The $ C $
parameter in Eq. (1), a key hyperparameter in SVM, functioning as a regularization parameter, representing the penalty for each misclassified data point. This parameter represents the penalty applied to each misclassified data point (Miller et al., Reference Miller, Seegmiller, Masoum, Shekaramiz and Seibi2023). The
$ C $
parameter in Eq. (1), a key hyperparameter in SVM, functioning as a regularization parameter, representing the penalty for each misclassified data point. This parameter represents the penalty applied to each misclassified data point (Miller et al., Reference Miller, Seegmiller, Masoum, Shekaramiz and Seibi2023). The $ \gamma $
parameter in Eq. (2) indicates the importance given to the curvature of the decision boundary (Miller et al., Reference Miller, Seegmiller, Masoum, Shekaramiz and Seibi2023). This section will discuss approaches to hyperparameter tuning.
$ \gamma $
parameter in Eq. (2) indicates the importance given to the curvature of the decision boundary (Miller et al., Reference Miller, Seegmiller, Masoum, Shekaramiz and Seibi2023). This section will discuss approaches to hyperparameter tuning.
 $$ \mathrm{Effect}\propto \frac{1}{C} $$
 $$ \mathrm{Effect}\propto \frac{1}{\gamma } $$
Grid search cross-validation method
This method is used to determine the optimal hyperparameter combination for a given model. In this process, specific hyperparameters are adjusted to enhance the performance of the models. These parameters are essential for improving model accuracy, enhancing generalization, and minimizing overfitting (Ranjan et al., Reference Ranjan, Verma and Radhika2019).
For example, regularization parameters ( $ C $
) enhance the generalization ability of the model by preventing overfitting, while penalty terms and optimization algorithms (solver) balance the simplicity and accuracy of the model. In DT and RF models, parameters like depth (max_depth), minimum samples required for a split (min_samples_split, min_samples_leaf), and the number of trees (n_estimators) help maintain the model’s balance and generalizability. For SVM, parameters like kernel and gamma optimize the model’s ability to capture complex relationships. Careful selection and tuning of these parameters ensure that the models perform optimally on specific datasets.
$ C $
) enhance the generalization ability of the model by preventing overfitting, while penalty terms and optimization algorithms (solver) balance the simplicity and accuracy of the model. In DT and RF models, parameters like depth (max_depth), minimum samples required for a split (min_samples_split, min_samples_leaf), and the number of trees (n_estimators) help maintain the model’s balance and generalizability. For SVM, parameters like kernel and gamma optimize the model’s ability to capture complex relationships. Careful selection and tuning of these parameters ensure that the models perform optimally on specific datasets.
Bayesian optimization
Bayesian optimization is particularly useful because it focuses on Bayes’ theorem and a probabilistic model that is updated iteratively over time. This method is more efficient compared to more exhaustive tuning methods like Grid Search (Bergstra et al., Reference Bergstra, Yamins and Cox2013).
A hyperparameter range is determined, and models are created with different combinations of these parameters. Each model is then tested using cross-validation, and performance metrics are recorded for each hyperparameter combination.
Comparison of GridSearchCV and BayesSearchCV for hyperparameter optimization
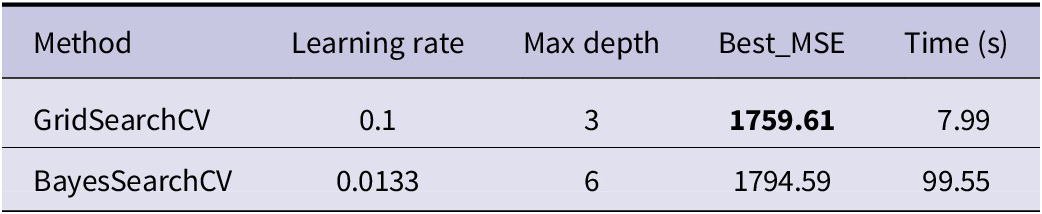
To improve model performance, two hyperparameter tuning techniques were employed and compared: GridSearchCV and BayesSearchCV. The objective was to identify the combination of parameters yielding the lowest Mean Squared Error (MSE) while also evaluating the computational efficiency of each method.
GridSearchCV was configured with a 3 $ \times $
3
$ \times $
3 $ \times $
3 search grid and completed the optimization in 7.99 s, achieving a minimum MSE of 1759.61. In contrast, BayesSearchCV took 99.55 s to complete the same number of iterations and resulted in a slightly higher MSE of 1794.59. These results suggest that, within a constrained search space, exhaustive grid search may outperform Bayesian optimization in both accuracy and speed. A summary of these findings is provided in Table 6.
$ \times $
3 search grid and completed the optimization in 7.99 s, achieving a minimum MSE of 1759.61. In contrast, BayesSearchCV took 99.55 s to complete the same number of iterations and resulted in a slightly higher MSE of 1794.59. These results suggest that, within a constrained search space, exhaustive grid search may outperform Bayesian optimization in both accuracy and speed. A summary of these findings is provided in Table 6.
Comparison of Grid Search and Bayesian optimization results in terms of accuracy and computational time

Parameters used in the models
Table 7 summarizes the ML and DL models employed in this study, along with their hyperparameters, which were determined using GridSearchCV.
Optimized hyperparameters of machine learning and deep learning models determined via GridSearchCV

Model explainability analysis
To improve the reliability of predictive models in safety-critical aircraft maintenance applications, this study conducted a comprehensive SHAP analysis. By quantifying each feature’s contribution to the output, SHAP provides global interpretability – clarifying not only what the model predicts but also why. This level of transparency is essential in safety-focused domains (Alomari et al., Reference Alomari, Andó and Baptista2023; Alomari, Reference Alomari2024).
For global explainability, this study examined side-by-side SHAP summary plots for all candidate models (Figure 3). This enables a comparative view across different learner families (linear, tree-based, gradient-boosted, and deep/sequential) of both the magnitude and direction of feature contributions.
SHAP summary plots for (a) Logistic Regression, (b) Decision Tree, (c) Random Forest, (d) SVM, (e) KNN, (f) Naïve Bayes, (g) XGBoost, (h) LightGBM, (i) CatBoost, (j) Gradient Boosting, (k) MLP, (l) GRU, and (m) LSTM.

How to read Figure 3
In SHAP summary plots, the vertical axis lists features ordered by mean absolute SHAP value (global importance), while the horizontal axis shows the magnitude and sign of each feature’s instant contribution (pushing the prediction up or down). Point density and spread indicate potential nonlinear effects and interactions; the color map typically reflects the normalized level of the feature value. This study used these plots to test whether model behavior aligns with domain knowledge and to detect any over-reliance on specific sensitivities. Because all models were trained on a common feature set known to be informative for C-MAPSS (e.g., s11, s12, s2, and cycle), the SHAP results also provide a validation layer for those choices.
Methodological takeaways
(i) Cross-model consistency: Similar importance patterns across different families trained on the same data support robustness and generalizability. (ii) Alignment with engineering intuition: SHAP visualizes how sensors and operating settings influence the risk score, enabling sanity checks against domain expectations. (iii) Model governance: In safety-critical contexts, SHAP makes decision traces auditable for regulatory review and field engineering; it also informs thresholding and alert strategies by answering “which feature matters, when, and how?”
In summary, the SHAP-based global explainability analysis in Figure 3 exposes the decision logic of all compared models and yields clear, auditable, and domain-consistent insights that inform model selection, sensor strategy, and maintenance policy.
Statistical comparison protocol
This study assessed whether observed performance differences among models were statistically meaningful using a nonparametric, repeated-measures framework applied separately per metric (Raschka, Reference Raschka2018). For each evaluation metric (e.g., accuracy, F1-score, and ROC–AUC), model scores were computed on the same folds/datasets to preserve pairing. Let $ k $
denote the number of models and
$ k $
denote the number of models and $ n $
the number of paired observations (folds or datasets). A global test was first performed with the Friedman test across the
$ n $
the number of paired observations (folds or datasets). A global test was first performed with the Friedman test across the $ k $
models, treating the
$ k $
models, treating the $ n $
units as blocks. The null hypothesis stated that the distributions of model performance are equal across models for the given metric.
$ n $
units as blocks. The null hypothesis stated that the distributions of model performance are equal across models for the given metric.
The Friedman statistic and associated p-value were obtained for each metric at a two-sided significance level of $ \alpha =0.05 $
. Ties, when present, were handled by the standard tie correction in the Friedman procedure. If the global test for a metric did not reach significance, that metric was not subjected to confirmatory post-hoc inference (pairwise results, if shown, were treated as descriptive only). The summary of global tests appears in Table 8. For the classification metrics, the omnibus test was conducted over six baseline models – LR, SVM, KNN, MLP, DT, and NB – yielding
$ \alpha =0.05 $
. Ties, when present, were handled by the standard tie correction in the Friedman procedure. If the global test for a metric did not reach significance, that metric was not subjected to confirmatory post-hoc inference (pairwise results, if shown, were treated as descriptive only). The summary of global tests appears in Table 8. For the classification metrics, the omnibus test was conducted over six baseline models – LR, SVM, KNN, MLP, DT, and NB – yielding $ k=6 $
. XGBoost was not included in this inferential set to preserve a strictly paired design across folds. All inferential tests were conducted on paired scores obtained from the same data splits, with
$ k=6 $
. XGBoost was not included in this inferential set to preserve a strictly paired design across folds. All inferential tests were conducted on paired scores obtained from the same data splits, with $ n=4 $
paired units (folds/datasets) per metric; the Friedman test, therefore, used
$ n=4 $
paired units (folds/datasets) per metric; the Friedman test, therefore, used $ n=4 $
blocks and k = 6 treatments (df = 5).
$ n=4 $
blocks and k = 6 treatments (df = 5).
Friedman omnibus tests across $ k=6 $
models (
$ k=6 $
models ( $ n=4 $
blocks = folds/datasets; two-sided
$ n=4 $
blocks = folds/datasets; two-sided $ \alpha =0.05 $
). Post-hoc pairwise comparisons (Wilcoxon signed-rank with Holm adjustment) were conducted only when the omnibus test was significant
$ \alpha =0.05 $
). Post-hoc pairwise comparisons (Wilcoxon signed-rank with Holm adjustment) were conducted only when the omnibus test was significant

Note: $ {\chi}_F^2 $
: Friedman test statistic (df=
$ {\chi}_F^2 $
: Friedman test statistic (df= $ k-1=5 $
). Sig. codes: ***
$ k-1=5 $
). Sig. codes: *** $ p<0.001 $
, **
$ p<0.001 $
, ** $ p<0.01 $
, *
$ p<0.01 $
, * $ p<0.05 $
, n.s.
$ p<0.05 $
, n.s. $ p\ge 0.05 $
. Post-hoc Wilcoxon tests with Holm step-down adjustment were applied within each metric family only when the Friedman test was significant.
$ p\ge 0.05 $
. Post-hoc Wilcoxon tests with Holm step-down adjustment were applied within each metric family only when the Friedman test was significant.
For metrics with a significant Friedman outcome, post-hoc pairwise comparisons were performed using the Wilcoxon signed-rank test on the paired scores for each model pair. Family-wise error within each metric’s set of pairwise tests was controlled via the Holm step-down adjustment applied to two-sided $ p $
-values. For each pair, the analysis reports the adjusted
$ p $
-values. For each pair, the analysis reports the adjusted $ p $
-value, the effect size
$ p $
-value, the effect size $ r $
(computed as
$ r $
(computed as $ r=\mid Z\mid /\sqrt{N} $
, where
$ r=\mid Z\mid /\sqrt{N} $
, where $ Z $
is the standardized Wilcoxon statistic), an interpretation of effect magnitude (small/medium/large), and the mean performance difference defined as
$ Z $
is the standardized Wilcoxon statistic), an interpretation of effect magnitude (small/medium/large), and the mean performance difference defined as $ \Delta =\mathrm{Model}\;\mathrm{A}-\mathrm{Model}\;\mathrm{B} $
in the original metric units. Key significant pairs are summarized in Table 9, and the full set of adjusted pairwise results is available in this repository (Özcan, Reference Özcan2025).
$ \Delta =\mathrm{Model}\;\mathrm{A}-\mathrm{Model}\;\mathrm{B} $
in the original metric units. Key significant pairs are summarized in Table 9, and the full set of adjusted pairwise results is available in this repository (Özcan, Reference Özcan2025).
Key significant pairwise differences (top 5 per metric by $ \mid \Delta \mid $
).
$ \mid \Delta \mid $
). $ \Delta $
denotes mean difference (Model A
$ \Delta $
denotes mean difference (Model A $ - $
Model B)
$ - $
Model B)

Note: $ \Delta $
= Mean difference in original metric units (Model A
$ \Delta $
= Mean difference in original metric units (Model A $ - $
Model B).
$ - $
Model B).
Sig.: Significance markers based on Holm-adjusted two-sided $ p $
-values from Wilcoxon signed-rank tests within each metric:
$ p $
-values from Wilcoxon signed-rank tests within each metric: $ {}^{\ast } $ $ {p}_{adj}<0.05 $
,
$ {p}_{adj}<0.05 $
, $ {}^{\ast \ast } $ $ {p}_{adj}<0.01 $
,
$ {p}_{adj}<0.01 $
, $ {}^{\ast \ast \ast } $ $ {p}_{adj}<0.001 $
; otherwise ns (not significant).
$ {p}_{adj}<0.001 $
; otherwise ns (not significant). $ r $
: Effect size (Wilcoxon; interpreted as small/medium/large using conventional thresholds).
$ r $
: Effect size (Wilcoxon; interpreted as small/medium/large using conventional thresholds).
Multiple-comparison control is applied within each metric; tests are paired on the same folds/datasets.
All significance tests were two-sided. Multiple-testing correction was scoped within each metric (i.e., adjustments were not pooled across different metrics). The same preprocessing, data splits, and random seeds used in the main evaluation were retained for the statistical tests to maintain a consistent paired design; incomplete pairs, if any, were excluded by complete-case analysis.
Handling class imbalance
This analysis addresses the rarity of the positive class (“failure within $ {w}_1=30 $
”) by evaluating class-imbalance handling consistently across all ML models and one DL model (MLP). Within each cross-validation iteration, preprocessing and – where applicable – SMOTE were fitted only on the training folds via pipelines, and the official test split remained untouched to prevent leakage (Chawla et al., Reference Chawla, Bowyer, Hall and Kegelmeyer2002). Final metrics were computed on the fixed test set to enable fair, paired comparisons between No–SMOTE and SMOTE conditions. The per-model ML results are summarized in Table 10; the MLP was evaluated under the same protocol.
$ {w}_1=30 $
”) by evaluating class-imbalance handling consistently across all ML models and one DL model (MLP). Within each cross-validation iteration, preprocessing and – where applicable – SMOTE were fitted only on the training folds via pipelines, and the official test split remained untouched to prevent leakage (Chawla et al., Reference Chawla, Bowyer, Hall and Kegelmeyer2002). Final metrics were computed on the fixed test set to enable fair, paired comparisons between No–SMOTE and SMOTE conditions. The per-model ML results are summarized in Table 10; the MLP was evaluated under the same protocol.
Handling class imbalance: SMOTE versus No-SMOTE on C-MAPSS (failure window $ {w}_1=30 $
). Metrics are computed on the fixed test set; SMOTE is applied only on training folds
$ {w}_1=30 $
). Metrics are computed on the fixed test set; SMOTE is applied only on training folds

Aggregate observations
Across strong ML baselines (e.g., XGBoost and LR), SMOTE yielded negligible or mixed changes in accuracy, F1-score, and ROC–AUC on the untouched test set, indicating relative robustness to the observed imbalance under the adopted feature space. For margin-based SVM, SMOTE increased ROC–AUC while reducing accuracy and F1-score, reflecting a precision–recall trade-off at the fixed operating point. For tree-ensemble families, effects were model-dependent: RF exhibited higher recall with lower precision, resulting in an F1-score comparable to the no-resampling baseline, whereas Gradient Boosting, LightGBM, and CatBoost showed small, directionally varied shifts with AUC largely stable. KNN and DT displayed limited gains (e.g., modest AUC improvements) without consistent improvements in F1-score. The MLP showed minimal changes across metrics between SMOTE and No–SMOTE.
Implications
The findings suggest that the utility of oversampling is model-specific. In settings prioritizing early-failure detection, recall improvements with certain ensembles may be desirable, while applications sensitive to false alarms may favor operating-point adjustments or alternative imbalance strategies. Importantly, Table 10 documents that imbalance handling was implemented under a single, leakage-aware protocol for all evaluated models, thereby preserving cross-model comparability as required by the review.
Comparison of models
The evaluation of an algorithm as “good” is directly related to its ability to meet performance criteria that are critical in the application context. This study employs standard evaluation metrics commonly adopted in the literature – accuracy, precision, recall, F1-score, and ROC–AUC – to assess algorithm performance (Capodieci et al., Reference Capodieci, Caricato, Carlucci, Ficarella, Mainetti and Vergallo2020; Singh et al., Reference Singh, Kumar, Arya and Kumar2020). In PdM applications, it has been widely recognized that relying solely on accuracy is not sufficient. Precision is particularly important for cost management, while recall plays a critical role in ensuring safety (Capodieci et al., Reference Capodieci, Caricato, Carlucci, Ficarella, Mainetti and Vergallo2020). The F1-score, as a harmonic mean of precision and recall, serves as a balanced metric to evaluate model robustness and overall effectiveness (Singh et al., Reference Singh, Kumar, Arya and Kumar2020). Therefore, in this study, models are considered to perform well only if they demonstrate consistently high and balanced values across these metrics. The primary metrics used to evaluate the models listed in Table 5 are as follows:
-
• Accuracy: The proportion of Correctly Classified Samples to the total number of instances. The formula for calculating accuracy is provided in Eq. (3).
 $$ \mathrm{Accuracy}=\frac{\mathrm{Correctly}\ \mathrm{Classified}\ \mathrm{Samples}}{\mathrm{Total}\ \mathrm{Number}\ \mathrm{of}\ \mathrm{Samples}} $$
-
• Precision: The ratio of correctly classified examples of a specific class to the total examples assigned to that class. The calculation of the precision value is shown in Eq. (4).
 $$ \mathrm{Precision}=\frac{\mathrm{True}\ \mathrm{Positives}}{\mathrm{False}\ \mathrm{Positives}+\mathrm{True}\ \mathrm{Positives}} $$
-
• Recall: The proportion of true positive instances to the total number of actual instances in a specific class. The formula for calculating recall is provided in Eq. (5).
 $$ \mathrm{Recall}=\frac{\mathrm{True}\ \mathrm{Positives}}{\mathrm{False}\ \mathrm{Negatives}+\mathrm{True}\ \mathrm{Positives}} $$
-
• F1-score: Defined as the harmonic mean of precision and recall, it serves as a balanced metric for performance evaluation. The formula for calculating the F1-score is provided in Eq. (6).
 $$ \mathrm{F}1\hbox{-} \mathrm{score}=2\times \frac{\mathrm{Precision}\times \mathrm{Recall}}{\mathrm{Precision}+\mathrm{Recall}} $$
-
• ROC–AUC: Measures threshold-independent discriminative ability. The ROC curve plots the True Positive Rate against the False Positive Rate across all thresholds; see Eqs. (7) and (8). The AUC summarizes performance as a single scalar (0.5
$ \approx $
random, 1.0
$ \approx $
perfect), computed as in Eq. (9); an equivalent probabilistic view is given in Eq. (10).


 $$ \mathrm{TPR}=\frac{\mathrm{TP}}{\mathrm{TP}+\mathrm{FN}} $$
 $$ \mathrm{FPR}=\frac{\mathrm{FP}}{\mathrm{FP}+\mathrm{TN}} $$
 $$ \mathrm{AUC}={\int}_0^1\;\mathrm{TPR}(u)\hskip0.1em \mathrm{d}u\mathrm{with}\;u=\mathrm{FPR} $$
 $$ \mathrm{AUC}=\mathrm{\mathbb{P}}\left(\hat{s}\left({x}^{+}\right)>\hat{s}\left({x}^{-}\right)\right) $$
The comparative Accuracy, Precision, Recall, F1-scores, and ROC–AUC of the applied models are presented in detail in Table 11.
Per-class metrics and overall summaries on the untouched test set. Class 0: normal; Class 1: failure $ \le 30 $
cycles. Weighted-F1, balanced accuracy, and ROC–AUC are left blank until supports/scores are computed
$ \le 30 $
cycles. Weighted-F1, balanced accuracy, and ROC–AUC are left blank until supports/scores are computed

Note: Accuracy is global over the test set. Macro-F1 is the unweighted mean of per-class F1-scores (left blank if a class row is missing). Weighted-F1 requires per-class supports; Balanced accuracy is the mean of per-class recalls; ROC–AUC uses Class 1 as the positive class.
Findings
This section reports the comparative results of the evaluated ML and DL classifiers under a unified, leakage-aware protocol (official C-MAPSS train/test split; stratified engine-level cross-validation during tuning). Aggregate results are summarized by accuracy, Macro-F1, balanced accuracy, and ROC–AUC; per-class behavior is discussed for Normal and Failure $ \le $
30 cycles (Table 11). A visual example of actual versus predicted RUL trajectories accompanies the quantitative analysis to aid interpretability (Figure 4), and finally benchmark the results against prior studies (Table 12).
$ \le $
30 cycles (Table 11). A visual example of actual versus predicted RUL trajectories accompanies the quantitative analysis to aid interpretability (Figure 4), and finally benchmark the results against prior studies (Table 12).
Models actual and predicted RUL predictions versus ground truth for the models: (a) Logistic Regression, (b) Decision Tree, (c) Random Forest, (d) SVM, (e) KNN, (f) Naïve Bayes, (g) XGBoost, (h) LightGBM, (i) CatBoost, (j) Gradient Boosting, (k) MLP, (l) GRU, and (m) LSTM.

Comparison of accuracy results of ML/DL models from this study (Soni et al., Reference Soni, Khan, Zubair and Garg2021; Al Hasib et al., Reference Al Hasib, Rahman, Khabir and Shawon2023; Sharma et al., Reference Sharma, Kodipalli, Rao, BR, Sripradha and Nikita2023; Melkumian, Reference Melkumian2024)

Overall and per-model performance
Table 11 provides per-class precision/recall/F1 together with global summaries on the untouched test set. Among classical ML models, gradient-boosted tree families were consistently competitive: LightGBM (Accuracy $ =0.972 $
, Macro-F1
$ =0.972 $
, Macro-F1 $ =0.86 $
, ROC–AUC
$ =0.86 $
, ROC–AUC $ =0.93 $
), CatBoost (Accuracy
$ =0.93 $
), CatBoost (Accuracy $ =0.971 $
, Macro-F1
$ =0.971 $
, Macro-F1 $ =0.85 $
, ROC–AUC
$ =0.85 $
, ROC–AUC $ =0.92 $
), Gradient Boosting (Accuracy
$ =0.92 $
), Gradient Boosting (Accuracy $ =0.969 $
, Macro-F1
$ =0.969 $
, Macro-F1 $ =0.84 $
, ROC–AUC
$ =0.84 $
, ROC–AUC $ =0.92 $
), and RF (Accuracy
$ =0.92 $
), and RF (Accuracy $ =0.968 $
, Macro-F1
$ =0.968 $
, Macro-F1 $ =0.83 $
, ROC–AUC
$ =0.83 $
, ROC–AUC $ =0.91 $
). Linear/instance-based baselines (LR, SVM, and KNN) yielded solid but comparatively lower Macro-F1 values (0.76–0.80 range).
$ =0.91 $
). Linear/instance-based baselines (LR, SVM, and KNN) yielded solid but comparatively lower Macro-F1 values (0.76–0.80 range).
Sequence models achieved the strongest overall performance: GRU attained Accuracy $ =0.975 $
, Macro-F1
$ =0.975 $
, Macro-F1 $ =0.94 $
, ROC–AUC
$ =0.94 $
, ROC–AUC $ =0.97 $
; LSTM delivered the top accuracy at
$ =0.97 $
; LSTM delivered the top accuracy at $ 0.981 $
with Macro-F1
$ 0.981 $
with Macro-F1 $ =0.92 $
and ROC–AUC
$ =0.92 $
and ROC–AUC $ =0.96 $
. These results indicate that architectures explicitly modeling temporal dependencies better capture short-horizon failure dynamics in C-MAPSS.
$ =0.96 $
. These results indicate that architectures explicitly modeling temporal dependencies better capture short-horizon failure dynamics in C-MAPSS.
Per-class behavior and safety–cost trade-offs
Failure-class (Class 1) sensitivity is essential for safety-critical PdM. The best recalls for Failure $ \le 30 $
were observed with GRU (Recall
$ \le 30 $
were observed with GRU (Recall $ =0.96 $
, Precision
$ =0.96 $
, Precision $ =0.90 $
) and LSTM (Recall
$ =0.90 $
) and LSTM (Recall $ =0.94 $
, Precision
$ =0.94 $
, Precision $ =0.88 $
), followed among ML models by LightGBM and CatBoost (Recall
$ =0.88 $
), followed among ML models by LightGBM and CatBoost (Recall $ =0.89 $
for Class 1 in both, with Class 0/1 precision–recall balanced around 0.83–0.87). RF emphasized recall for the minority class (Class 1 Recall
$ =0.89 $
for Class 1 in both, with Class 0/1 precision–recall balanced around 0.83–0.87). RF emphasized recall for the minority class (Class 1 Recall $ =0.86 $
) at a modest precision cost (Class 1 Precision
$ =0.86 $
) at a modest precision cost (Class 1 Precision $ =0.79 $
), which may be desirable when missed detections are costlier than false alarms.
$ =0.79 $
), which may be desirable when missed detections are costlier than false alarms.
Robustness to class imbalance
To quantify sensitivity to class imbalance, this study compared No–SMOTE versus SMOTE conditions within cross-validation pipelines and reported metrics on the fixed test set (Table 11). Oversampling effects were model-specific: for margin-based SVM, SMOTE increased ROC–AUC while slightly reducing Accuracy/F1; for RF, SMOTE shifted the precision–recall balance toward higher recall with comparable F1; boosted trees showed small, directionally mixed changes with largely stable AUC. Overall, top-ranked models remained robust under the adopted feature space and labeling scheme.
Statistical comparison
A nonparametric repeated-measures analysis was conducted per metric across baselines. Friedman omnibus tests were significant for Accuracy, F1-score, and ROC–AUC ( $ p<0.01 $
), supporting non-equal performance distributions across models. Post-hoc Wilcoxon signed-rank tests with Holm adjustment revealed multiple large-effect differences (e.g., linear models outperforming DTs; DTs underperforming vs. kernel/linear baselines in ROC–AUC), corroborating the ranking trends observed in Table 11. These findings strengthen the claim that temporal DL models and modern boosted ensembles provide statistically meaningful gains over weaker baselines under this study protocol.
$ p<0.01 $
), supporting non-equal performance distributions across models. Post-hoc Wilcoxon signed-rank tests with Holm adjustment revealed multiple large-effect differences (e.g., linear models outperforming DTs; DTs underperforming vs. kernel/linear baselines in ROC–AUC), corroborating the ranking trends observed in Table 11. These findings strengthen the claim that temporal DL models and modern boosted ensembles provide statistically meaningful gains over weaker baselines under this study protocol.
Visualization of prediction behavior
Figure 4 presents example trajectories of actual versus predicted RUL across representative models, illustrating error structure and temporal bias patterns. While the classification target focuses on a 30-cycle failure horizon, these RUL plots are informative for understanding how regression-style signals relate to the classifier’s operating point and for diagnosing under/over-prediction regimes that may impact threshold selection in deployment.
Cross-study benchmarking
To contextualize these findings, Table 12 compares accuracy figures with prior studies (Soni et al., Reference Soni, Khan, Zubair and Garg2021; Al Hasib et al., Reference Al Hasib, Rahman, Khabir and Shawon2023; Sharma et al., Reference Sharma, Kodipalli, Rao, BR, Sripradha and Nikita2023; Melkumian, Reference Melkumian2024). Consistent with the literature, boosted ensembles (RF and Gradient Boosting) and sequence models (GRU and LSTM) reside near the accuracy frontier. Notably, this study’s LSTM (0.981) and GRU (0.975) accuracies are on par with or exceed results reported for comparable settings, while LightGBM and CatBoost compare favorably where published baselines exist. Differences across studies are plausibly attributable to horizon labeling choices, feature engineering, and hyperparameter search scopes.
Study limitations and directions for future research
Reliance on simulated data and external validity
This study evaluates model performance exclusively on the NASA C-MAPSS turbofan simulation, which – while physics-based and widely used – remains a proxy for operational engines. As such, the reported metrics may overestimate real-world effectiveness due to domain shift between simulated and field telemetry (e.g., sensor noise characteristics, calibration drift, flight-phase distributions, maintenance actions, and fleet/engine heterogeneity). Labeling in C-MAPSS (run-to-failure trajectories with a well-defined horizon) is also more pristine than operational labels derived from work orders or deferred defect logs, which can introduce timestamp uncertainty and class noise. Consequently, generalizability to airline ACMS/FDR data and to different engine families should be interpreted with caution.
Mitigations and future validation path
To strengthen external validity, future work should (i) perform external validation on independent real-engine datasets across multiple fleets and operating environments; (ii) explicitly quantify domain shift and apply domain-adaptation techniques (e.g., feature alignment or adversarial adaptation) and/or physics-informed augmentation to bridge sensor/operating-regime differences; (iii) evaluate robustness under realistic noise, missingness, and sensor dropout; (iv) calibrate decision thresholds using cost-sensitive criteria that reflect airline safety and false-alarm costs; and (v) report uncertainty (e.g., confidence/credibility intervals and calibration curves) alongside point estimates. Mapping C-MAPSS variables to airline telemetry, harmonizing failure-within-horizon labels with actual shop-visit or removal events, and conducting prospective pilots with maintenance stakeholders would provide a clearer assessment of deployability.
Discussion and conclusion
This study systematically compared the strengths and weaknesses of diverse ML/DL approaches for aircraft-engine PdM on the C-MAPSS dataset, framed as a binary classification task – “failure within the next 30 cycles.” Sequence-based deep architectures that explicitly model temporal dependencies (GRU/LSTM) achieved the highest overall accuracy and sensitivity for the positive class (≤30 cycles to failure); LSTM delivered the top performance, with GRU closely behind. Gradient-boosted tree families (LightGBM, CatBoost, and Gradient Boosting) and RF trailed only narrowly, especially on the safety-critical Class-1 recall. Taken together, these findings indicate that capturing temporal structure is decisive for short-horizon risk prediction, while well-tuned boosted trees remain a competitive and operationally attractive alternative.
On model explainability, SHAP analyses showed that feature importances were consistent in both magnitude and direction across candidate models and aligned with engineering intuition. This transparency provides actionable input for sensor strategy, threshold design, and alerting, and helps satisfy auditability requirements in safety-critical settings by furnishing a traceable decision rationale for model selection and maintenance-policy calibration.
Regarding class imbalance (the rarity of the positive class), SMOTE offered model-dependent benefits: for margin-based SVMs, AUC tended to increase even when accuracy/F1 saw limited trade-offs; for RF, recall often improved as precision decreased; with strong tree baselines and MLPs, metrics were generally stable. Practically, organizations that prioritize missed-failure avoidance can justifiably favor recall-oriented tuning (and/or cost-sensitive thresholds), whereas those facing high false-alarm costs may prefer precision-oriented operating points.
A rigorous statistical comparison framework (Friedman omnibus tests followed by Holm-corrected pairwise Wilcoxon tests on significant metrics) confirmed that the observed performance differences across models are statistically meaningful. In particular, linear/kernel methods and boosted trees outperform weaker baselines, while sequence models emerge as overall leaders. This supports that the reported rankings are not attributable to random variation.
Cross-study triangulation with the literature shows a convergent pattern: sequence-based DL and boosted trees approach the “accuracy frontier” for this problem class. Performance gaps across studies remain sensitive to choices in forecasting-horizon labeling, feature engineering, and hyperparameter search breadth – differences that should be considered when interpreting absolute scores.
Threats to validity and external generalizability
All findings were obtained on NASA’s simulated C-MAPSS data. While physically grounded and widely adopted, these simulations can differ from operational telemetry (e.g., sensor noise, calibration drift, flight-phase distributions, and fleet/engine heterogeneity). Absolute metrics may therefore be optimistic in real-world fleets. Future work should address this with external validation on independent fleet data, domain adaptation techniques, robustness to noise and missingness, cost-sensitive thresholding, and principled uncertainty reporting.
Practical implications
(i) On routes where safety dominates cost (e.g., ETOPS-critical operations), deploy GRU/LSTM or recall-optimized RF/LightGBM, and set alert thresholds to minimize false negatives. (ii) Where false-alarm cost is high (e.g., expensive unscheduled removals), prefer LightGBM/CatBoost for balanced precision–recall and emphasize probability calibration and monitoring. (iii) Use explainability outputs to guide sensor-investment priorities and data-quality controls by elevating information-rich channels.
Conclusion
By reframing PdM as a near-term failure-risk classification problem ( $ \le $
30 cycles) and comparing 10 classical ML and 3 DL models under a leakage-averse protocol, this work shows that sequence models lead overall, while boosted trees offer a strong, interpretable alternative. Stability under class imbalance, together with consistent explainability findings, suggests that operational decision-making for aircraft-engine health can be grounded in scientifically defensible evidence. Nevertheless, fleet-scale external validation and integration with cost-sensitive calibration remain essential to simultaneously maximize safety and efficiency.
$ \le $
30 cycles) and comparing 10 classical ML and 3 DL models under a leakage-averse protocol, this work shows that sequence models lead overall, while boosted trees offer a strong, interpretable alternative. Stability under class imbalance, together with consistent explainability findings, suggests that operational decision-making for aircraft-engine health can be grounded in scientifically defensible evidence. Nevertheless, fleet-scale external validation and integration with cost-sensitive calibration remain essential to simultaneously maximize safety and efficiency.
Data availability and code statement
The data supporting the findings of this study are openly available in the NASA Ames Prognostics Data Repository at https://www.nasa.gov/content/prognostics-center-of-excellence-data-set-repository. The code used for the analysis is openly available at https://github.com/hkmtcn/cmapss-binary-failure-classification.
Author contribution
Hikmetcan Özcan was responsible for the conceptualization, methodology design, data analysis, model implementation, result interpretation, and manuscript writing.
Competing interests
The author declares none.
Hikmetcan Özcan received his BSc, MS, and PhD degrees from the Computer Engineering Department at Kocaeli University, Kocaeli, Türkiye. He is currently an Assistant Professor in the Computer Engineering Department at Kocaeli University. His current research interests include image machine learning, artificial intelligence, cryptography, computer software and software engineering, database management, and human–computer interaction.





 Open access

