


Introduction
The intestinal epithelial barrier comprises a monolayer of intestinal epithelial cells and tight junctions between cells. The intestinal epithelial barrier damage increases intestinal permeability, allowing pathogens or other harmful substances to enter the circulatory system (Goto and Kiyono Reference Goto and Kiyono2012). Simultaneously, damage to the function of the intestinal epithelial barrier is closely related to the development of various diseases, such as exacerbation of intestinal inflammation, non-alcoholic fatty liver, and chronic kidney disease (Albillos et al. Reference Albillos, de Gottardi and Rescigno2020; Chen et al. Reference Chen, Chen and Chen2019; Ma et al. Reference Ma, Iwamoto and Hoa2004). Many adverse factors can cause intestinal barrier damage, including enterotoxigenic Escherichia coli (ETEC) and its lipopolysaccharides (LPS). ETEC infection can cause diarrhea in infants or children, increasing morbidity and mortality rates (Khalil et al. Reference Khalil, Troeger and Blacker2018). In piglet production, ETEC infection leads to piglet diarrhea, increasing piglet mortality and thus causing significant economic losses (Sun and Kim Reference Sun and Kim2017; Zhang et al. Reference Zhang, Zhao and Ruesch2007). In addition, bacterial LPS stimulation can also induce inflammation of intestinal epithelial cells and disrupt the integrity of the intestinal barrier function (Bein et al. Reference Bein, Zilbershtein and Golosovsky2017; Brandtzaeg Reference Brandtzaeg2011; Peterson and Artis Reference Peterson and Artis2014). Therefore, from a dietary or feed supplementation perspective, safeguarding the integrity of intestinal barrier function and alleviating the impact of harmful substances on intestinal damage is paramount.
Short-chain fatty acids, including butyric acid, are produced by intestinal microbes fermenting indigestible carbohydrates, fibers, and proteins (Topping and Clifton Reference Topping and Clifton2001). Butyric acid is well known as an energy substance for intestinal epithelial cells (Ducatelle et al. Reference Ducatelle, Eeckhaut and Guilloteau2010; Zhang et al. Reference Zhang, Liu and Jiang2021). In addition, butyric acid also has the function of protecting the intestinal barrier and inhibiting intestinal inflammation (Galvez et al. Reference Galvez, Rodríguez-Cabezas and Zarzuelo2005).
Monobutyrin (MB), a modified form of butyric acid, overcomes the disadvantages of volatile, unpleasant smells and poor palatability. Both in vivo and in vitro experiments have found that MB can protect the intestinal barrier function and inhibit the inflammatory response (Kovanda et al. Reference Kovanda, Hejna and Liu2020b; Wang et al. Reference Wang, Chen and Lin2022). However, the specific mechanism of its protective effects remains unclear.
Pigs serve as an excellent animal model for studying human diseases due to the organ size and physiology similarity between pigs and humans (Gerdts et al. Reference Gerdts, Wilson and Meurens2015; Lunney Reference Lunney2007; Meurens et al. Reference Meurens, Summerfield and Nauwynck2012; Pabst Reference Pabst2020). Porcine small intestinal epithelial cell line (IPEC-J2) cells are one ofthe few non-transformed cell lines isolated from animal small intestinal epithelial cells. These cells are highly consistent with primary small intestinal epithelial cells’ morphology and function (Schierack et al. Reference Schierack, Nordhoff and Pollmann2006). In contrast, most cell lines isolated from the human intestine (e.g., HT-29, T84, Caco-2) are mainly derived from the colon and are carcinogenic. IPEC-J2 is a stable research model in vitro experiments exploring the impact of bacteria on intestinal epithelial cells (Brosnahan and Brown Reference Brosnahan and Brown2012). Currently, there is limited research on the application of MB in the barrier function of IPEC-J2 cells. Therefore, this study aims to use IPEC-J2 cells as the research object to investigate the effect of MB on the barrier function of IPEC-J2 and its protective effect on cell barrier function damage caused by LPS stimulation. Cellular transcriptomics technology is used to elucidate the potential mechanism of MB action further. The study results will lay the foundation for MB as a dietary supplement or feed additive in the application research for young children or animals.
Materials and methods
Cell culture
The team led by Weihuan Fang generously donated the IPEC-J2 cells. The culture medium used for the cultivation of IPEC-J2 cells is DMEM/F12 (Biological Industries, Kibbutz Beit Haemek, Israel), which contains 10% fetal bovine serum (Yeasen Biotech Co. Ltd, Shanghai, China) and 1% double antibiotic (100 U/mL penicillin, 100 μg/mL streptomycin, Biological Industries). The IPEC-J2 cells were cultured in a sterile incubator at 37°C with 5% CO2 and a water tray for humidification. In all experiments, once the cells reach a confluence of 70–80%, they are passaged using 0.25% trypsin (Cienry Biotech Co. Ltd, Huzhou, Zhejiang province, China).
Cell viability assay
The assessment of cell viability is conducted using the cell counting kit-8 (CCK-8, Biosharp Life Sciences, Anhui, Hefei Province, China). Essentially, a cell suspension of 1 × 10⁵/mL is seeded in a 96-well plate with 100 μL per well and incubated overnight. After being washed twice with phosphate buffer saline (PBS), the cells are cultured with 200 μL of complete medium containing varying concentrations of MB (contain 90% MB, 4.5% tributyrin, 5% glycerol and butyric acid <0.5%, J&KChemical, Beijing, China) or LPS (O55:B5, Sigma-Aldrich, Saint Louis, Mo, USA) for 12 h or 8 h, respectively. Following treatment, the medium containing MB or LPS is discarded, the cells are washed twice with PBS, and a fresh, complete medium is added. Subsequently, 20 μL of CCK-8 working solution is added to each well and incubated for 1.5 h in the incubator. The absorbance at 450 nm is then measured using a microplate reader (SpectraMax, Molecular Device Co., Sunnyvale, CA, USA). The cell viability is calculated using the following formula.
 \begin{equation*}Cell\,Viability\left( \% \right) = \frac{{\left( {O{D_{treatment}} - O{D_{blank}}} \right)}}{{\left( {O{D_{control}} - O{D_{blank}}} \right)}} \times 100\end{equation*}
Cell treatment
Upon seeding the cells onto the appropriate culture plates and reaching the confluence required for the experiment, the corresponding treatments are initiated: a 12-h pretreatment with PBS, followed by an 8-h treatment with PBS, is designated as the PBS + PBS group; a 12-h pretreatment with MB, followed by an 8-h treatment with PBS, is designated as the MB + PBS group; a 12-h pretreatment with PBS, followed by an 8-h treatment with LPS, is designated as the PBS + LPS group; a 12-h pretreatment with MB, followed by an 8-h treatment with LPS, is designated as the MB + LPS group.
RNA extraction and real-time fluorescence quantitative PCR (qPCR)
Each well was seeded with 2–2.5 × 10⁵ IPEC-J2 cells in a 12-well plate. After the corresponding treatments with MB and LPS, the cells are washed twice with pre-cooling PBS. 500 μL of TRIzol Reagent (Invitrogen, Carlsbad, CA, USA) was added to each well. The cells were lysed on ice for 5 min. The subsequent steps of RNA extraction and qPCR procedure are performed as described in previous experiments (Wang et al. Reference Wang, Chen and Lin2022). β-actin was chosen as the internal control. The relative gene expression was calculated using the 2-ΔΔt method. Detailed information about the primers used in this study can be found in Table S1.
Scanning electron microscopy (SEM)
Following the appropriate treatments, the IPEC-J2 cells were washed with PBS, and the membrane of the transwell insert was carefully excised. The cell samples were then fixed in a 2.5% glutaraldehyde solution at 4°C for 24 h. Subsequently, all samples were immersed and rinsed in PBS for 15 min, three times. After rinsing, the samples were fixed in a 1% osmic acid solution for 1.5 h. Following fixation, the samples were immersed and rinsed in PBS three times, each for 15 min. The samples were then dehydrated through a series of graded ethanol solutions (30%, 50%, 70%, 80%, 90%, and 95%), each lasting 15 min, and a final dehydration step with anhydrous ethanol for 20 min. After dehydration, the sample is stored in a fresh anhydrous ethanol solution. The samples were dried in a Hitachi HCP-2 (Hitachi, Tokyo, Japan) critical point dryer. The processed samples were coated using a coater (GVC-2000, Ge Wei Instrument Co., Ltd., Beijing, China) and observed under a Hitachi SU-8010 (Hitachi, Tokyo, Japan) SEM.
Periodic acid-Schiff staining (PAS)
The IPEC-J2 cells (3–4 × 10⁵ cells) were seeded onto glass coverslips in 6-well plates (Corning Life Science, MA, USA) and incubated overnight. After pretreatment with MB, the cells were stimulated with LPS, as previously described. The cells were washed twice with PBS and fixed with 70% ethanol at room temperature for 10 min. After being rinsed twice with distilled water, the Periodic Acid-Schiff staining process was carried out per the instructions (Beyotime, Shanghai, China). The images were observed and captured using an optical microscope (Leica, Wetzlar, Germany).
Observation with laser scanning confocal microscope (LSCM)
The IPEC-J2 cells, at a density of 3–4 × 10⁵ cells per well, were seeded onto glass coverslips in 6-well plates and incubated overnight. The monolayer of cells cultured on the coverslips or transwell were subjected to the respective MB and LPS treatments, followed by two times washes with pre-cooling PBS, then fixed with 4% paraformaldehyde at room temperature for 15 min. After two times washes with PBS, the cell samples were treated with 0.2% Triton X-100 at room temperature for 10 min, followed by three washes with PBS, each lasting 5 min. The cell samples were then blocked with 3% bovine serum albumin at room temperature for 20 min. The blocking solution was discarded, and the samples were incubated with the corresponding primary antibodies (ZO-1, 1:500; NF-κB, 1:200) form proteintect (Wuhan, China, Cat #: 21773-1-AP) and Cell Signaling Technology (MA, USA, Cat #: 6956 T) overnight at 4°C. The primary antibodies were discarded, and the cell samples were washed three times with PBS, each time for 5 min. The cell samples were then incubated with a fluorescent secondary antibody (Alexa Fluor® 48878 conjugate) from Cell Signaling Technology Inc (Danvers, MA, USA, dilution ratio: 1:1000) at room temperature in the dark for 1 h. After three washes with PBS, each lasting 5 min, the cell samples were stained with 4ʹ,6-diamidino-2-phenylindole (Solarbio technology, Beijing, China) at room temperature for 10 min, followed by three final washes with PBS, each lasting 5 min. The cell samples were observed using a laser scanning confocal microscope (IX81-FV1000, Olympus, Tokyo, Japan) and (LSM 880, Zeiss, Oberkochen, Germany). The mean relative fluorescence intensity of ZO-1 was determined using the ImageJ software (version 1.51, National Institute of Health, MD, USA). All experiments were performed in triplicate.
Measurement of trans-epithelium electrical resistance (TEER) and FD4 permeability
The IPEC-J2 cells, at a density of 1 × 10⁵ cells per well, were seeded onto 12-well transwell inserts and continuously cultured for 21 days until TEER stabilizes (Fig. S1). For the first seven days of culture, the medium was changed every other day, and after seven days, the fresh medium was replaced daily. The TEER was measured every other day using a Millicell-ERS resistance system (Millipore, MA, USA). After the corresponding MB and LPS treatments, the final measurement of TEER, 100 μL of 1 mg/mL 4-kDa fluorescein isothiocyanate-dextran (FD4; Sigma-Aldrich, St. Louis, MO, USA) was added to the upper compartment of the transwell. The 12-well transwell was then returned to the cell culture incubator for an additional 30 min of culture. Subsequently, 100 μL of complete medium was aspirated from the lower compartment of the transwell and transferred to 96-well black opaque plates (Beyotime Biotechnology Co., Ltd., Shanghai, China). The fluorescence intensity was measured under an excitation wavelength of 480 nm and an absorption wavelength of 520 nm using a SepctraMax M5.
Western blot
The cell samples were lysed in a lysis buffer containing a cocktail of protease and phosphatase inhibitors (KeyGEN BioTECH, Nanjing, China). The protein concentration of the cell samples was determined using a BCA assay kit (KeyGEN BioTECH, Nanjing, China) following the instructions. Subsequently, the samples were adjusted to the same concentration using a lysis buffer and mixed with a 5 × loading buffer (Beyotime, Shanghai, China). The denaturation was conducted at 95°C for 10 min. After denaturation, the protein samples were separated by SDS-PAGE and transferred onto polyvinylidene fluoride membranes (Millipore, Massachusetts, USA). The membranes were blocked using 5% skimmed milk at room temperature for 1 h. The membranes were incubated with the primary antibody at 4°C overnight. After washing with TBST three times, the membranes were incubated with the secondary antibody at room temperature for 1 h. Following three washes with TBST, immunodetection was performed using the FDbio-Dura ECL kit (Fude biological technology Co., Ltd., Hangzhou, China). The primary antibodies were the following: ZO-1 antibody (Proteintect, Wuhan, China, Cat #: 21773-1-AP) 1:4000, occludin antibody (Proteintect, Wuhan, China, Cat #: 13409-1-AP) 1:3000, claudin-1 antibody (Proteintect, Wuhan, China, Cat #: 13050-1-AP) 1:2000, phospho-NF-κB p65 antibody (Cell Signaling Technology, Inc, Danvers, MA, USA, Cat #: 3033 T) 1:1000, NF-κB p65 antibody (Cell Signaling Technology, Inc, Danvers, MA, USA, Cat #: 6956 T) 1:1000, phospho-inhibitor kappa B alpha (IκBα) antibody (Huabio, Hangzhou, China, Cat #: ET1609-78) 1:1000, inhibitor kappa B alpha (IκBα) antibody (Huabio, Hangzhou, China, Cat #: ET1603-6) 1:1000, extracellular signal-regulated kinase 1/2 (Erk1/2) antibody (Cell Signaling Technology, Inc, Danvers, MA, USA, Cat #: 4695 T) 1:1000, phospho-Erk1/2 antibody (Cell Signaling Technology, Inc, Danvers, MA, USA, Cat #: 4370 T) 1:1000, p38 mitogen-activated protein kinase (MAPK) antibody (Cell Signaling Technology, Inc, Danvers, MA, USA, Cat #: 8690 T) 1:1000, phospho-p38 MAPK antibody (Cell Signaling Technology, Inc, Danvers, MA, USA, Cat #: 4511 T) 1:1000, JNK antibody (Cell Signaling Technology, Inc, Danvers, MA, USA, Cat #: 9252 T) 1:1000, phospho-JNK antibody (Cell Signaling Technology, Inc, Danvers, MA, USA, Cat #: 4668 T) 1:1000, HIF-1 alpha antibody (Proteintect, Wuhan, China, Cat #: 20960-1-AP) 1:1000, GAPDH antibody (Cell Signaling Technology, Inc, Danvers, MA, USA, Cat #: 2118 T) 1:4000, The images were acquired using a ChemiDoc MP (Bio-Rad Laboratories, Co., Ltd., Hercules, CA, USA). The intensities values of protein bands were analyzed using Image J software. The GAPDH served as the housekeeping protein.
Transcriptome sequencing
RNA extraction was performed using the TRIzol method (Invitrogen, CA, USA). To remove genomic DNA contamination, the extracted total RNA was treated with RNase-free DNase I (Takara, Kusatsu, Japan). The RNA was checked for degradation using 1% agarose gel, and the quality and integrity of the RNA were evaluated using an Agilent 2100 Bioanalyzer (Agilent Technologies, CA, USA) and a NanoDrop spectrophotometer (Thermo Scientific, DE, USA). RNA that passed the quality check was used for subsequent sequencing steps.
A 1.5 µg of RNA from cell samples was used as input material for the RNA sample preparations. Sequencing libraries were generated using the NEBNext® Ultra™ RNA Library Prep Kit for Illumina® (NEB, USA) following the manufacturer’s instructions. The library preparations were sequenced on an Illumina Novaseq 6000 platform by the Beijing Allwegene Technology Company Limited (Beijing, China), and paired-end 150 bp reads were generated.
The quality of the raw reads was evaluated using FastQC (version 0.12.1) and MultiQC (version 1.14) software. Raw reads were trimmed of adapter reads, bases with an uncertain base ratio greater than 10%, and low-quality bases (Q ≤ 20) using Trimmomatic software (version 0.39). HISAT2 software (version 2.2.1) aligned clean reads to the reference genome. After format conversion of the alignment files using SAMtools software (version 1.17), gene expression levels were analyzed using FeatureCounts software (subread version 2.0.5). After calculating the counts, the transcript per million eliminated the influence of gene lengths and sequencing discrepancies to enable direct comparison of gene expression between samples.
Differentially expressed genes (DEGs) between two treatment groups were analyzed using the R package DESeq2 (version 1.40.2). Genes were considered significantly differentially expressed if the q value was <0.05 and |fold change| >1.5. DEGs were subjected to gene ontology (GO) analysis and gene set enrichment analysis (GSEA) using the R package ClusterProfiler (version 4.8.3). The treeplot function in the R package Enrichplot (version 1.20.1) was used to perform hierarchical clustering of the enrichment results and to count high-frequency words. The DEGs information can be found in Supplement material 2.
Statistical methods
Data in the study were represented as mean ± standard error of the mean (SEM). The statistical analysis of data differences was performed using GraphPad Prism software (version 8.0). Unpaired T-tests were used for comparisons between the two groups. One-way analysis of variance was employed for comparisons among three or more groups, followed by post hoc comparisons using Tukey’s test. * Indicates P < 0.05, and ** indicates P < 0.01.
Result
The effect of MB on the vitality of IPEC-J2 cells
The results of the CCK-8 experiment indicate that when the MB treatment time is 12 h, and the concentration exceeds 4 mM, the vitality of IPEC-J2 cells significantly decreases (Fig. 1, P < 0.05). Consequently, we primarily selected a dosage of 4 mM for subsequent cellular experiments.

Figure 1. Effects of monobutyrin (MB) on the viability of porcine small intestinal epithelial cell line (IPEC-J2) cells. Cell viability was measured using a CCK-8 assay. Data were expressed as the mean ± SEM with eight independent replicates (n = 8); *P < 0.05 and **P < 0.01 compared to the control group.
MB enhance the TEER and the expression of tight junction proteins in IPEC-J2 cells
We constructed a monolayer of IPEC-J2 cells and treated it continuously with MB for 12 h, conducting TEER measurements and collecting cell samples every 4 h. The results revealed that as the MB treatment times increased, the TEER of the IPEC-J2 cell monolayer gradually increased, reaching a significant level at the 12-h treatment (Fig. 2A, P < 0.05). The western blot results for tight junction proteins demonstrated that at the 8-h treatment, MB significantly elevated the levels of ZO-1 protein in IPEC-J2 cells (Fig. 2B). At the 12-h treatment of MB, they significantly enhanced the levels of both ZO-1 and occludin proteins (Fig. 2C, P < 0.05). MB treatment does not significantly affect the expression level of claudin-1 (P > 0.05).
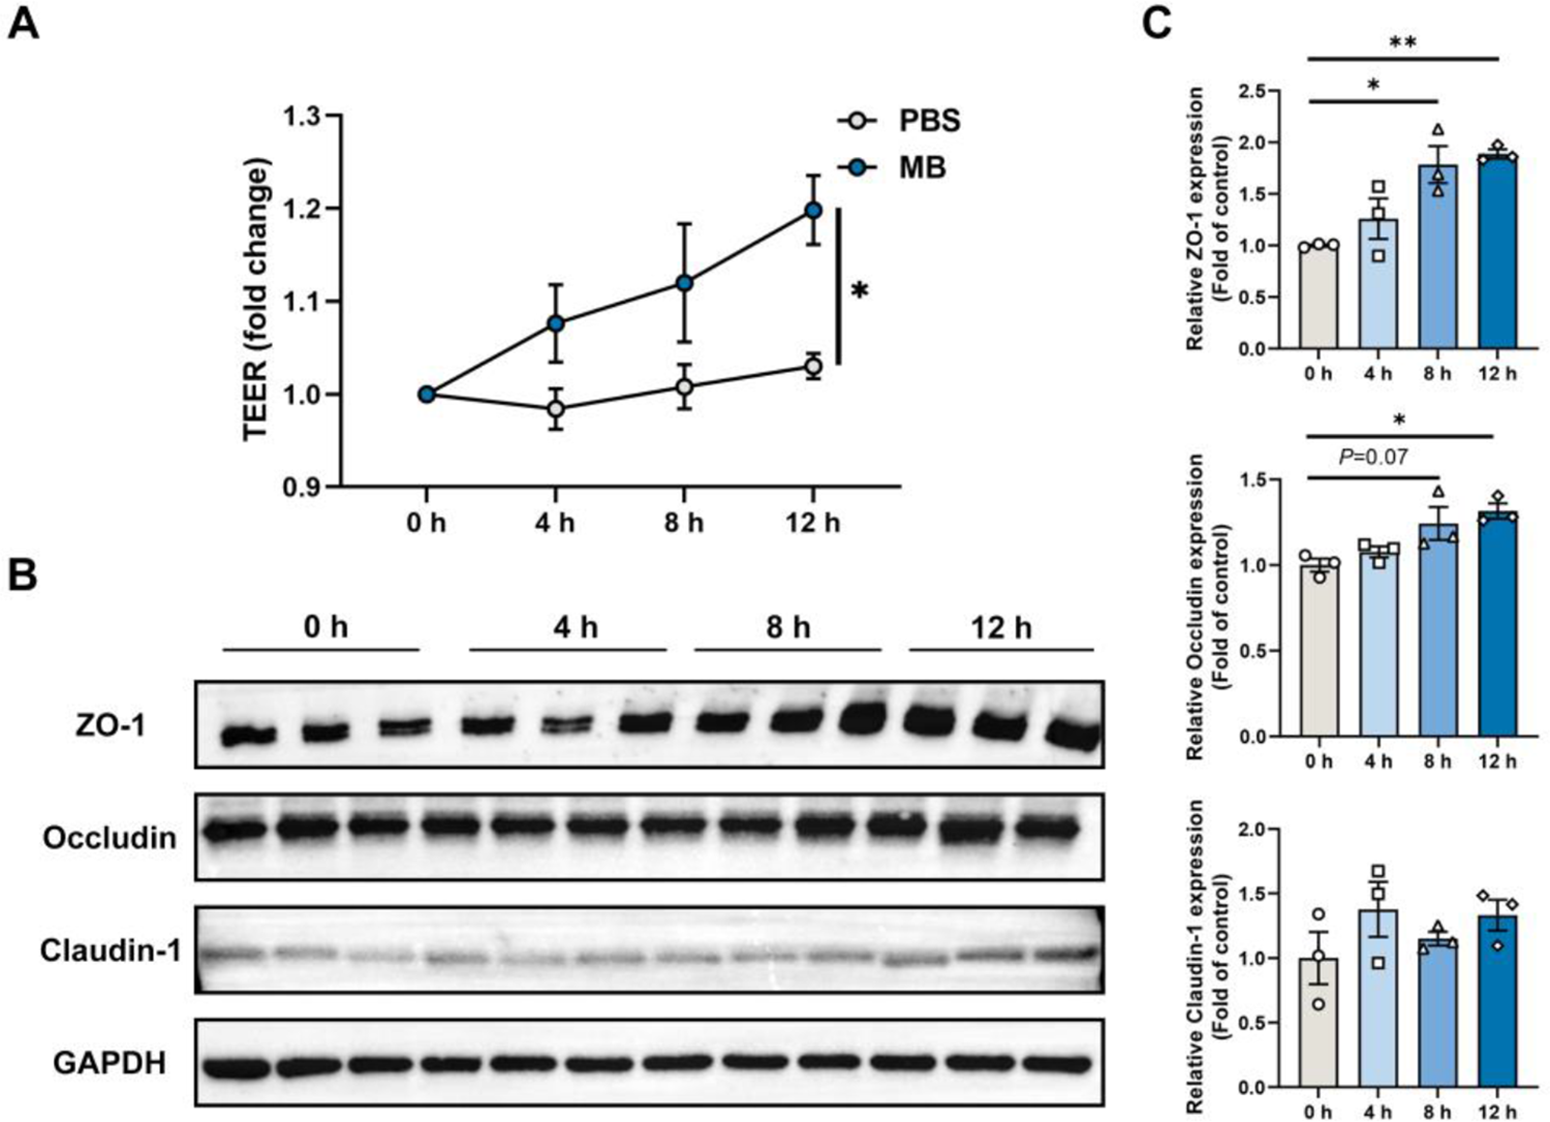
Figure 2. The effect of monobutyrin (MB) treatment on trans-epithelium electrical resistance (TEER) and tight junction protein expression in porcine small intestinal epithelial cell line (IPEC-J2) cell monolayer. (A) Changes in TEER values of IPEC-J2 cell monolayer treated with MB and PBS for 12 h (measured every 4 h). (B) Western blot detection of changes in tight junction protein expression in IPEC-J2 cell monolayer treated with MB for 12 h (sampled every 4 h). (C) Quantitative results of tight junction protein western blot bands. Data were expressed as the mean ± SEM with three independent replicates (n = 3); *P < 0.05 and **P < 0.01 compared to the control group.
The transcriptomic response of IPEC-J2 cells to MB treatment
The principal component analysis (PCA) and top100 DEGs heatmap demonstrate significant changes in the gene expression of IPEC-J2 cells following MB treatment (Fig. 3B and C). A volcano plot was utilized to display the overall situation of DEGs (Fig. 3A). Compared to the PBS treatment group, the MB treatment group upregulated 695 genes and downregulated 452 genes (fold change > 1.5, q value < 0.05). We conducted a GO enrichment analysis on DEGs and performed hierarchical clustering and high-frequency word statistics on the enrichment results (Fig. 3D and E). The results showed that the upregulated DEGs GO enrichment after MB treatment mainly concentrated on activation development organization and cell adhesion (including calcium ion binding and anion transmembrane transport), locomotion cell motility migration, phosphorylation tyrosine kinase activity, cellular decreased oxygen levels, and carboxylic monocarboxylic fatty acid. The downregulated DEGs GO enrichment mainly concentrated on tissue junction morphogenesis development, negative acid-templated biosynthetic metabolic, cls-regulation polymerase DNA binding, motile cilium assembly organization, and Ciliary cytoplasmic plasm cytoplasm. In addition, the GSEA result analysis further confirmed the enrichment results of DGEs in GO (Fig. 3F). The GSEA results showed that the upregulated enrichment of IPEC-J2 genes after MB treatment mainly occurred in the MAPK signaling pathway, cell adhesion molecules, cell junction, cellular response to oxygen-containing compounds, and calcium signaling pathway.
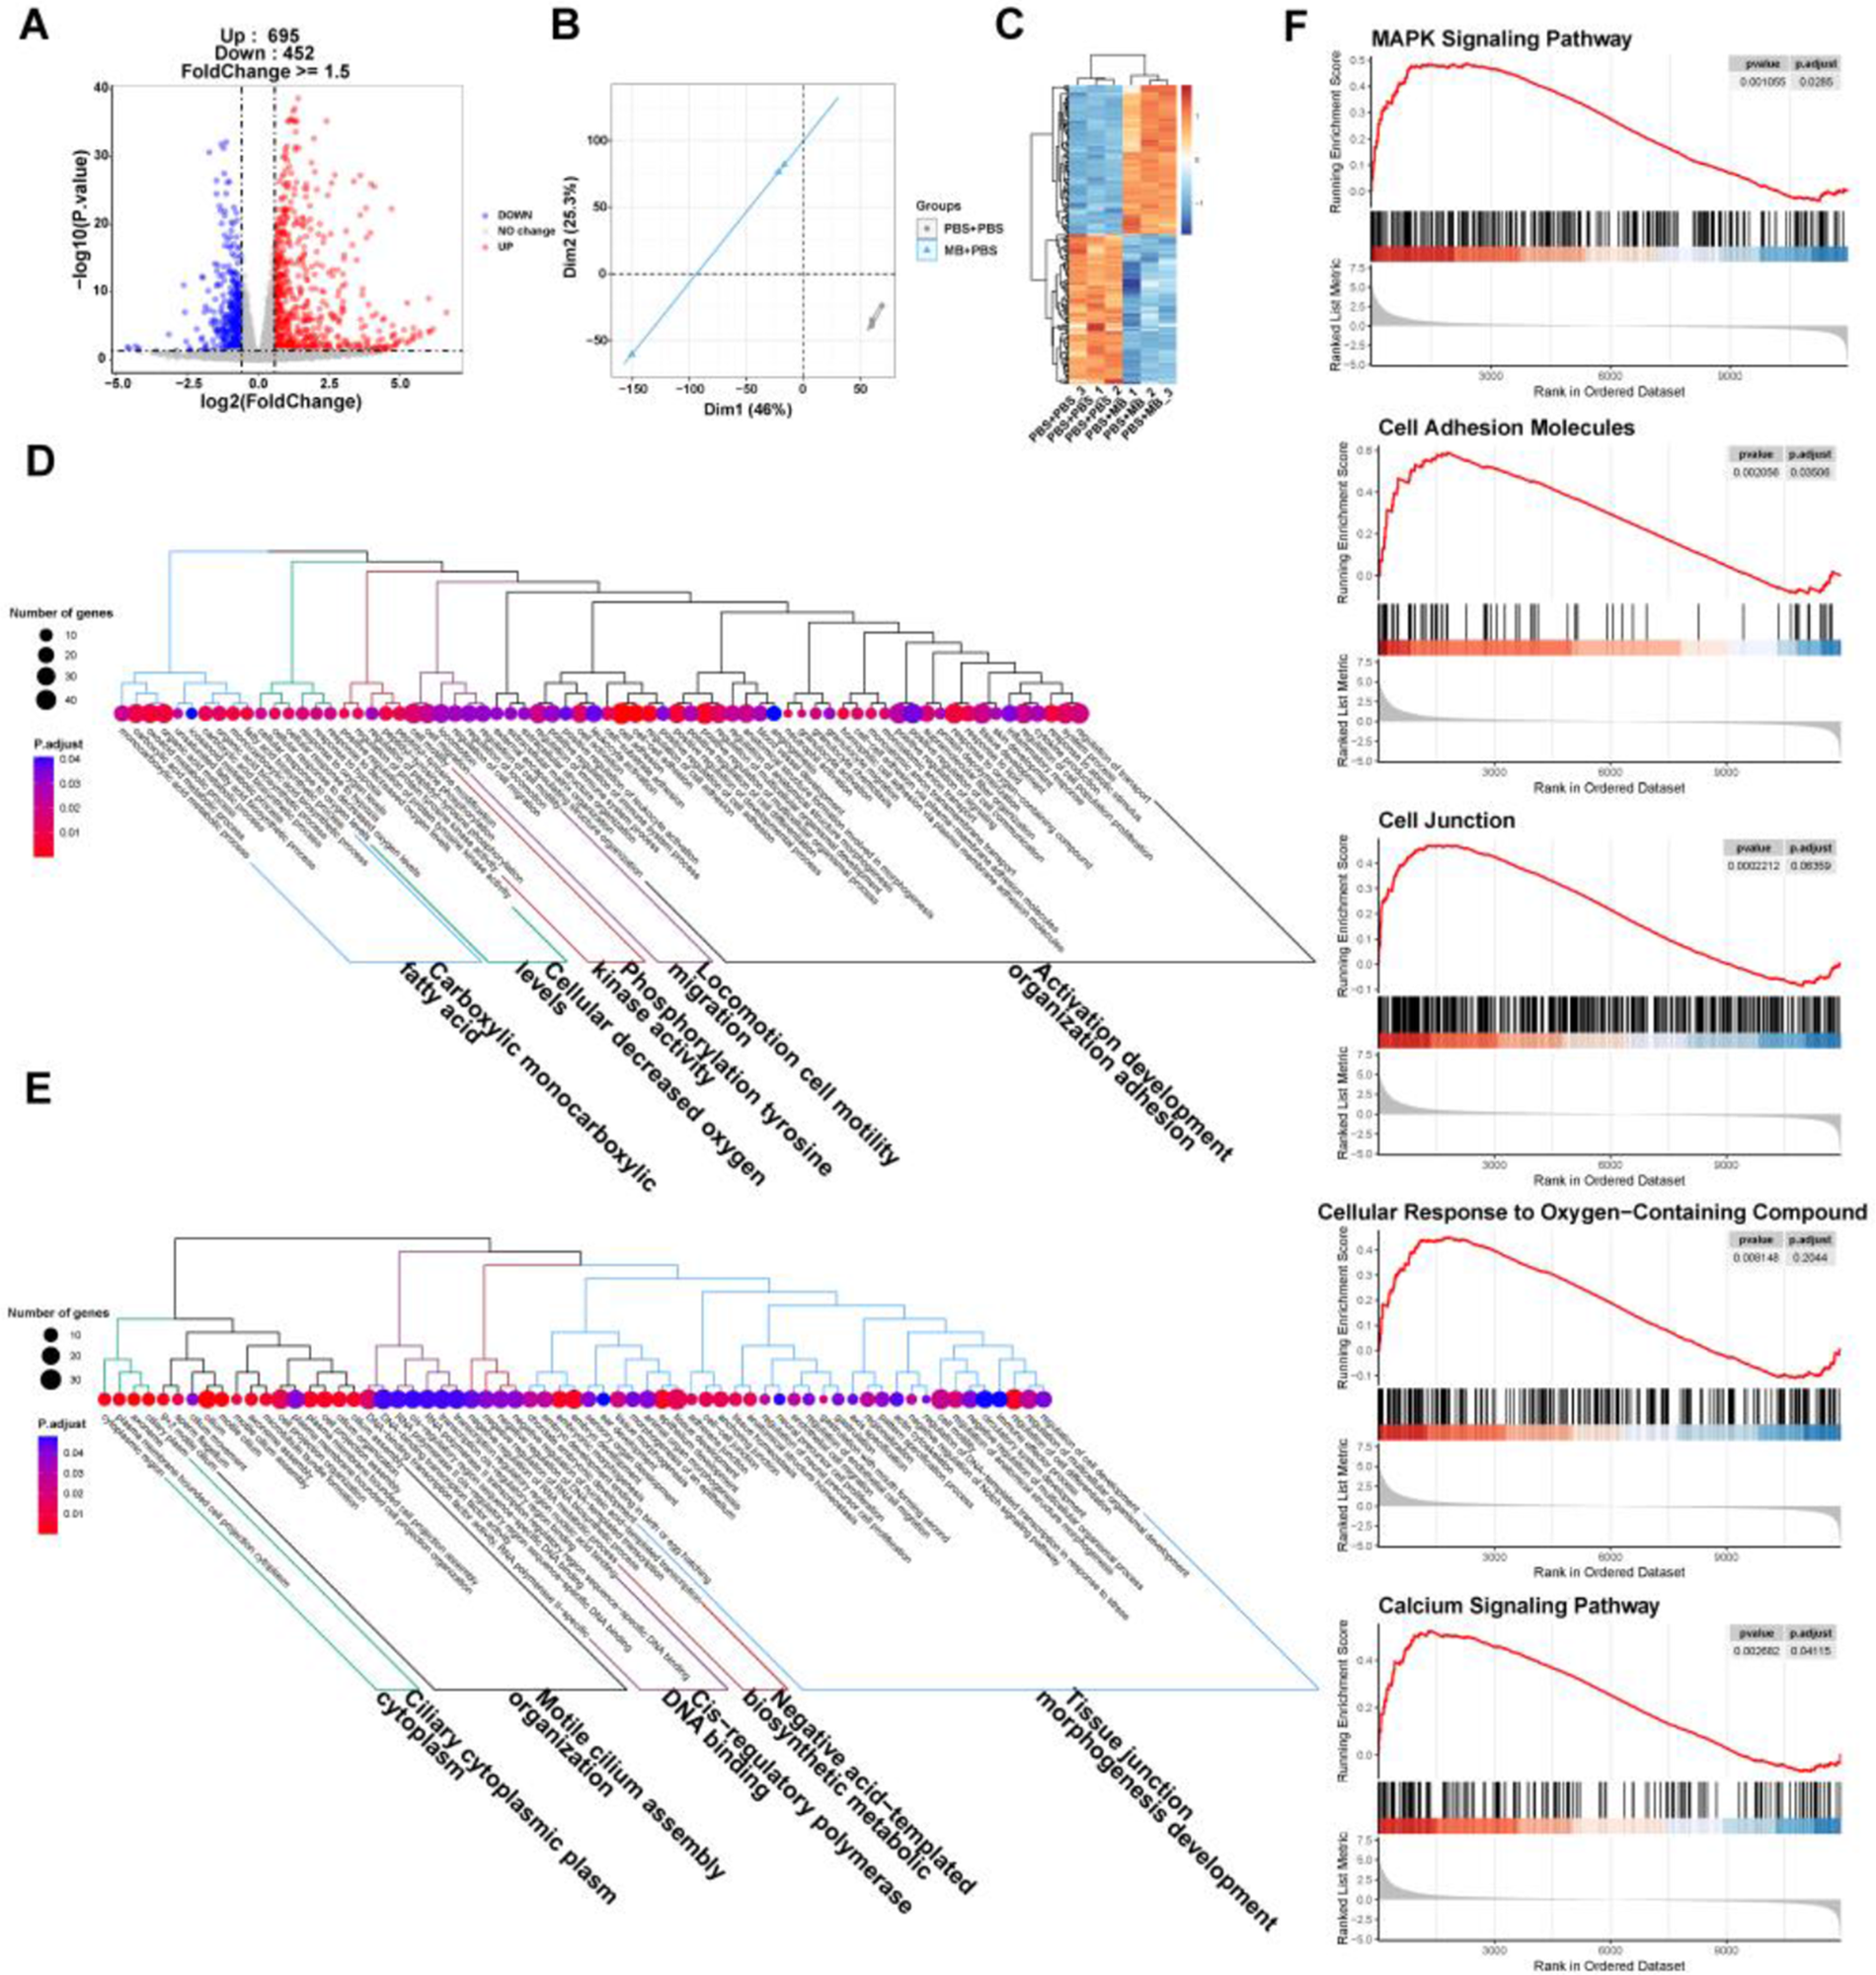
Figure 3. The effect of monobutyrin (MB) treatment on the transcriptome response of porcine small intestinal epithelial cell line (IPEC-J2) cells. (A) Volcano plot of differentially expressed genes (DEGs) between the phosphate buffer saline (PBS) treatment group and the MB treatment group. (B) Principal components analysis (PCA) plot of DEGs between the PBS and MB treatment groups. (C) Heatmap of DEGs between the PBS treatment group and the MB treatment group. (D) Dendrogram of gene ontology (GO) function enrichment analysis of upregulated DEGs between the PBS and MB treatment groups. (E) Dendrogram of GO function enrichment analysis of downregulated DEGs between the PBS and MB treatment groups. (F) Gene set enrichment analysis (GSEA) analysis results of upregulated GO between the PBS and MB treatment groups. Mitogen-activated protein kinase (MAPK). n = 3.
Verification of transcriptome of IPEC-J2 cells treated with MB
Based on the transcriptome analysis, key signaling molecules in the MAPKs, NF-κB (associated with inflammation response), and hypoxia-inducible factor 1 (HIF1; it reflects the oxygen level in the cell) signaling pathways were selected to assess their protein expression levels (Fig. 4A). The results indicated (Fig. 4B) that MB significantly elevated the levels of HIF1 and p-ERK proteins in the IPEC-J2 cells monolayer after 8 h of MB treatment (P < 0.05). MB treatment had no significant effect on the levels of p-JNK and p-p38 proteins in the IPEC-J2 cells monolayer (P > 0.05). With increasing MB treatment time, the level of p-p65 protein gradually decreased (P < 0.05). Additionally, at 8 h of MB treatment in the IPEC-J2 cell monolayer, MB significantly altered the expression level of p-ERK protein (P < 0.05). Furthermore, the network analysis (Fig. 4C) of cellular signaling pathways indicated associations between HIF1, MAPKs, and tight junctions. Hence, it is hypothesized that MB treatment may regulate the expression of tight junction proteins through the activation of HIF1 and ERK1/2.

Figure 4. Verification of transcriptome results through western blot detection. (A) Western blot detection of changes in the expression of related proteins in the porcine small intestinal epithelial cell line (IPEC-J2) cell treated with monobutyrin (MB) for 12 h (sampled every 4 h). (B) Quantitative results of related pathway protein western blot bands. (C) Results of pathway network association analysis. Data were expressed as the mean ± SEM with three independent replicates (n = 3). Hypoxia-inducible factor-1 (HIF1). Phospho-NF-κB p65 (p-p65). NF-κB p65 (p65). Phospho-c-Jun N-terminal kinase (p-JNK). c-Jun N-terminal kinase (JNK). Phospho-p38 mitogen-activated protein kinase (p-p38). P38 MAPK (p38). Phospho-extracellular signal-regulated kinase 1/2 (p-ERK1/2). Extracellular signal-regulated kinase 1/2 (Erk1/2). *P < 0.05 and **P < 0.01 compared to the control group.
The dosage of MB for alleviating the damage to tight junctions caused by LPS stimulation
Initially, we utilized the CCK-8 assay to screen for the dosage of LPS that stimulates cells. The results indicated that when the concentration of LPS was 10 μg/mL and the stimulation time was 8 h, it can significantly reduce the viability of IPEC-J2 cells (Fig. S2, P < 0.05). Therefore, this dosage and time of LPS treatment were adopted for subsequent experiments. Next, to screen for the effective dosage of MB pretreatment that alleviates the damage to the cell tight junction caused by LPS stimulation, we pretreated the cells with different dosages of MB for 12 h, followed by 8 h of LPS stimulation (Fig. 5). Cell samples were collected to detect the mRNA expression level of tight junction proteins. The results showed that when the concentration of MB pretreatment reached 0.5 mM, MB could alleviate the reduction in ZO-1 mRNA expression in IPEC-J2 cells caused by LPS stimulation (P < 0.05). When the concentration of MB pretreatment reached 2 mM, MB could alleviate the reduction in ZO-1 and occludin mRNA expression in IPEC-J2 cells caused by LPS stimulation (P < 0.05). MB pretreatment had no significant effect on the reduction of claudin-1 mRNA caused by LPS stimulation (P > 0.05). Combined with cell viability assay results, an MB pretreatment concentration of 4 mM was selected for subsequent use.
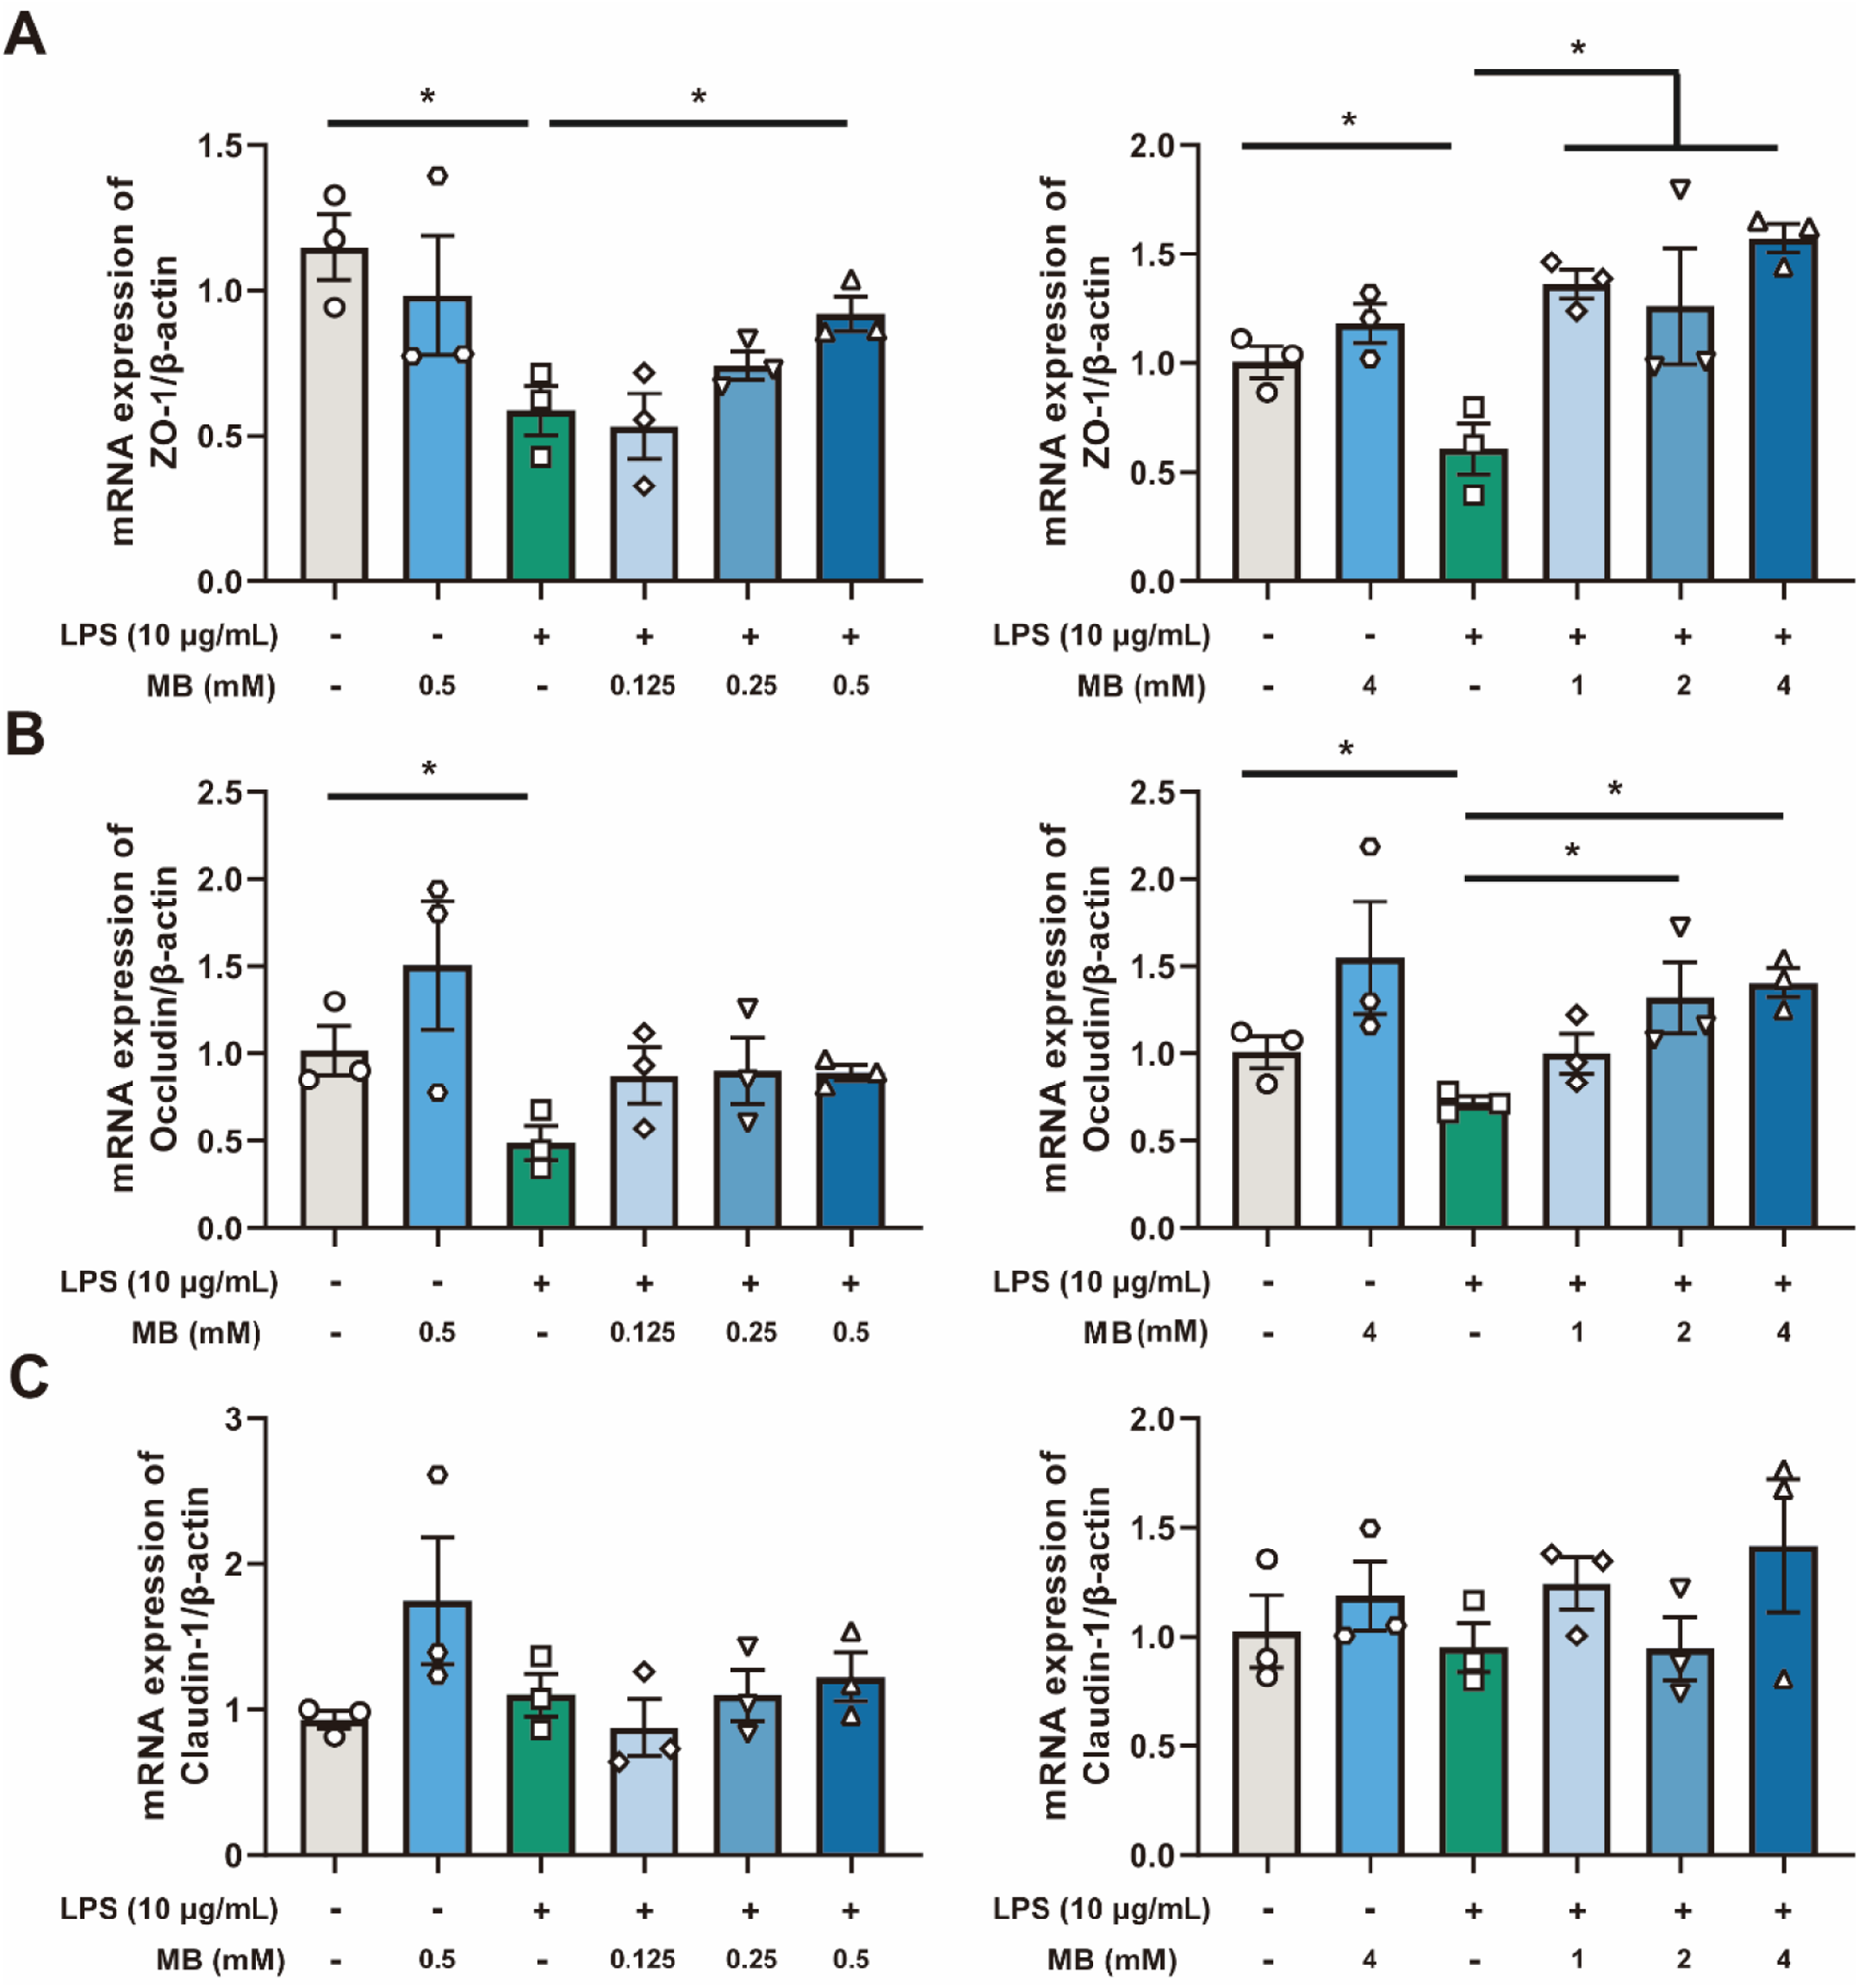
Figure 5. The effect of different concentrations of monobutyrin (MB) pretreatment on the reduction of tight junction mRNA expression in porcine small intestinal epithelial cell line (IPEC-J2) cells caused by lipopolysaccharides (LPS) stimulation. (A, B and C) represent the effect of MB (concentration: 0.125 to 4 mM) on the mRNA expression of ZO-1, occludin, and claudin-1 in IPEC-J2 cells stimulated by LPS, respectively. Data were expressed as the mean ± SEM with three independent replicates (n = 3). “−” and “+” mean with and without corresponding treatments, respectively. *P < 0.05 and **P < 0.01 compared to the LPS treatment group.
MB alleviate the damage to the mucin barrier of IPEC-J2 cells caused by LPS stimulation
LPS stimulation reduces the mRNA expression levels of MUC12 and MUC20 in IPEC-J2 cells (Fig. 6B, P = 0.06 and P < 0.05, respectively). Pretreatment with MB alleviated the reduction in the mRNA expression levels of MUC12 and MUC20 (P < 0.05). Additionally, MB pretreatment enhanced the mRNA expression level of MUC13 in IPEC-J2 cells (P < 0.01). We also conducted PAS staining on IPEC-J2 cells, corroborating our previous conclusions (Fig. 6A). LPS treatment decreased the PAS staining degree in IPEC-J2 cells, while MB pretreatment alleviated the weakening of PAS staining caused by LPS stimulation.
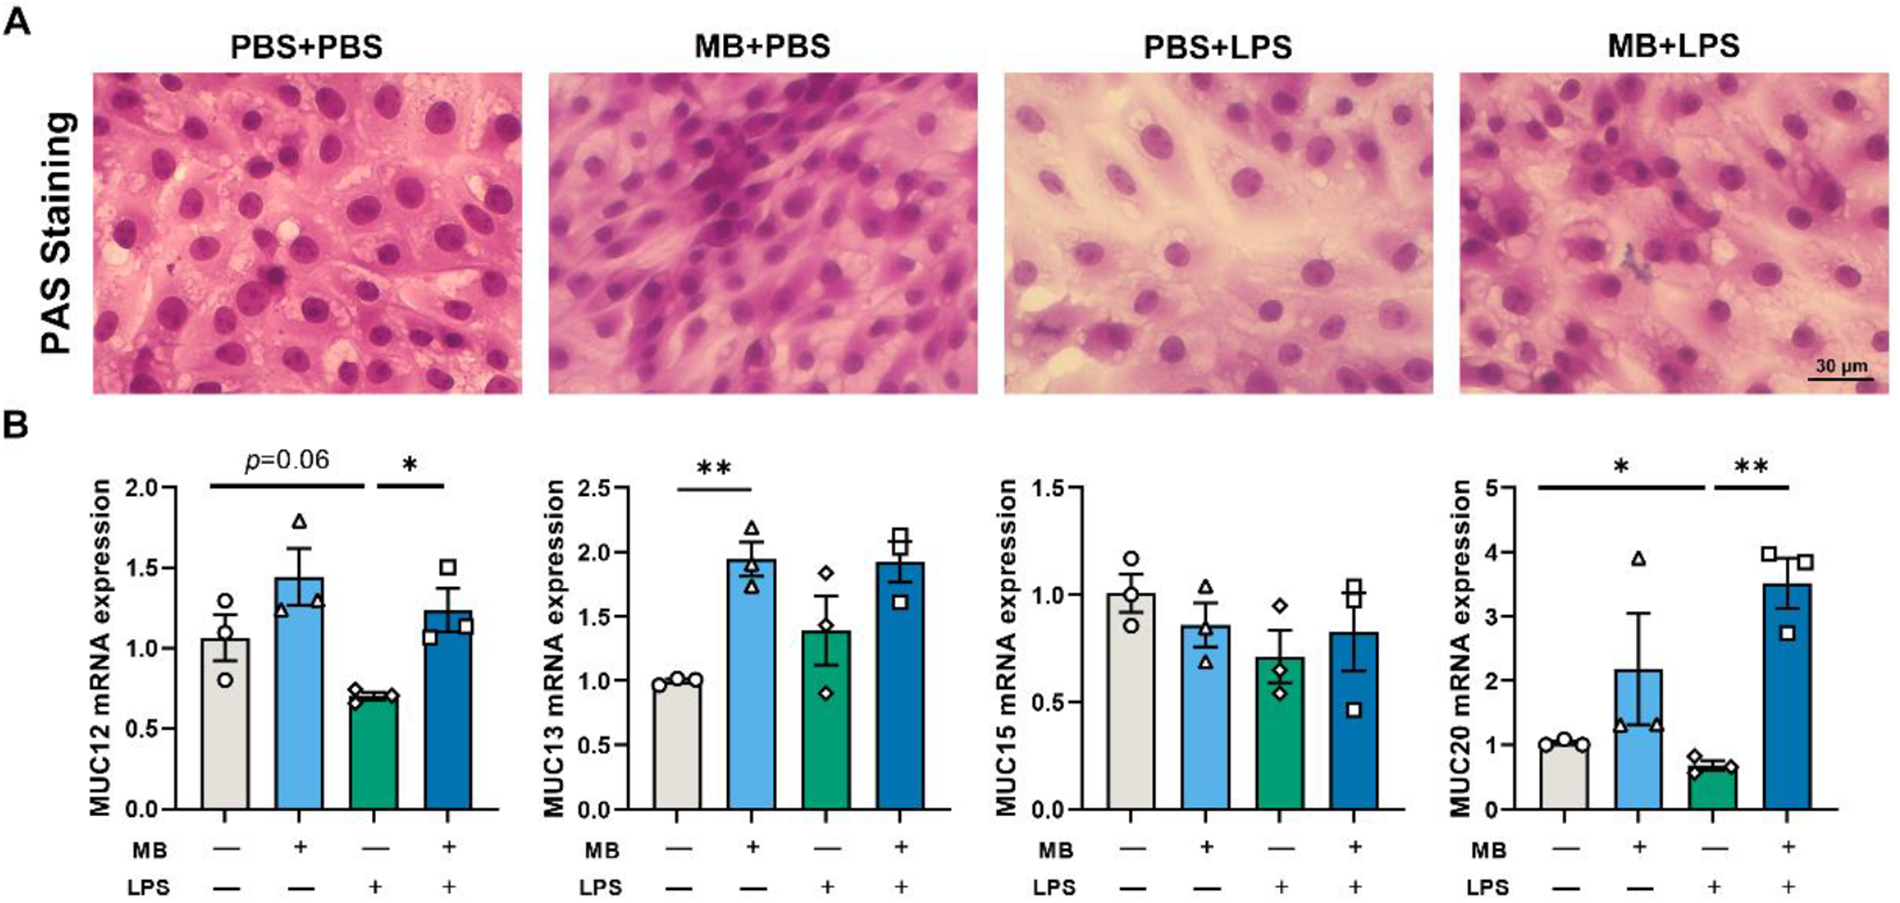
Figure 6. The effect of monobutyrin (MB) pretreatment on the damage to the mucin layer of porcine small intestinal epithelial cell line (IPEC-J2) cells caused by lipopolysaccharides (LPS) stimulation. (A) Optical microscope observation of different treatment groups under a periodic acid-Schiff (PAS)-stained. (B) The effects of MB on the expression of MUC-related genes in IPEC-J2 cells stimulated by LPS. Data were expressed as the mean ± SEM with three independent replicates (n = 3). “−” and “+” mean with and without corresponding treatments, respectively. *P < 0.05 and **P < 0.01.
MB alleviate the damage to the tight junctions and microscopic structure of IPEC-J2 cells caused by LPS stimulation
Following LPS stimulation, the relative fluorescence intensity of ZO-1 in IPEC-J2 cells decreases (Fig. 7A, P < 0.05). Pretreatment with MB could alleviate the reduction in the relative fluorescence intensity of ZO-1 caused by LPS stimulation (P < 0.05). After LPS stimulation, the level of occludin in IPEC-J2 cells decreases (Fig. 7B, P < 0.05). MB pretreatment could alleviate the reduction in occludin expression caused by LPS stimulation. MB pretreatment alone could significantly increase the level of occludin expression in cells (P < 0.05). The effect of MB on the IPEC-J2 cells monolayer stimulated by LPS is shown in Fig. 7E–H. The results indicate that MB pretreatment alleviated the reduction in the relative fluorescence intensity of ZO-1 and the TEER decreasing in cells caused by LPS stimulation (Fig. 7E–H). In addition, MB also alleviated the FD4 levels increasing caused by LPS stimulation (Fig. 7G, P < 0.05). After 21 days of continuous culture, IPEC-J2 cells can differentiate into microvilli structures similar to the intestinal epithelial cells in the body. Therefore, we conducted an SEM observation of IPEC-J2 cells (Fig. 7D). The results revealed that LPS stimulation causes a decrease in microvilli density in the IPEC-J2 cells monolayer, while MB pretreatment alleviated the reduction in microvilli density caused by LPS stimulation.
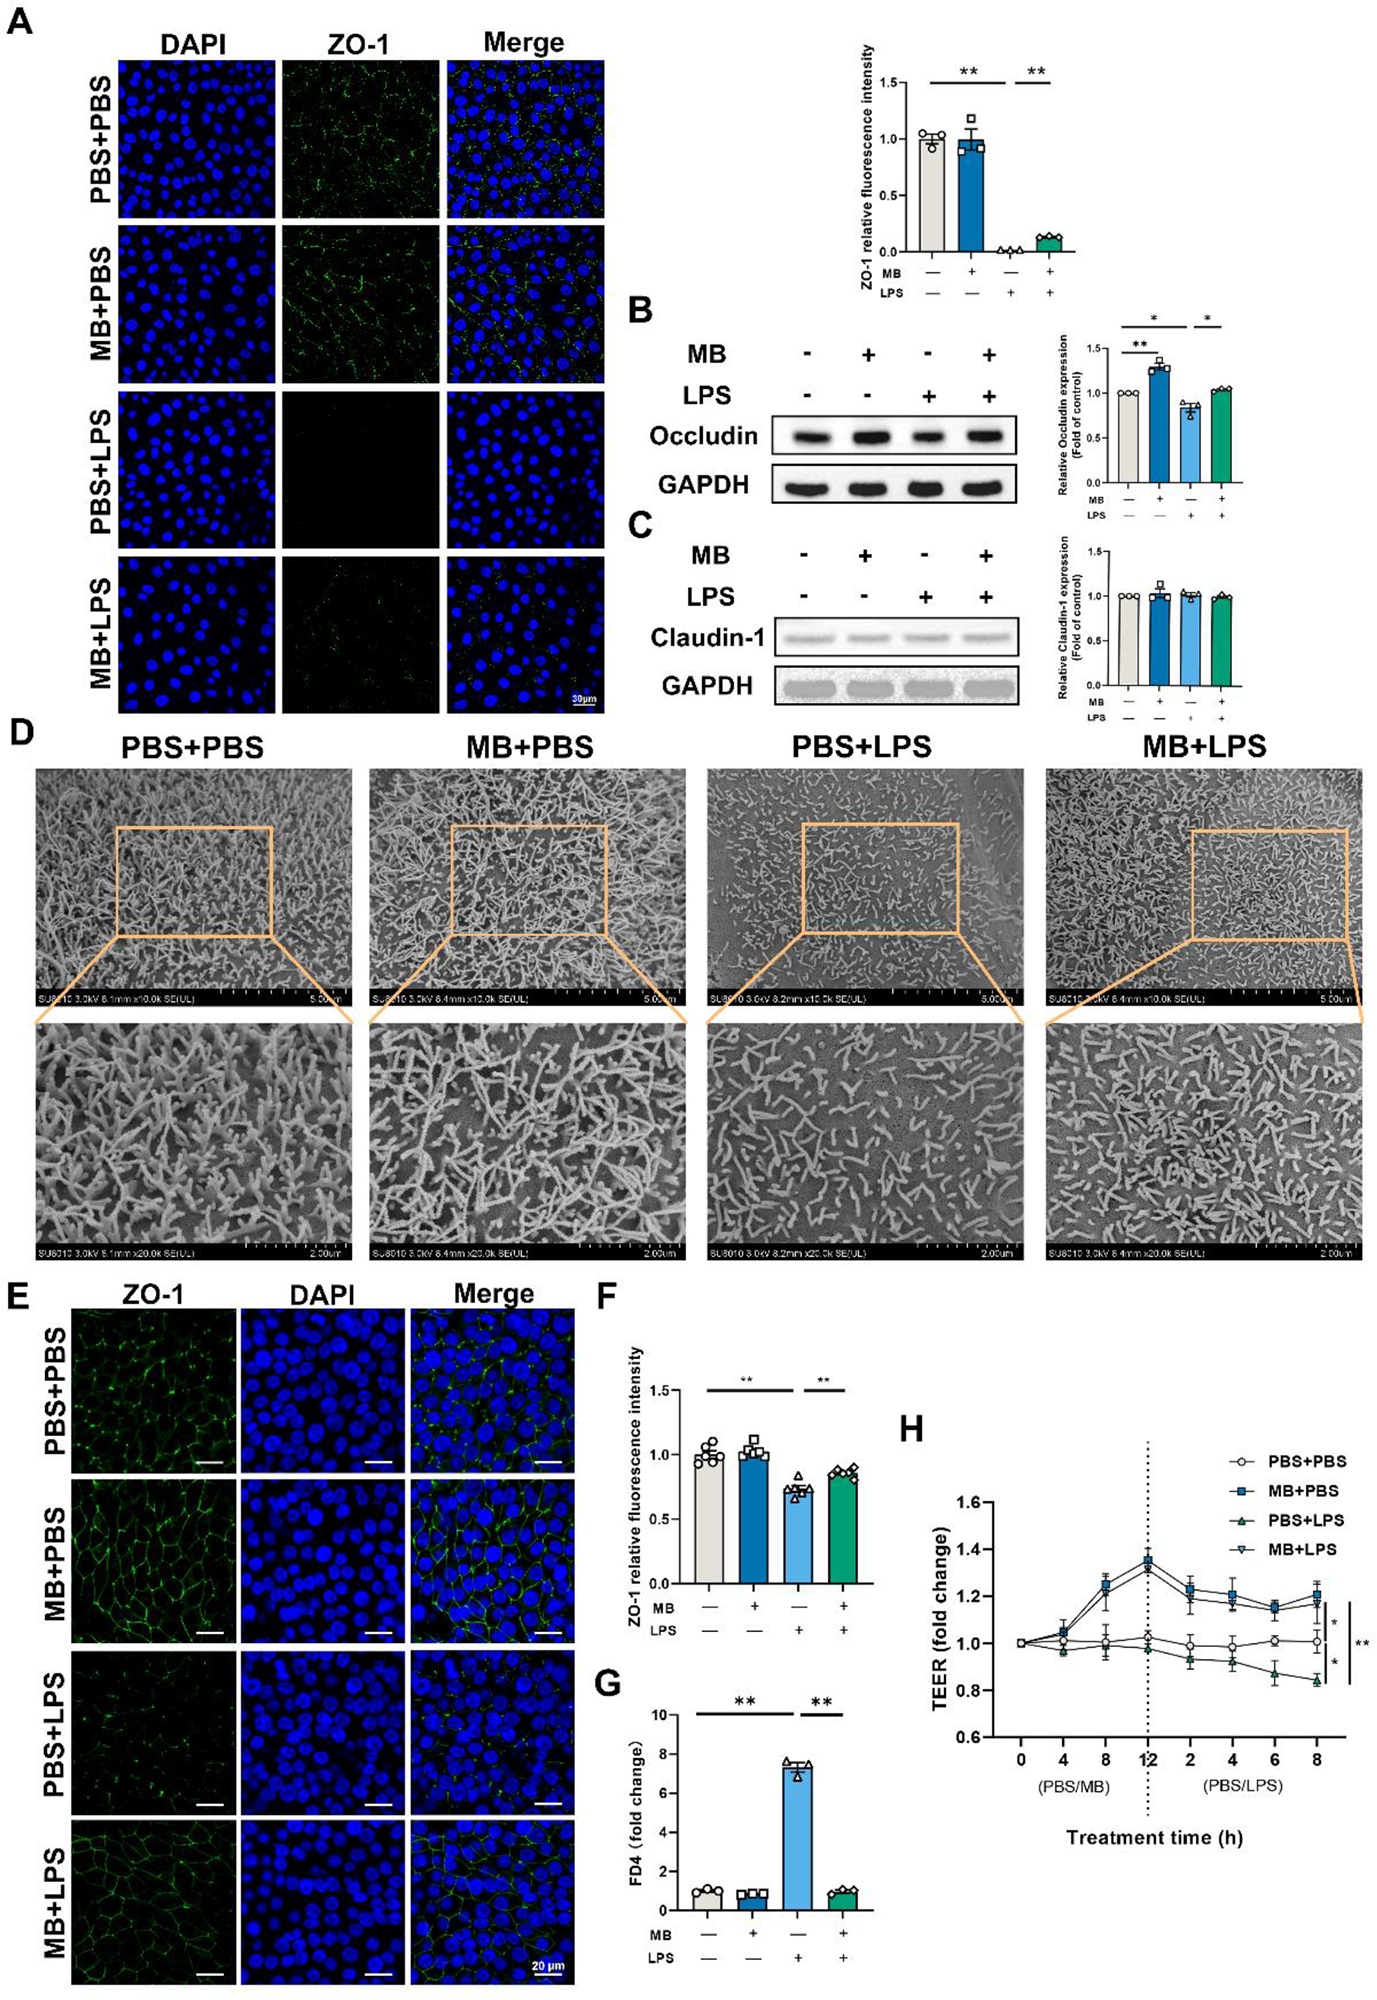
Figure 7. The effect of monobutyrin (MB) pretreatment on the damage to the tight junctions and microscopic structure of porcine small intestinal epithelial cell line (IPEC-J2) cells caused by lipopolysaccharides (LPS) stimulation. (A) Observation of ZO-1 laser scanning confocal microscope (LSCM) and its fluorescence intensity quantitative analysis results in IPEC-J2 cells among different treatment groups (Scale: 30 μm). Among different treatment groups, (B) occludin and (C) claudin-1 western blot detection results and their band quantification result. (D) SEM observation results of IPEC-J2 cell monolayer among different treatment groups (10000 and 20000 × magnification). (E) Observation of ZO-1 LSCM in IPEC-J2 cell monolayer among different treatment groups (Scale: 20 μm) and (F) its fluorescence intensity quantitative analysis results. (G) Fluorescein isothiocyanate dextran 4 (FD4) permeability of IPEC-J2 cell monolayer after corresponding treatment. (H) Changes in trans-epithelium electrical resistance (TEER) values after corresponding MB and LPS treatment. Data were expressed as the mean ± SEM with three independent replicates (n = 3). “−” and “+” mean with and without corresponding treatments, respectively. *P < 0.05 and **P < 0.01.
The transcriptomic response of IPEC-J2 cells to MB pretreatment following by LPS stimulation
The PCA and top 100 DEGs gene heatmap reveal significant changes in the gene expression of IPEC-J2 cells following MB pretreatment and subsequent LPS stimulation (Fig. 8B and C). A volcano plot was utilized to display the overall situation of DEGs (Fig. 8A). Compared to the PBS + LPS treatment group, the MB + LPS treatment group upregulated 737 genes and downregulated 474 genes (fold change > 1.5, q value < 0.05). We conducted a GO enrichment analysis on DEGs and performed hierarchical clustering and high-frequency word statistics on the enrichment results (Fig. 8D and E). The results showed that the upregulated DEGs GO enrichment after MB treatment mainly concentrated on the activation response of the immune system, epithelial locomotion motility migration, blood tube vessel development, carboxylic monocarboxylic fatty acid, and acylglycerol neutral triglyceride metabolic. The downregulated DEGs GO enrichment mainly concentrated on 9 + 2 sperm flagellum cilium, axoneme bundle assembly formation, actin anchoring junction differentiation, microtubule cytoskeleton, and ciliary cytoplasmic bounded cytoplasm. In addition, the GSEA result analysis further confirmed the enrichment results of DGEs in GO (Fig. 8F). The GSEA results showed that the upregulated enrichment of IPEC-J2 genes after MB pretreatment and subsequent LPS stimulation mainly occurred in the MAPK signaling pathway, cell adhesion, cell junction, response to hypoxia, and calcium signaling pathway.
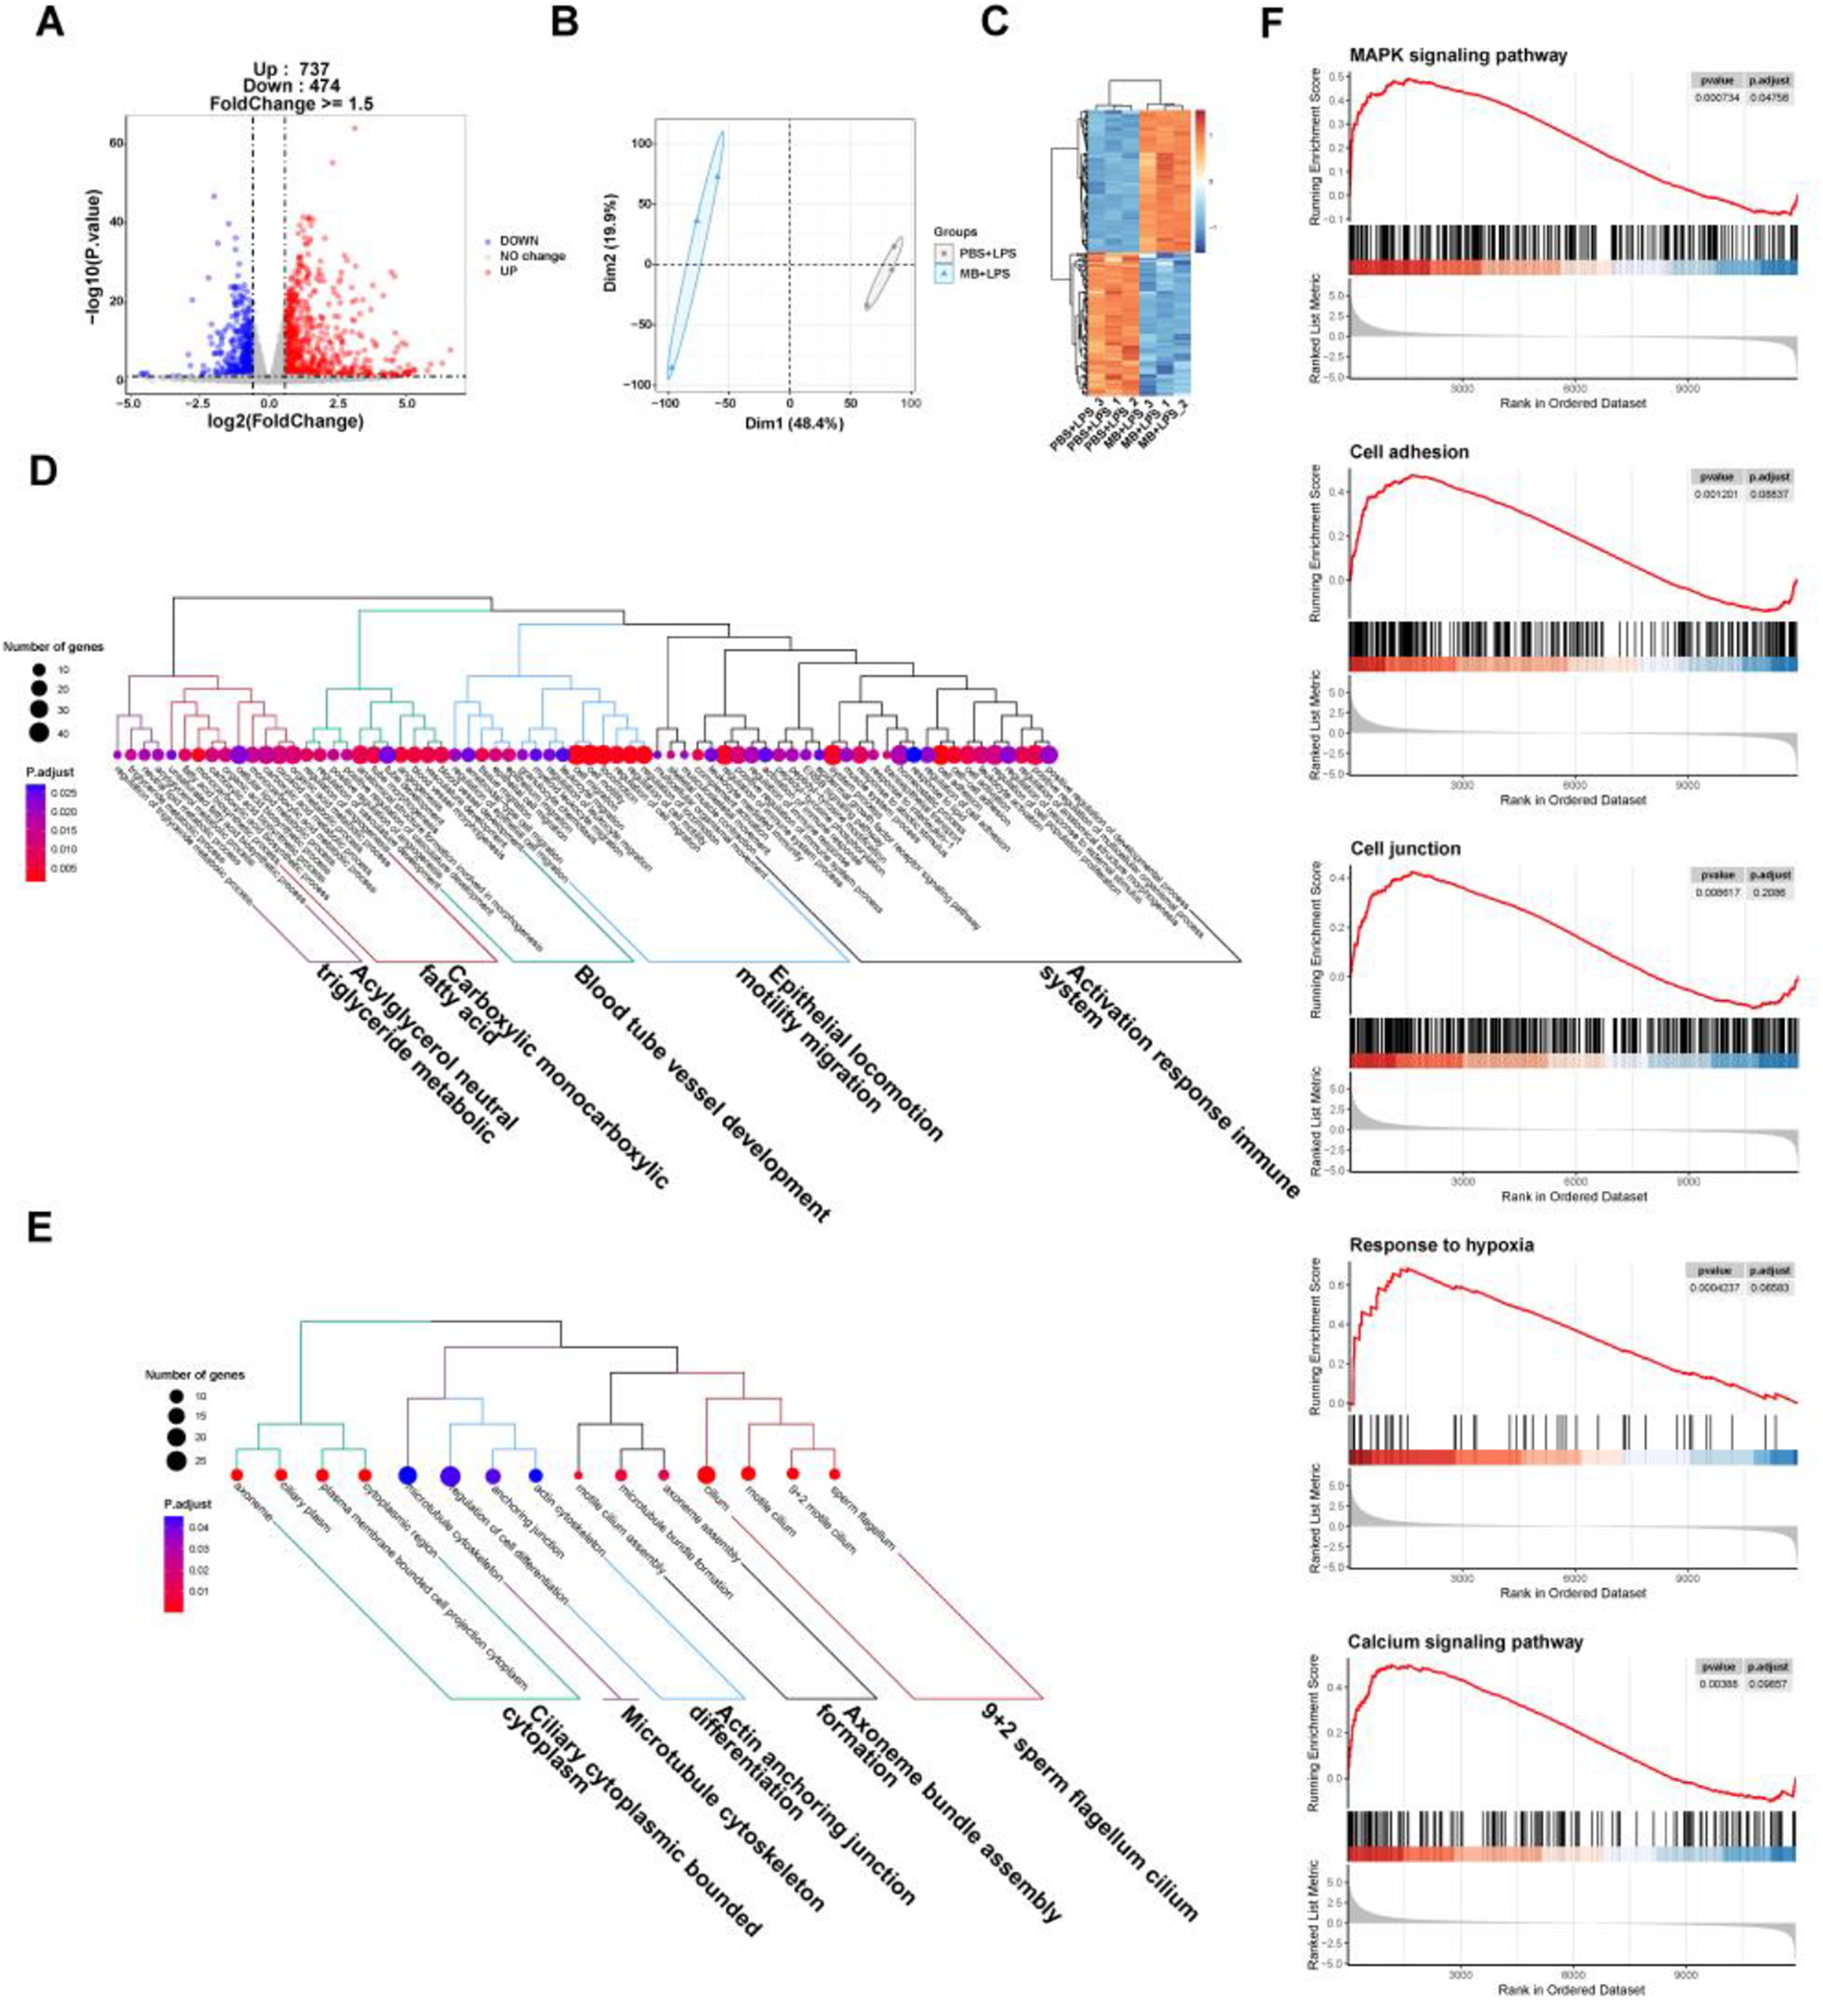
Figure 8. The effect of monobutyrin (MB) pretreatment on the transcriptome response of IPEC-J2 cells stimulated by lipopolysaccharides (LPS). (A) Volcano plot of differentially expressed genes (DEGs) between the phosphate buffer saline (PBS)+LPS treatment group and the MB+LPS treatment group. (B) Principal components analysis (PCA) plot of DEGs between the PBS+LPS treatment group and the MB+LPS treatment group. (C) Heatmap of DEGs between the PBS+LPS treatment group and the MB+LPS treatment group. (D) Dendrogram of gene ontology (GO) function enrichment analysis of upregulated DEGs between the PBS+LPS treatment group and the MB+LPS treatment group. (E) Dendrogram of GO function enrichment analysis of downregulated DEGs between the PBS+LPS treatment group and the MB+LPS treatment group. (F) Gene set enrichment analysis (GSEA) analysis results of upregulated GO between the PBS+LPS treatment group and the MB+LPS treatment group. Mitogen-activated protein kinase (MAPK). n = 3.
Verification of transcriptome results of MB pretreatment on LPS stimulated IPEC-J2 cells
We detected vital signaling molecules in the MAPKs pathway, NF-κB, and HIF1 pathway based on the transcriptome results (Fig. 9). The results showed that MB pretreatment alleviated the increased p-IκBα and p-p65 protein expression caused by LPS stimulation (Fig. 9A, P < 0.05). Simultaneously, we used LSCM to locate the p65 protein (NF-κB signaling pathway), and the results showed that MB pretreatment reduced the nuclear displacement of the p65 protein and the fluorescence intensity in nuclear localization (Fig. 9B). LPS stimulation enhanced the protein expression of HIF1 (Fig. 9B). MB alleviated the increase in HIF1 protein expression (P < 0.05). At the same time, LPS stimulation increased the expression of p-p38 proteins in IPEC-J2 cells, with no significant effect on the expression of p-ERK1/2 protein. In addition, whether under normal conditions or LPS stimulation conditions, MB pretreatment could increase the expression p-ERK1/2 in IPEC-J2 cells (P < 0.05). However, it does not alleviate the increase of p-p38 protein (P > 0.05).
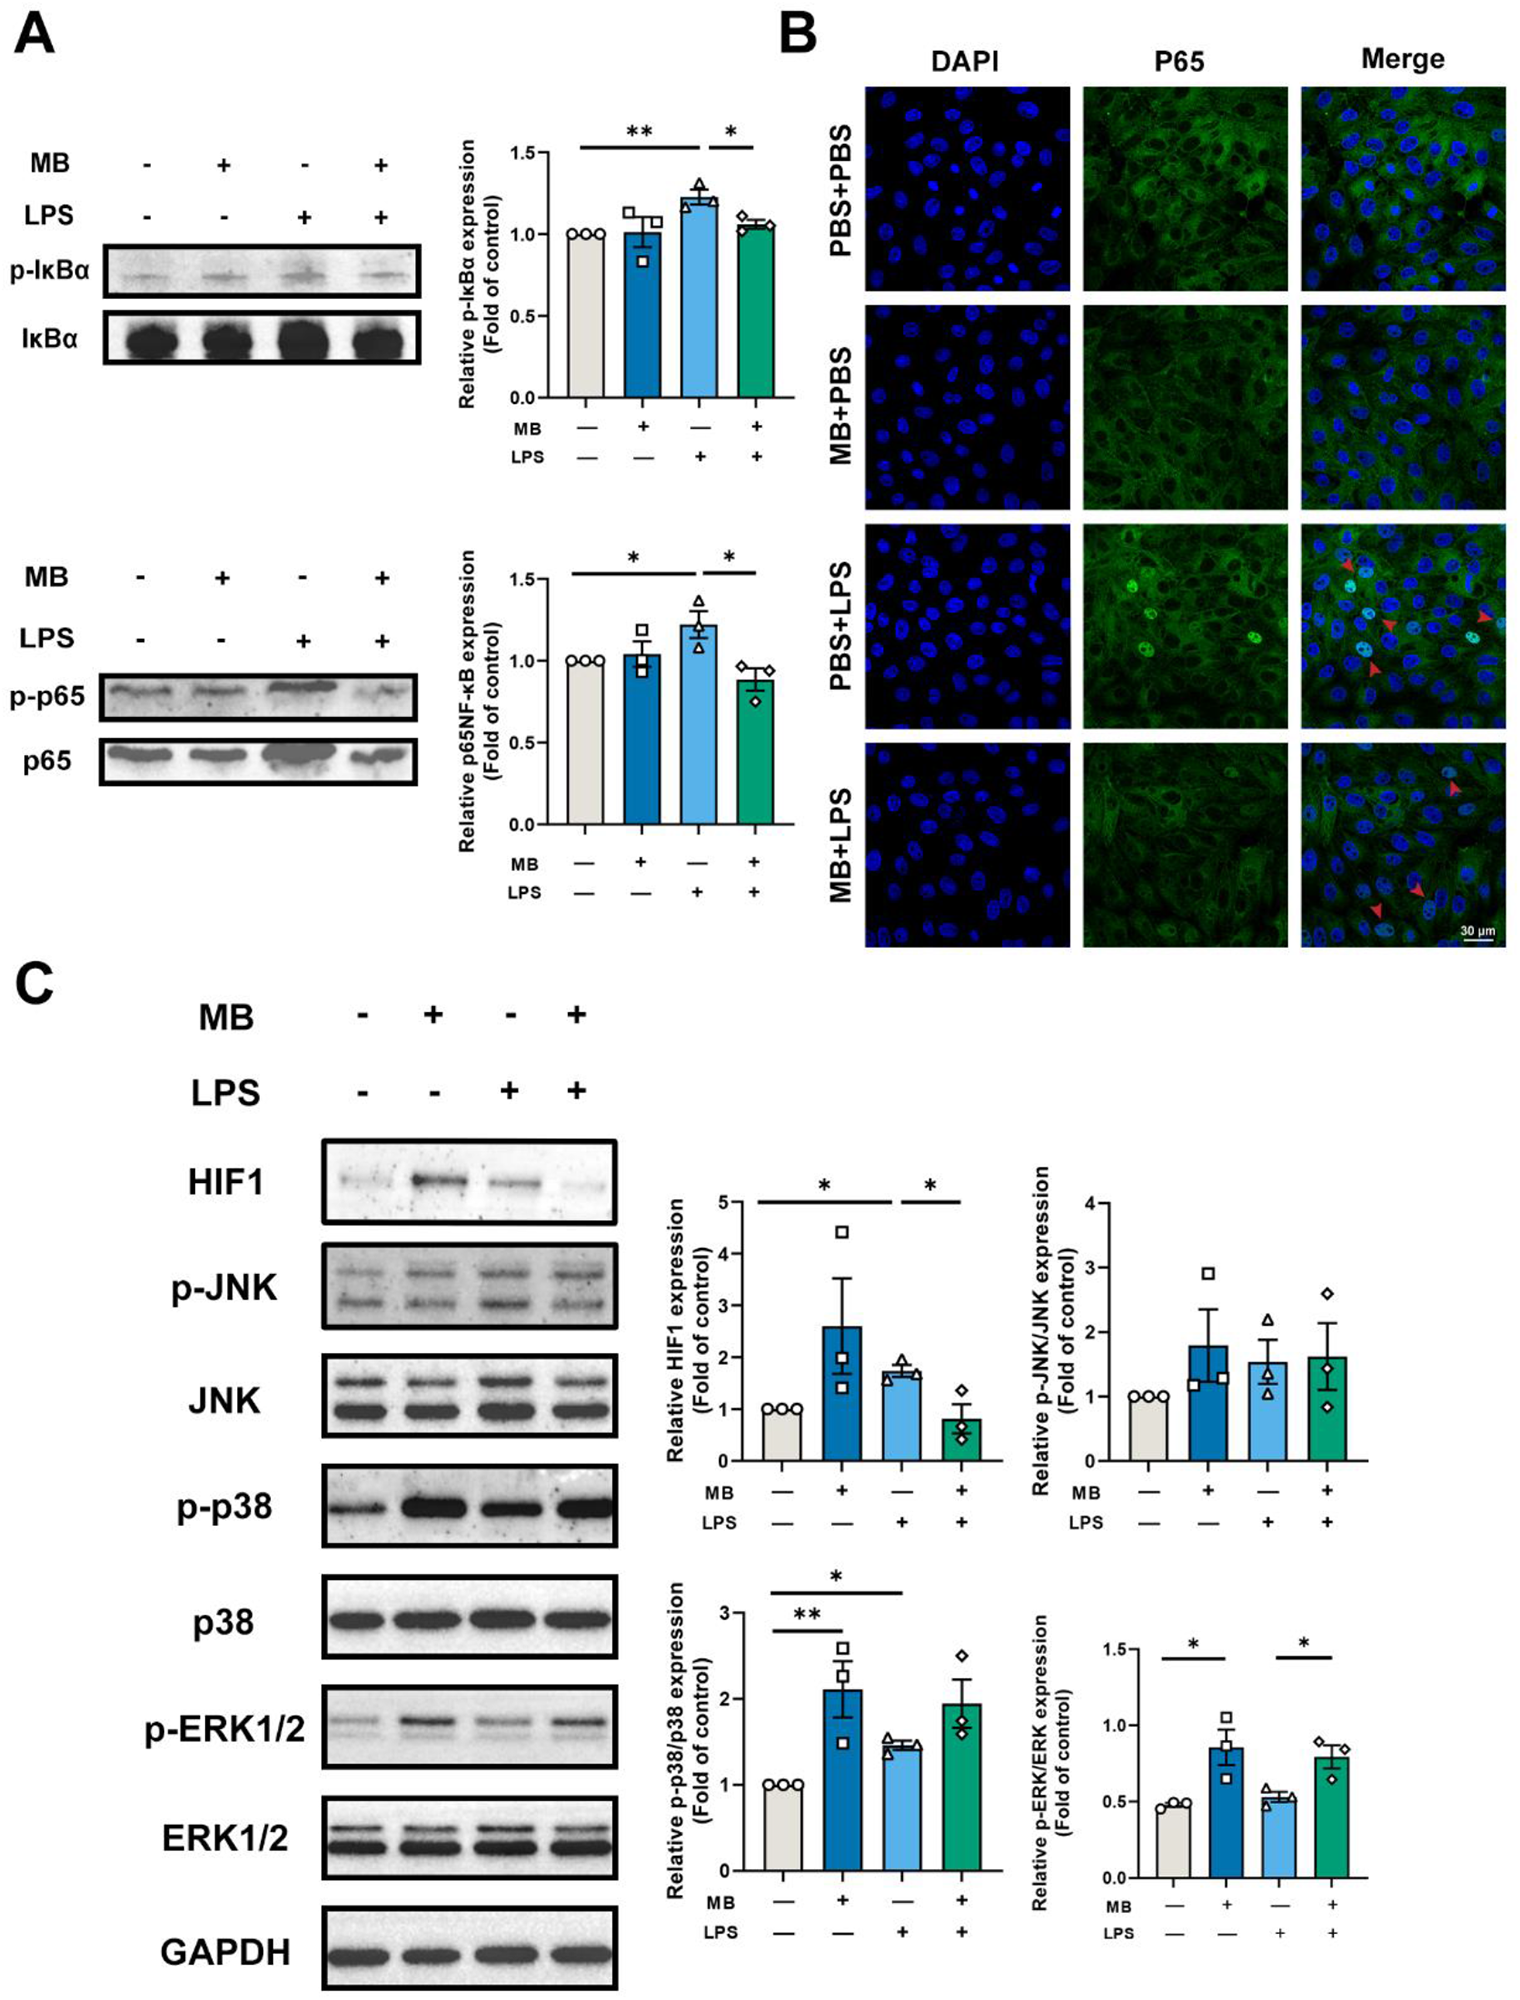
Figure 9. Verification of transcriptome results. (A) Western blot detection and band quantification results of phospho-inhibitor kappa B alpha (IκBα) and Phospho-NF-κB p65 (p-p65) expression in porcine small intestinal epithelial cell line (IPEC-J2) cells. (B) Expression and cellular localization of NF-κB p65 (p65) among various treatment groups (Scale: 30 μm, the red arrow points to the nucleus). (C) Western blot detection and band quantification results of hypoxia-inducible factor-1 (HIF1) and mitogen-activated protein kinase (MAPK) pathway in IPEC-J2 cells. “−” and “+” mean with and without corresponding treatments, respectively. Data were expressed as the mean ± SEM with eight independent replicates (n = 3). Phospho-c-Jun N-terminal kinase (p-JNK). c-Jun N-terminal kinase (JNK). Phospho-p38 mitogen-activated protein kinase (p-p38). P38 MAPK (p38). Phospho-extracellular signal-regulated kinase 1/2 (p-ERK1/2). Extracellular signal-regulated kinase 1/2 (Erk1/2). *P < 0.05 and **P < 0.01 compared to the control group.
Discussion
The intestinal barrier function encompasses the microbial, chemical, and intestinal epithelium physical barriers (Kayama et al. Reference Kayama, Okumura and Takeda2020). Among these, the brush border and tight junction structures in the intestinal epithelial primarily serve a physical barrier role, isolating harmful substances from penetrating through the cellular junctions to reach deeper tissues (Furuse Reference Furuse2010; Horowitz et al. Reference Horowitz, Chanez-Paredes and Haest2023; Odenwald and Turner Reference Odenwald and Turner2013, Reference Odenwald and Turner2017). Damage to the intestinal epithelial barrier often implies a greater likelihood of toxic and harmful substances entering the body, causing tissue damage and inflammation.
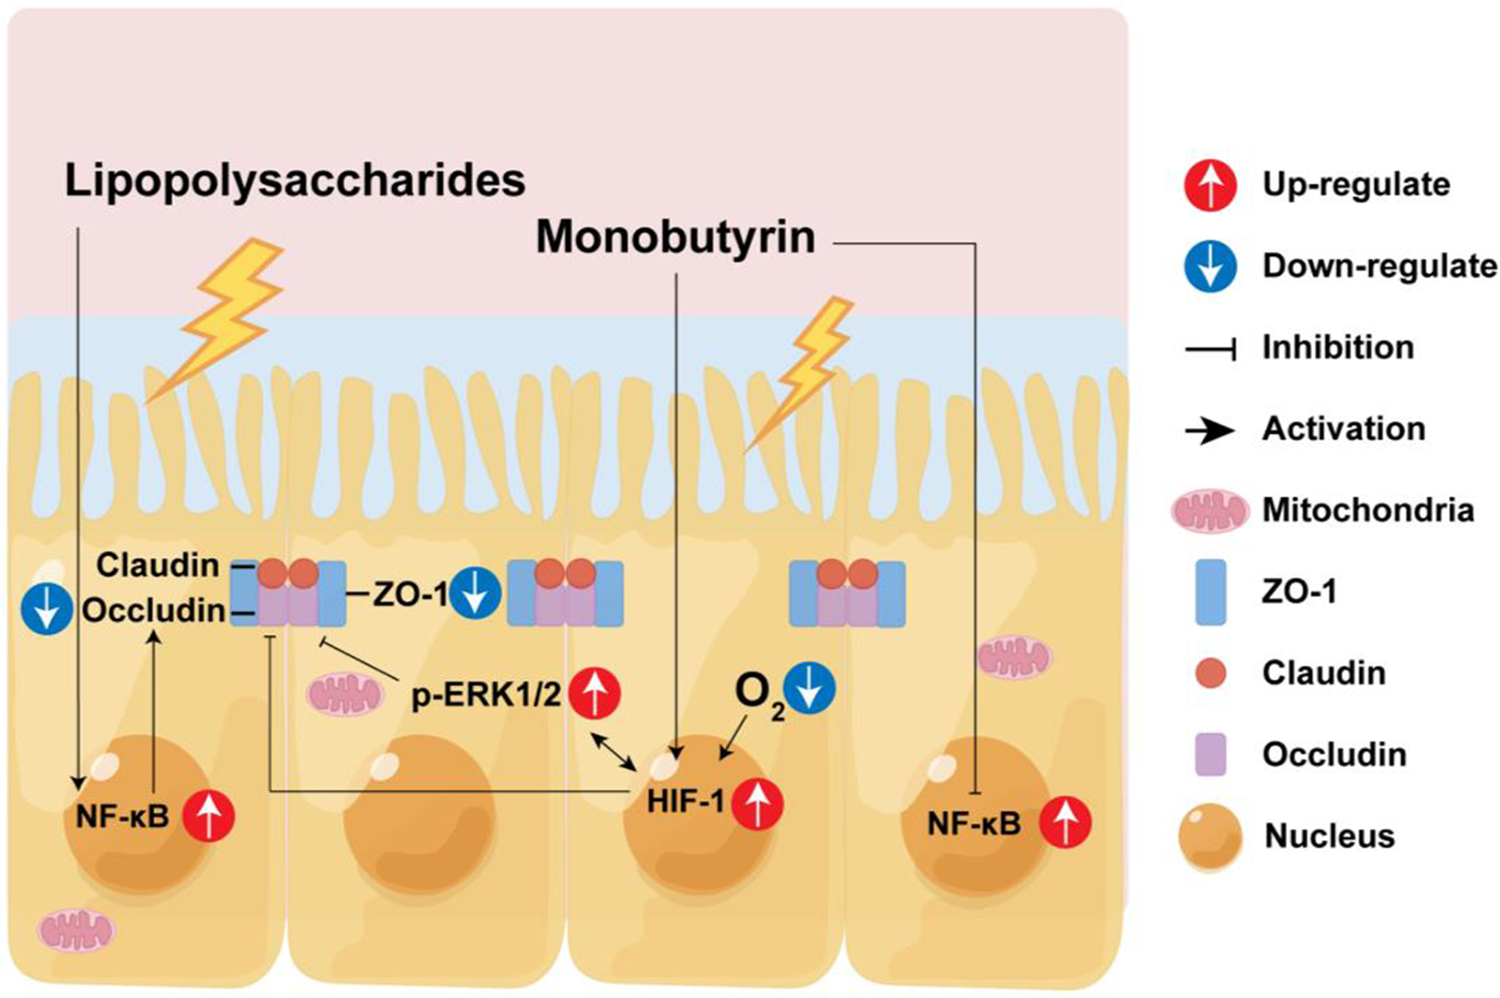
Therefore, enhancing the epithelial barrier function of the intestine, especially increasing its resistance to external pathogens or harmful substance stimulation, is particularly important. In this study, we initially discovered that MB treatment can enhance the tight junction function of the IPEC-J2 cells monolayer. Transcriptome sequencing showed that MB may induce cell hypoxia and activate the MAPK signaling pathway. Subsequently, we used LPS to construct a tight junction damage model of the IPEC-J2 cells. We found that MB pretreatment at a concentration of 4 mM could alleviate the tight junction damage caused by LPS stimulation.
The composition of tight junctions in intestinal epithelial cells is mainly composed of transmembrane proteins, peripheral membrane (scaffolding) proteins, and regulatory molecules, forming a multi-protein complex structure, among which the primary protein members include ZO-1, occludin, and claudins (Furuse et al. Reference Furuse, Hirase and Itoh1993, Reference Furuse, Fujita and Hiiragi1998; Gumbiner et al. Reference Gumbiner, Lowenkopf and Apatira1991; Stevenson et al. Reference Stevenson, Siliciano and Mooseker1986). In addition, the TEER of cells reflects the permeability of cells to substances and is an important indicator of the integrity of the cell barrier function (Harhaj and Antonetti Reference Harhaj and Antonetti2004). After treating with 4 mM MB for 12 h, the TEER of the IPEC-J2 cells monolayer was increased, and the expression of tight junction proteins ZO-1 and occludin was increased. This suggested that MB treatment might enhance the tight junction function of IPEC-J2 cells. Kovanda et al. reported that the TEER of IPEC-J2 cells also increased after MB treatment (Kovanda et al. Reference Kovanda, Hejna and Liu2020b). This is similar to the findings in our study.
From the anaerobic environment of the intestinal cavity, through the intestinal epithelium, to the highly vascularized subepithelial layer of the intestine, there is an oxygen gradient. The oxygen levels of the normal intestinal epithelial barrier are very low. This is also called physiological hypoxia (Furuta et al. Reference Furuta, Turner and Taylor2001). HIF1 is a signal molecule protein regulated by hypoxia. The absence of HIF1 will increase the susceptibility to intestinal inflammation, and the activation of HIF1 can maintain the intestinal barrier function (Karhausen et al. Reference Karhausen, Furuta and Tomaszewski2004; Robinson et al. Reference Robinson, Keely and Karhausen2008). In addition, the increase in intracellular calcium ion concentration caused by hypoxia can also activate ERK (Conrad et al. Reference Conrad, Freeman and Beitner-Johnson1999). The increasing ERK protein expression can increase occludin protein expression (Saha et al. Reference Saha, Ganapathy and Wang2022). Transcriptome results show that after MB treatment, the transcription level has upregulated DEGs related to hypoxia and may be accompanied by calcium ion inflow. western blot results also showed that MB treatment could increase the expression of HIF1 and p-ERK1/2 proteins in IPEC-J2 cells at the 8-h treatment. As the MB treatment time increased, the expression of occludin and ZO-1 proteins in IPEC-J2 gradually increased. Therefore, the upregulation of tight junction protein by MB may be because MB treatment reduces the intracellular oxygen level. Therefore, the activation of HIF1 and p-ERK1/2 led to increased tight junction protein expression in IPEC-J2 cells. Studies have shown that butyrate can maintain the stability of intestinal HIF molecules, thereby resisting the infection of Clostridium difficile (Fachi et al. Reference Fachi, Felipe and Pral2019). Butyrate can maintain the intestinal barrier function by regulating the inflow of calcium ions in cells (Miao et al. Reference Miao, Wu and Wang2016). This is similar to our research results.
On the basis that MB treatment could enhance the tight junction function of IPEC-J2. We used MB to pretreat cells, and then stimulated cells with LPS. In order to explore whether MB could protect cells stimulated by LPS on the premise of improving the intestinal barrier function. As shown in Figs. 6, 7 and 9. LPS stimulation caused damage to the cell mucin layer, cell microvilli, and tight junctions, and activated the NF-κB inflammatory signaling pathway. At the same time, MB pretreatment alleviated the damage to the cell mucin layer and microvilli caused by LPS stimulation and the activation of the inflammatory signaling pathway.
In addition to the mucin secreted by goblet cells, in the small intestine, the IPEC-J2 cells can secrete a substance called glycocalyx (Schierack et al. Reference Schierack, Nordhoff and Pollmann2006). It is a net-like structure of the carbohydrate part of glycolipids or glycoproteins, including transmembrane mucins, such as MUC1, MUC13, and MUC17. These transmembrane mucins can protect intestinal tissues from the invasion of intestinal bacterial pathogens (van Putten and Strijbis Reference van Putten and Strijbis2017). Inflammation of the intestine (such as ulcerative colitis) is one of the causes of thinning of the intestinal mucus layer (Gustafsson and Johansson Reference Gustafsson and Johansson2022). The specific mechanism of MB alleviating the damage of the mucin layer caused by LPS stimulation may be related to MB alleviating the activation of the inflammatory signaling pathway, but the specific mechanism needs further research.
Most digestion and absorption of nutrients mainly occur in the jejunum (Bornhorst and Paul Singh Reference Bornhorst and Paul Singh2014). The microvilli in intestinal epithelial cells increase the effective area of intestinal absorption (Schneeberger et al. Reference Schneeberger, Roth and Nieuwenhuis2018). In addition, the dense intestinal microvilli form a brush border, constituting an electrostatic barrier, reducing the contact between harmful bacteria and intestinal epithelial cells (Chen et al. Reference Chen, Chen and Chen2019). The inflammatory response will destroy the structure of the brush border (VanDussen et al. Reference VanDussen, Stojmirović and Li2018). MB and pretreatment alleviated the activation of the inflammatory signaling pathway NF-κB signaling pathway. MB alleviated the damage to the structure of cell microvilli caused by LPS stimulation, which might be related to alleviating the inflammatory response. In vitro experiments suggest that MB and butyric acid appear to have similar effects, both of which can maintain the tight junction function of IPEC-J2 cells and alleviate associated intestinal barrier injury(Dong et al. Reference Dong, Wang and Zhu2023; Li et al. Reference Li, Wang and Zhu2022). The primary difference lies in the regulatory pathways involved. However, in in vivo mice experiments, MB seems to display unique effects. Our latest study indicates that compared to sodium butyrate, MB has less intestinal stimulation in weaned mice and can enhance the development of immune cells in the small intestine of these mice (Wang et al. Reference Wang, Qiu and Zhou2024).
In summary, this evidence indicates that MB improves the intestinal epithelium barrier function to cope with the damage to intestinal epithelial cells caused by LPS stimulation. We cannot infer which signal pathways HIF1 and ERK1/2 are key. Because in addition to the hypoxia pathway regulating HIF1, many other signal pathways can also regulate HIF1, including PI3K/Akt, Wnt/β-catenin, Notch, MAPKs-ERK, and other signal pathways(Lau et al. Reference Lau, Klausen and Leung2011; Li et al. Reference Li, Xu and Wang2020; Liu et al. Reference Liu, Liu and Ding2015; Wan and Wu Reference Wan and Wu2016). In addition, downstream molecules activated by HIF1 (such as VEGF) may also feedback to activate the ERK pathway (Gupta et al. Reference Gupta, Kshirsagar and Li1999). This shows that there is complex physiological regulation and crosstalk between the HIF1 and ERK1/2 pathways, and perhaps subsequent experiments can be further improved. Conclusions can be made by using the corresponding gene knockout cell lines.
Conclusion
MB treatment can improve TJ function. MB pretreatment alleviates the activation of the NF-κB inflammatory signaling pathway, mucin barrier, microvilli, and tight junction function damage induced by LPS. The mechanism of MB alleviating epithelial barrier damage may be related to reducing the level of intracellular oxygen, and in this process, affects the expression of HIF1 and ERK1/2 proteins to increase the expression of tight junction protein. Consequently, MB makes the IPEC-J2 cells resist the tight junction function damage induced by LPS stimulation. Therefore, MB, as a dietary supplement and feed additive, has promising effects and prospects in maintaining the function of the intestinal epithelial barrier.
Data availability statement
The data used to support the findings of this study are available from the corresponding author upon request.
Acknowledgements
The authors thank the staff of the Electronic Microscopy Center and Laboratory Animal Center in Zhejiang University for their assistance in this study.
Author contributions
Haidong Wang wrote the original manuscript. Haidong Wang, Ji Qiu, and Minyao Zhou performed the experiments. Yanqiu Luo analyzed the data. Xinyu Li performed visualization and validation. Minqi Wang revised the experiment design and further revised the manuscript. All authors have read and agreed to the published version of the manuscript.
Financial support
This research was funded by Anji County Bamboo Industry Scientific and Technological Innovation Research and Development Project (202212) and the National Key Research and Development Program of China (2018YFE0112700).
Informed consent statement
Not applicable.
Conflicts of interest
The authors declare no conflicts of interest.


 Open access