


Introduction
Dry permafrost is ground that never warms above 0°C and has negligible ice content. Dry permafrost overlying ice-cemented ground is rare on Earth, but is widespread on Mars. In the polar regions of Mars, the dry permafrost layer begins at the surface and ice-cemented ground is found below it (Mellon & Jakosky Reference Mellon and Jakosky1993, Mellon et al. Reference Mellon, Arvidson, Sizemore, Searls, Blaney and Cull2009, Smith et al. Reference Smith, Tamppari, Arvidson, Bass, Blaney and Boynton2009). On Earth, dry permafrost over ice-cemented ground has been reported in the arid upland regions of the Antarctic Dry Valleys (Campbell & Claridge Reference Campbell and Claridge2006, Bockheim et al. Reference Bockheim, Campbell and McLeod2007). For example, in an early year-round monitoring study of dry permafrost at Linnaeus Terrace in Upper Wright Valley at an elevation of 1600–1650 m, McKay et al. (Reference McKay, Mellon and Friedmann1998) found that maximum soil temperatures exceeded 0°C to a depth of 12.5 cm, dry permafrost extended from that depth to 25 cm and ice-cemented soil was present below that level.
Motivated by the connection to Mars, as well as by the questions of the stability and age of the ground ice, there have been extensive studies of dry permafrost over ice-cemented ground in University Valley (77°52'S, 163°45'E; 1700 m a.s.l.), one of the upper valleys in the Quatermain Range in the Dry Valleys (e.g. Ugolini Reference Ugolini1964, Pringle et al. Reference Pringle, Dickinson, Trodahl and Pyne2003, Bockheim et al. Reference Bockheim, Campbell and McLeod2007, Vieira et al. Reference Vieira, Bockheim, Guglielmin, Balks, Andrey and Boelhouwers2008, McKay Reference McKay2009, Lacelle et al. Reference Lacelle, Davila, Pollard, Andersen, Heldmann and Marinova2011, Reference Lacelle, Davila, Fisher, Pollard, DeWitt and Heldmann2013, Reference Lacelle, Lapalme, Davila, Pollard, Marinova and Heldmann2016, Marinova et al. Reference Marinova, McKay, Pollard, Heldmann, Davila and Andersen2013, Heldmann et al. Reference Heldmann, Pollard, McKay, Marinova, Davila and Williams2013, Mellon et al. Reference Mellon, McKay and Heldmann2014, Lapalme et al. Reference Lapalme, Lacelle, Pollard, Fisher, Davila and McKay2017). Similarly, there have been many studies of dry permafrost over massive ground ice in Beacon Valley, located 300 m below University Valley (e.g. Sugden et al. Reference Sugden, Marchant, Potter, Souchez, Denton and Swisher III1995, Marchant et al. Reference Marchant, Lewis, Phillips, Moore, Souchez and Denton2002). Massive ground ice can form from buried glaciers or segregated ice. However, here we are focused on ice-cemented ground, in which the ice just fills the pore spaces of sandy soils. Other ice-free regions of Antarctica are also likely to contain dry permafrost over ice-cemented ground, although no detailed studies had been reported when we initiated this survey.
Here we report on a survey for these conditions in Ellsworth Land, Antarctica, thousands of kilometres distant from the Dry Valleys. Our results now follow the paper by Schaefer et al. (Reference Schaefer, Michel, Delpupo, Senra, Bremer and Bockheim2017) that reported thermal measurements in the ground near this site in Ellsworth Land that clearly indicate dry permafrost and ice-cemented ground. The Schaefer et al. (Reference Schaefer, Michel, Delpupo, Senra, Bremer and Bockheim2017) paper is the first detailed confirmation of the thermal state of dry permafrost outside of the Dry Valleys. Our results complement the Schaefer et al. (Reference Schaefer, Michel, Delpupo, Senra, Bremer and Bockheim2017) paper by including relative humidity (RH) as well as temperature measurements. We identify and characterize with year-round data a site with dry permafrost over ice-cemented ground. We present an initial analysis of this site and assess its possible habitability for microorganisms.
Methods
To assess for dry permafrost sites, a survey in the area was conducted in December 2016, recording summer air temperature, surface temperature and depth and temperature of the ice table. Note that we follow the convention of defining the year in Antarctica as beginning 1 December and summer as the months of December, January and February (e.g. Doran et al. Reference Doran, McKay, Clow, Dana, Fountain and Nylen2002, Andersen et al. Reference Andersen, McKay and Lagun2015). The depth to the ice table was determined by trenching. Temperatures were measured using a Signstek 6802 II Digital Thermometer with a K-type thermocouple probe.
The monitored site (79°49.213'S, 83°18.860'W, 718 m elevation) is located on the north flank of Mount Dolence in Ellsworth Land close to a large outcrop informally called Elephant Head, as shown in Fig. 1. The location was selected based on the survey described above and is within 10 m of one of the survey sites. It is expected that a deep ice table with summer temperatures below freezing can indicate dry permafrost over ice-cemented ground. Our site was selected independently but is only c. 1.5 km west of the sites studied by Schaefer et al. (Reference Schaefer, Michel, Delpupo, Senra, Bremer and Bockheim2017) and at approximately the same elevation (Fig. 1). Our site faces generally north; comparing the maximum summer soil temperatures (at 3.5 cm for our site and at 5 cm for the Schaefer et al. Reference Schaefer, Michel, Delpupo, Senra, Bremer and Bockheim2017 paper) suggests that the solar heating at the two sites is approximately equivalent. The geological setting is well described by Schaefer et al. (Reference Schaefer, Michel, Delpupo, Senra, Bremer and Bockheim2017); the soils are primarily derived from quartzites with occasional phyllites.
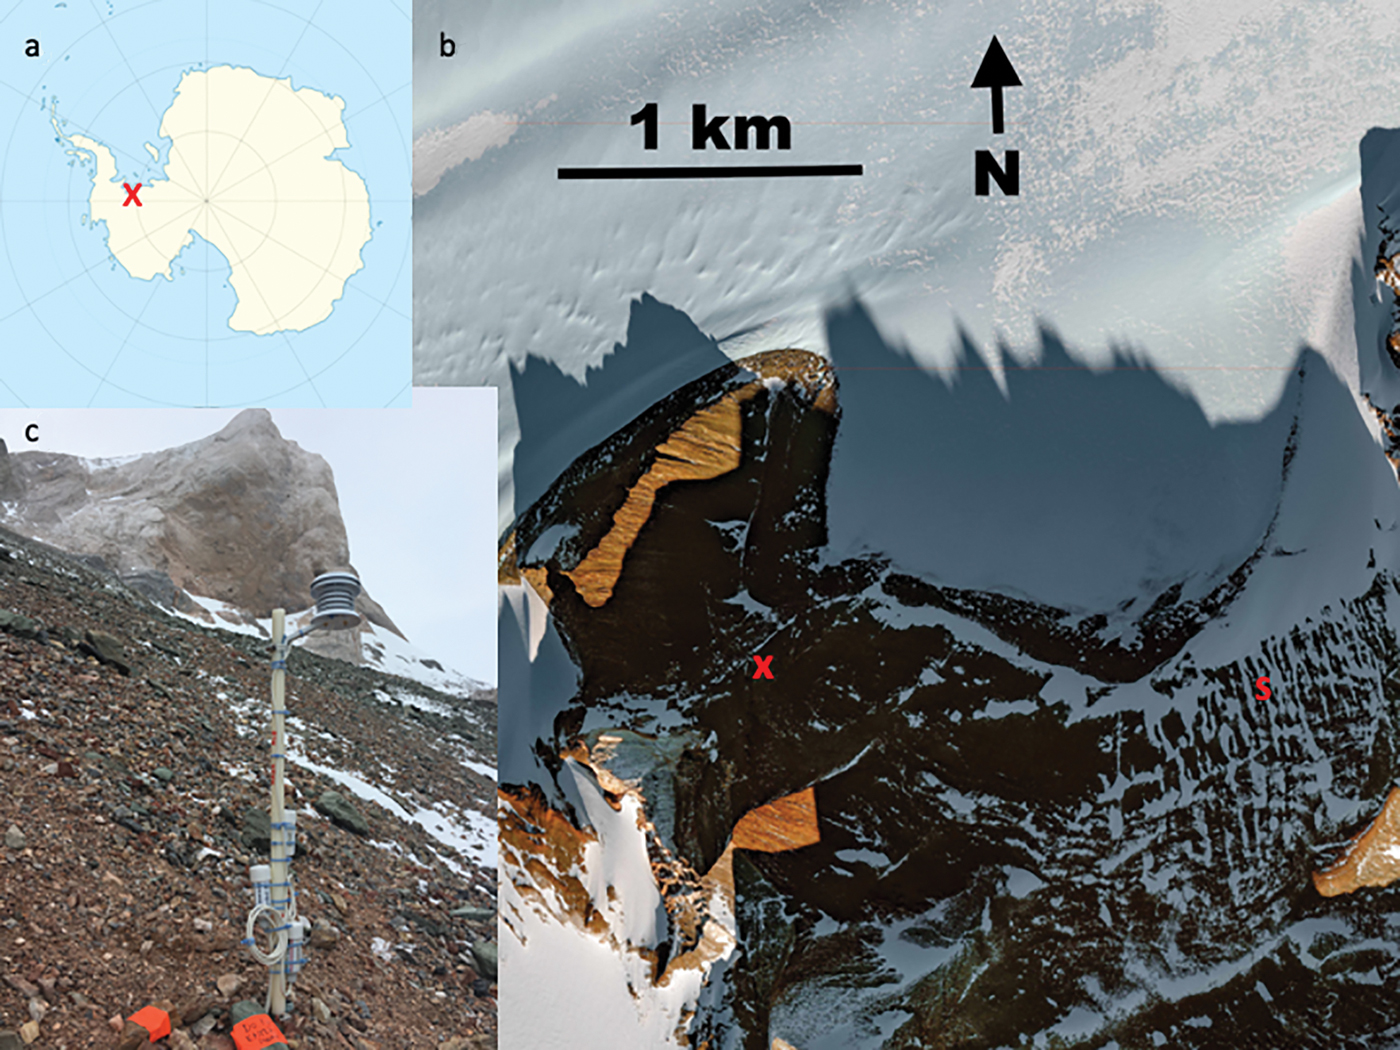
Fig. 1. a. Map, b. satellite image, and c. photograph of data station at the dry permafrost site overlying ice-cemented ground near Elephant Head, 79°49.213'S, 083°18.860'W, 718 m elevation. The site monitored for the year is marked on the map and the photograph with a red X. The site studied in Schaefer et al. (Reference Schaefer, Michel, Delpupo, Senra, Bremer and Bockheim2017), c. 1.5 km to the east, is marked with an S.
Three identical Onset U23 Pro v2 External Temperature/Relative Humidity data loggers were installed at this site that recorded temperature and RH hourly starting on 28 November 2017. The sensors were emplaced on site more than 24 hours before recording began. The combined air temperature and RH sensor was located 82 cm above the ground inside an Onset Solar Radiation Shield RS3-B. The subsurface sensors were placed at a depth of 3 cm in dry, loose material and at the top of the ice table at 49 cm depth. Data from the units were retrieved on 4 December 2018. The air and ice table units successfully recorded for the entire period, but the unit at 3 cm depth stopped recording on 18 March 2018. The complete raw data and the corrected values are given in the supplemental online material.
Error estimates for the temperature sensor are listed as ± 0.21°C from 0°C to 50°C and we assume the same for temperatures below 0°C. The resolution of temperature data is 0.02°C at 25°C. Drift is < 0.1°C per year. Because the temperature-sensing element is a 10 kΩ thermistor, we assume that the main source of error is due to systematic offsets and not random noise. Hence the error in average values is not significantly decreased with increased sample size. The accuracy of the RH sensor is typically stated as ± 2.5% in the 10–90% RH range and ± 5% below 10% or above 90% RH. The resolution of the sensor is 0.05% and its drift is < 1% per year.
Relative humidity sensors record humidity with respect to liquid water even for subfreezing temperatures. In addition, RH sensors often have offsets at high humidity and low temperature. The RH readings were corrected for these effects as described in the Appendix, using the following formula:
 $$RH_i = RH_w - 2 - 0.65T$$
where RH w is the RH with respect to water and is the reading from the sensor in percent, T is the temperature and RH i is the RH with respect to ice and is the corrected value. For determining the activity of water, a w, for use in habitability comparison, the direct reading from the sensors was used (a w = RH w). The water vapour density and the frost point were calculated from temperature and corrected RH values using the formulae in McKay (Reference McKay2009).
Results
The location, air temperature, ground ice temperature and ice depth data resulting from the survey are shown in Table I. The distance between sites was less than c. 1 km. The vicinity of Site #3 was selected for further monitoring because it had the deepest and coldest ice table. At Site #3, the air, surface and ice table temperatures were -4.5°C, +2.8°C and -4.8°C, respectively, and the ice table was 45 cm below the surface. The location for the long-term monitoring was within 10 m of Site #3.
Table I. Survey results from the Elephant Head area.
a The monitored site, 79°49.213'S, 83°18.860'W, is within 10 m of Site #3.
Our monitored site showed seasonal trends and weather patterns that are similar to those of the Dry Valleys (Figs 2 & 3). As expected, the variation in air temperature exceeded the variation in temperature at the ice table, 49 cm below the surface. Neither the temperature of the air nor the temperature of the ice table rose above 0°C. The temperature at 3 cm depth was warmer and more variable than the air temperature due to solar heating of the soil surface. The high atmospheric RH and attenuated diurnal temperature cycles showed that the loggers were emplaced during a period when clouds and snow were present. The moisture levels in the soil surface (red line in Fig. 3) remained high for a few days until clear atmospheric conditions resulted in higher soil temperatures and a gradual drying of the soil (evident by 11 December 2017 data points in Fig. 2). Similar cycles continued through the summer, notably at the end of December 2017 and the end of January 2018. The key statistics for the summer and yearly datasets (as well as the derived parameters of frost point and hours of habitability) are listed in Table II.
Fig. 2. Temperature of the air and the ice table over the climate year from 1 December 2017 to 30 November 2018.
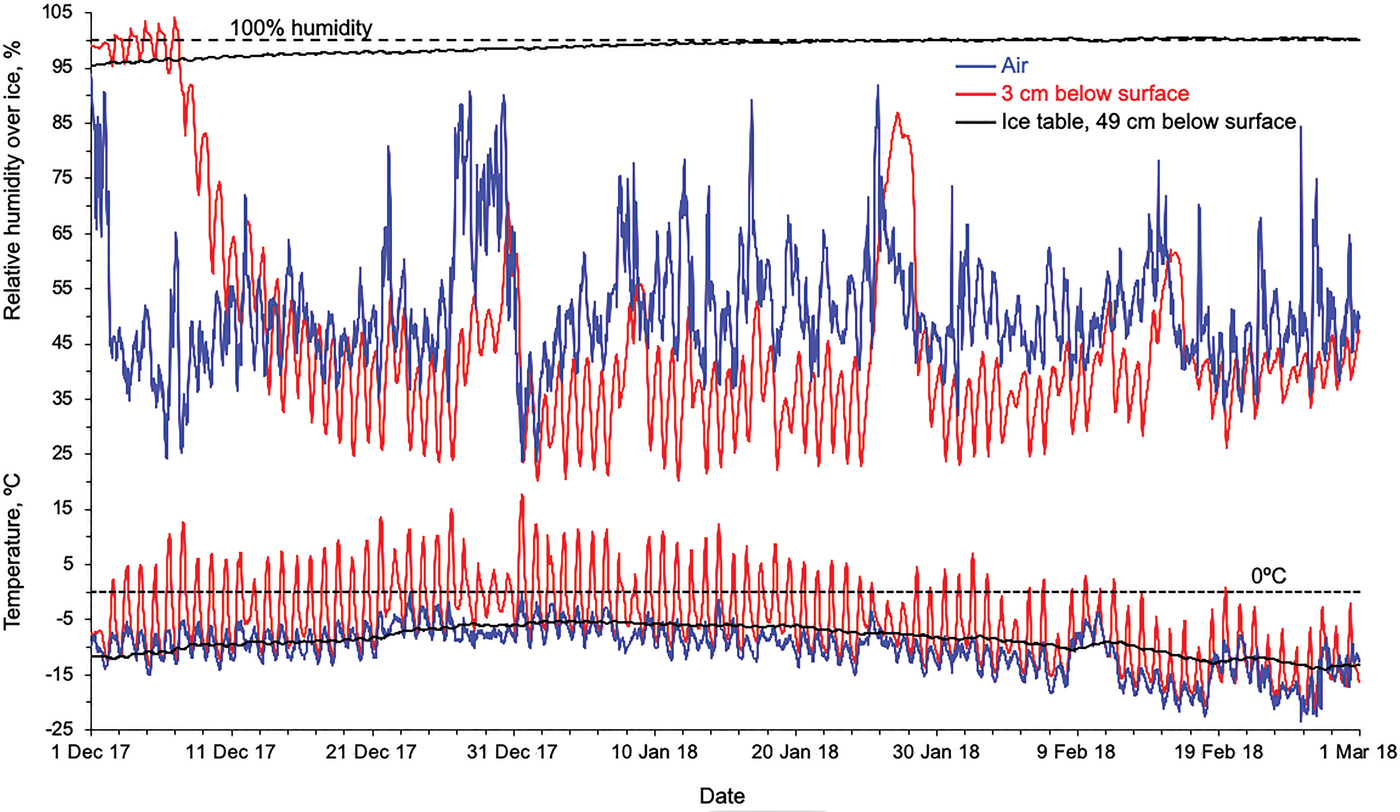
Fig. 3. Temperature and relative humidity corrected for ice for the summer months of December, January and February. Data shown include air, 3 cm below surface and the ice table located 49 cm below the surface. Temperature and relative humidity curves are presented on the same abscissa to show correlations with time.
Table II. Summary of temperature and moisture conditions at the monitored site.
The temperature error (± 0.21°C) combined with the RH error for the air (± 2.5%) imply an error in the air frost point of c. 1°C, dominated by the RH error. For the ice table, the RH i is set to 100% and the only error is in the temperature. Considering the entire year, the frost point in the air was -22.7 ± 1°C, and at the ice table it was -17.0 ± 0.2°C. This difference is larger than the error in these averages.
Discussion
We can estimate the depth to dry permafrost – the depth at which maximum summer temperatures are < 0°C - by interpolation between summer maximum temperatures at the ice table and at 3 cm depth. This gives a depth to permafrost of 13.5 cm. Thus, the region from 13.5 cm depth to 49 cm depth is dry permafrost overlying ice-cemented ground. We note that Schaefer et al. (Reference Schaefer, Michel, Delpupo, Senra, Bremer and Bockheim2017) determined the depth to permafrost at their site as c. 48 cm, which is considerably deeper than at our site. We do not use the term ‘active zone’, which is often used in studies of Arctic permafrost for describing the surface zone that melts in the summer with a lower boundary that is both the top of the permanently frozen ground and a change from liquid water to ice. In Antarctic dry permafrost locations, the top of the permanently frozen zone is not associated with any change in composition.
Compared to the conditions at Linnaeus Terrace (McKay et al. Reference McKay, Mellon and Friedmann1998), the ice table at the Elephant Head site is deeper (49 cm here compared to 25 cm at Linnaeus Terrace) and has a larger temperature difference in frost point between the ice and the atmosphere (5.7°C compared to 4°C at Linnaeus Terrace). To first order, these differences cancel each other out, and hence the vapour loss rate from the ice table at the two sites should be similar. McKay et al. (1989) report a net loss rate of 0.4–0.6 mm yr−1 of ice, computed using atmospheric conditions as the upper boundary. McKay et al. (1989) suggest that the ice is either decreasing with time or there is episodic recharging of the ice table.
However, as pointed out by Fisher et al. (Reference Fisher, Lacelle, Pollard, Davila and McKay2016), the relevant boundary condition for computing the flux of vapour from the ice table is the water vapour density at the surface of the soil, not the vapour density of the atmosphere. In general, the moisture at the soil surface exceeds that in the atmosphere, and thus the loss rate from the ice table computed using the water vapour density of the air as the upper boundary condition would give much higher flux than a calculation using the water vapour density of the soil surface. Williams et al. (Reference Williams, McKay and Heldmann2015) showed that this same effect occurs on Mars, with ground frost at the Viking 2 site enhancing the stability of the ice-cemented ground. The ratio of the average water vapour density at the surface divided by the average water vapour density in the atmosphere is the water vapour enhancement factor, and we can use the dataset to compute its value for the monitored site. As is shown in Table II, the average summer RH values at the 3 cm depth are lower than those of the air, but because the temperatures are higher, the average water vapour density at 3 cm is actually 1.5× higher than the water vapour density in the air. Because the water vapour density values are highest in the summer, this enhancement is likely to represent the year-round average.
The variation in the frost point that corresponds to an enhancement factor of the water vapour density of the air of between 1.0 and 1.7 is shown in Fig. 4. Over that range, the frost point increases from -22.7°C to -16.9°C, crossing the value of the ice table frost point (dotted line in Fig. 4). Given the uncertainties in the frost point and the fact that our data are from only one year, Fig. 4 shows that the Fisher et al. (Reference Fisher, Lacelle, Pollard, Davila and McKay2016) mechanism indicates that the ground ice at this site may be stable and in equilibrium with the water vapour density at the soil surface - this sets the depth to the ground ice. Note that in University Valley, Fisher et al. (Reference Fisher, Lacelle, Pollard, Davila and McKay2016) found that the observed enhancement factor of the water vapour density at the surface (compared to the air) of 1.7 would explain the ice table depth observed. In their calculation, this enhancement factor was due entirely to higher RH in the soil (85%) compared to the atmosphere (c. 50%). At Elephant Head, we find a similar value of the enhancement factor of the water vapour density at the surface compared to the air, but it is entirely due to a higher mean temperature, with little change in RH. As is shown in Fig. 4, if the enhancement factor was < 1.4, then the frost point of the upper boundary would be colder than the frost point of deep ice-cemented ground (c. -19°C) and there would not be an ice table, with dry permafrost extending to all depths. Conversely, if the enhancement factor was greater than c. 2.5, the ice table would be just at the depth where maximum temperatures exceed 0°C and there would be no dry permafrost layer. Thus, dry permafrost overlying ice-cemented ground occurs only over a specific range of surface moisture conditions.

Fig. 4. Frost point of the atmosphere as the average water vapour density is scaled by an enhancement factor. The frost point of the ice table is shown as a dotted line.
The data in Figs 2 and 3 would suggest that the water vapour density of the soil surface exceeds that of the atmosphere due to episodic snow (McKay Reference McKay2009) or frost (Williams et al. Reference Williams, Heldmann, McKay and Mellon2018). Snow on the ground is indicated in the data (Fig. 2) and images of the site (Fig. 1), but a systematic study of the effect of snow would require several years of observation, given the year-to-year variability in snow cover. The presence of hygroscopic salts (Williams et al. Reference Williams, Heldmann, McKay and Mellon2018) could also enhance surface moisture and would require analysis of the soil composition to test.
Temperature and moisture availability are key parameters in determining habitability in cold, dry environments. On Mars, Special Regions are locations that are considered potentially habitable, and they are defined (Rummel et al. Reference Rummel, Beaty, Jones, Bakermans, Barlow and Boston2014) as follows: ‘Special Regions on Mars continue to be best determined by locations where both of the parameters (without margins added) of temperature (above 255K) and water activity (a w > 0.60) are attained.’ Here the definition of habitability is in support of planetary protection and is justifiably conservative. Studies of metabolism in permafrost samples (Rivkina et al. Reference Rivkina, Friedmann, McKay and Gilichinsky2000) show that activity is high at -5°C, lower at -10°C and difficult to discern below that temperature. With respect to water activity, Palmer and Friedmann (Reference Palmer and Friedmann1990) report that, at + 8°C, Antarctic cryptoendolithic lichens begin to photosynthesize when the RH exceeds 70%. Extreme halophiles are active in saturated NaCl solutions, a w ≈ 0.75 (e.g. Kushner Reference Kushner and Ponnaperuma1981). Yeasts and fungi can be active for a w ≈ 0.6 (e.g. Kushner Reference Kushner and Ponnaperuma1981). Thus, we consider two cases in order to characterize the habitability of the dry permafrost and the ice table: a moderate case of T > −5°C and RH w (a w) > 0.8 and an extreme case of T > −10°C and RH w (a w) > 0.8.
As discussed in the Appendix, we take a w to be the direct RH w reading without the correction for ice and ignoring any sensor offsets. At the ice table, the water activity is always high, RH i = 1 and RH w (a w) varies from 0.85 to 0.95 (see Appendix). However, temperatures are low, never exceeding -5°C. There are 35 hours in the summer (1 December to 29 February) when T > −10°C and RH w (a w) > 0.8 at the ice table. In the dry soil at 3 cm depth, the temperatures are higher but the RH values are generally lower. However, there are 80 hours in the summer when T > −5°C and RH w (a w) > 0.8 and 165 hours when T > −10°C and RH w (a w) > 0.8. Thus, the ice table and the dry ground above it are potentially habitable and both would be considered ‘Special Regions’ on Mars. Further microbial investigations of this site would be of interest. These results are comparable to those of Goordial et al. (Reference Goordial, Davila, Lacelle, Pollard, Marinova and Greer2016), who found that in the dry permafrost in University Valley there were 74 hours per year when T > −15°C and RH w (a w) > 0.95.
Conclusion
We have measured year-round temperature and humidity in the air and at the ice table at a site in Ellsworth Land in Antarctica over 2000 km distant from the Dry Valleys. From these data we draw four conclusions. Firstly, dry permafrost over ice-cemented ground in Antarctica is not found only in the upper elevations of the Dry Valleys. It may be present in many locations in Antarctica. Secondly, a survey using summer measurements of the depth and temperature of deep ice tables can efficiently indicate locations of dry permafrost over ice-cemented ground. Thirdly, dry permafrost at the site meets the temperature and water activity requirements for habitability. Fourthly, the ice table at this site in Ellsworth Land could be stable despite the low atmospheric frost point due to a c. 50% enhancement factor of the water vapour density at the surface compared to the air. These results motivate a more systematic search for locations in Antarctica with dry permafrost over ice-cemented ground and a search for microbial activity within such sites.
Acknowledgements
We thank the two anonymous reviewers for extensive comments that greatly improved the paper. We acknowledge ongoing support for astrobiology research in Antarctica from the NASA Astrobiology Program. Funding for the data collection activities was also provided by the Intelligent Systems Division, Exploration Systems Directorate, NASA Ames Research Center. We also express our gratitude to the following individuals and organizations for the logistical, institutional and financial support of this research: Robert Swan (2041 Foundation); David Rootes, Martin Barnett and Sebastian Grau (Antarctic Logistics and Expeditions); David Alfano, Scott Poll, Sonie Lau, Rupak Biswas, William Van Dalsem, Jacob Cohen, Steven Zornetzer and Thomas Berndt (NASA Ames Research Center).
Author contributions
CPM proposed the investigation. EB conducted the initial survey and implemented the logistics. All authors contributed to the writing. Fieldwork was conducted by EB, SA and NL.
Supplemental data
The raw data used in this manuscript are freely available as supplemental online material at https://doi.org/10.1017/S0954102019000269.
Appendix: Humidity calibration
The Onset U23 (as well as any absorption-based RH sensors) records the RH with respect to liquid water even for temperatures < 0°C (Anderson Reference Anderson1995, Koop Reference Koop2002). The physical meaning of the vapour pressure of liquid water for temperatures < 0°C is clear from saturated salt solutions in contact with ice. For absorption-based sensors, the state of the water molecule (once absorbed into the sensor) is not structured as in ice crystals but is more similar to the disordered state of liquid, like in a salt solution. Thus, it is plausible that, thermodynamically, the absorbed water molecules are more like molecules in liquid water than molecules in ice.
This correction of RH data for low temperatures is well known and has been incorporated in the Antarctic meteorology literature (Doran et al. Reference Doran, McKay, Clow, Dana, Fountain and Nylen2002, Hagedorn et al. Reference Hagedorn, Sletten and Hallet2007, Andersen et al. Reference Andersen, McKay and Lagun2015, Liu et al. Reference Liu, Sletten, Hagedorn, Hallet, McKay and Stone2015). It is usually achieved by multiplying RH output for temperatures below freezing by the ratio of the vapour pressure over ice and the vapour pressure over super-cooled water, determined from tables and fit to a polynomial over the range of 0–60°C (e.g. eq. (1) in Andersen et al. Reference Andersen, McKay and Lagun2015 or appendix A of Hagedorn et al. Reference Hagedorn, Sletten and Hallet2007).
In addition, previous experience with RH sensors suggests that, at low temperatures and high humidities, the sensors read slightly high. This is most obvious when readings exceed 100%, and it has been dealt with by clipping the upper values at 100%.
The ice–dirt mixture at the ice table is not a solution, so the activity of the ice should be unity. Thus, the sensor placed in contact with the ice table should read 100% humidity with respect to ice. The readings from this sensor over the entire dataset are shown in Fig. 5, with RH plotted versus temperature. The data show two clear trends. First, there is a small set of data points that have lower values of RH than the rest. Second, the majority of the data points lie along a clear line of RH versus temperature, well below the expected value of 100%. Two lines are shown in Fig. 5. The upper dotted line is a fit to the bulk of the data: RH i = RH w – 2 – 0.65T. The lower dash–dot line is eq. (1) from Andersen et al. (Reference Andersen, McKay and Lagun2015) for the correction of RH values for subfreezing temperatures, based on data for the vapour pressure of water and the vapour pressure of ice. Most previous work has used this correction based on vapour pressure ratios. However, since we know that the expected RH value with respect to ice is 100%, then the vapour pressure correction is several percentage points off. The empirical correction, shown by the dotted line, produces uniform values for the RH i of close to 100% and predicts an offset of two percentage points at 0°C. We use this correction throughout the dataset to compensate for both any instrumental offset and the physical effects of the sensor reading. Thus, for all calculations of vapour pressure and frost point we use RH i = RH w – 2 – 0.65T.
Fig. 5. Raw values of relative humidity data plotted versus temperature for the ice table. The dotted line is a fit to the data RH i = RH w – 2 – 0.65T. The lower dash–dot line is eq. (1) from Andersen et al. (Reference Andersen, McKay and Lagun2015) for the correction of relative humidity values for subfreezing temperatures.
Figure 6 shows the time course of the corrected data. As expected, most of the points lie close to 100%. However, there is a clear adjustment period immediately after the sensor is put in place. This is certainly due to the disturbance required to place the sensor. The moist soil is slightly dehydrated and takes some time to re-equilibrate with the ice. Complete equilibration takes almost a month. However, after a few days, the difference is small and has no effect on the calculations, which begin 1 December, 3 days after sensor emplacement (e.g. Fig. 3).
Fig. 6. Relative humidity corrected for ice over time for the ice table.
For habitability calculations, the value of interest is the activity of liquid water, not the activity of water ice (even for subfreezing temperatures). The activity of liquid water is equal to the RH with respect to liquid water and the activity of ice is equal to the RH with respect to ice. They are only equal at the melting point of ice. Thus, for habitability calculations we use the measured RH w directly, neglecting any small offset.


 Open access