


Introduction
Sealers first set foot on Antarctica a little over 200 years ago, and, since then, humans have explored large areas of the continent and established an increasing number of research stations at coastal and inland locations (COMNAP 2017, Pertierra et al. Reference Pertierra, Hughes, Vega and Olalla-Tárraga2017, Brooks et al. Reference Brooks, Jabour, Van Den Hoff and Bergstrom2019, Leihy et al. Reference Leihy, Coetzee, Morgan, Raymond, Shaw and Terauds2020). Over the past 3 decades, the Antarctic tourism industry has expanded rapidly, with over 122 000 tourists visiting Antarctic during the 2023/2024 summer season (IAATO 2024). Human activity has led to environmental impacts including the introduction of non-native species, wildlife disturbance and displacement, habitat destruction and pollution of marine and terrestrial environments (Tin et al. Reference Tin, Fleming, Hughes, Ainley, Convey and Moreno2009, Aronson et al. Reference Aronson, Thatje, McClintock and Hughes2011, Hughes et al. Reference Hughes, Pescott, Peyton, Adriaens, Cottier-Cook and Key2020, Hwengwere et al. Reference Hwengwere, Paramel Nair, Hughes, Peck, Clark and Walker2022).
In recent years, the issue of plastic pollution in Antarctica and the Southern Ocean has become increasingly prominent, with many studies quantifying such plastic pollution and its associated negative environmental impacts (Barnes & Milner Reference Barnes and Milner2005, Barnes et al. Reference Barnes, Galgani, Thompson and Barlaz2009, Waller et al. Reference Waller, Griffiths, Waluda, Thorpe, Loaiza and Moreno2017, Lacerda et al. Reference Lacerda, Rodrigues, Van Sebille, Rodrigues, Ribeiro and Secchi2019, Waluda et al. Reference Waluda, Staniland, Dunn, Thorpe, Grilly, Whitelaw and Hughes2020, Caruso et al. Reference Caruso, Bergami, Singh and Corsi2022). Microplastics (fragments or fibres < 5 mm) have been detected in deep ocean sediments (Barrett et al. Reference Barrett, Chase, Zhang, Holl, Willis and Williams2020), surface waters (Isobe et al. Reference Isobe, Uchiyama-Matsumoto, Uchida and Tokai2017, Zhang et al. Reference Zhang, Zhang, Ju, Qu, Chu, Huo and Wang2022), glaciers (González-Pleiter et al. Reference González-Pleiter, Lacerot, Edo, Pablo Lozoya, Leganés and Fernández-Piñas2021) and snow (Aves et al. Reference Aves, Revell, Gaw, Ruffell, Schuddeboom and Wotherspoon2022). Plastics can have a wide range of impacts depending upon their chemical composition, buoyancy, fragment shape and size and the environment into which they are released and/or transported (MacLeod et al. Reference MacLeod, Arp, Tekman and Jahnke2021). Macroplastics (fragments ranging in size from 5 mm to several metres across) may negatively impact wilderness and aesthetic values (Finger et al. Reference Finger, Corá, Convey, Santa Cruz, Petry and Krüger2021), cause entanglement of marine wildlife (e.g. seals and penguins; Waluda & Staniland Reference Waluda and Staniland2013) or act as a vector capable of transporting adhered non-native species across the Polar Front (Barnes & Milner Reference Barnes and Milner2005). Analyses have documented potentially toxic concentrations of chemicals including persistent organic compounds on macroplastics, microplastics and nanoplastics (particles < 1 μm/1000 nm across; Rios et al. Reference Rios, Jones, Moore and Narayan2010, Okoye et al. Reference Okoye, Addey, Oderinde, Okoro, Uwamungu and Ikechukwu2022). Microplastic fibres have been found throughout the food chain in secondary consumers such as Antarctic krill (Euphausia superba) and salps (Salpa thompsoni; Wilkie Johnston et al. Reference Wilkie Johnston, Bergami, Rowlands and Manno2023, Lv et al. Reference Lv, Feng, Cai, Zhang, Jiang and Liao2024), and experiments exposing E. superba to nanoplastics show impeded krill embryonic development (Rowlands et al. Reference Rowlands, Galloway, Cole, Lewis, Peck, Thorpe and Manno2021). Microplastics in the pelagic food web result in bioaccumulation at higher trophic levels. The presence of microplastics has been documented in the gills and intestines of 15 species of Antarctic fish (Lv et al. Reference Lv, Feng, Cai, Zhang, Jiang and Liao2024). Apex predators are subject to the inhalation and deposition of microplastics, with recent work providing evidence of microfibres and microplastics in the tracheas and lungs of Adélie penguins (Bhattacharjee et al. Reference Bhattacharjee, Rathore, Naik, Saha, Tudu and Dastidar2024).
Sources of plastic pollution within Antarctica
Although plastic pollution may be transported across the Polar Front into the Southern Ocean from other parts of the world (and vice versa), several sources of plastic pollution have been identified within the Antarctic Treaty area (the areas south of latitude 60°S). Plastic boxes, buoys and fishing gear are commonly lost from fishing vessels operating in the Southern Ocean (Waluda et al. Reference Waluda, Staniland, Dunn, Thorpe, Grilly, Whitelaw and Hughes2020), and vessels can legally release sewage and grey water, potentially containing plastic particles, into the ocean more than 12 nautical miles from the coast (see Annex IV ‘Prevention of Marine Pollution’ to the Protocol on Environmental Protection to the Antarctic Treaty; ATS 2024). Currently, 31 countries operate permanent research infrastructure within the Antarctic Treaty area, which includes ~80 research stations that operate during the summer months or year round (COMNAP 2017). Plastic pollution that originates from these stations may include lost equipment and packaging material (Hughes et al. Reference Hughes, Boyle, Morley-Hurst, Gerrish, Colwell and Convey2023b) or the release of microplastics in wastewater systems, including microbeads in personal care products and microfibres that are shed during clothes washing (Waller et al. Reference Waller, Griffiths, Waluda, Thorpe, Loaiza and Moreno2017, Reed et al. Reference Reed, Clark, Thompson and Hughes2018). Although it is estimated that 69% of Antarctic research stations undertake some form of wastewater treatment, it is not known how efficient these systems are at removing microplastics, resulting in an unknown level of plastic pollution from wastewater across the continent (COMNAP 2022).
In areas of permanent ice and snow in Antarctica, the typically flat, monochrome and featureless landscape is often subject to poor visibility due to blowing snow. Navigation and orientation at scales of only a few metres pose substantial challenges. As a cost-effective solution, polyester flags mounted on bamboo poles are routinely used by many national Antarctic programmes and tourism operators as visual markers to indicate safe travel routes through, for example, crevassed terrain or unsafe sea ice and/or the location of scientific equipment and depots that may become buried to a depth of several metres due to snow accumulation. As a result of high wind speeds, ultraviolet (UV) radiation damage and abrasion from blowing snow, the structural integrity of the flag material can be rapidly reduced, resulting in flag degradation and the release of plastic fragments and microfibres into the Antarctic environment. Flags deployed at some locations may be replaced up to three times in a year because of rapid material degradation (N. Frontier, personal observation 2021).
International discussions and agreements concerning plastic pollution in Antarctica
The governance of the Antarctic is through the Antarctic Treaty System, with consensus-based decision-making undertaken by the 29 Consultative Parties to the Antarctic Treaty during the now annual Antarctic Treaty Consultative Meeting (ATCM; Hughes et al. Reference Hughes, Lowther, Gilbert, Waluda and Lee2023a). Under Annex III ‘Waste Disposal and Waste Management’ to the Protocol on Environmental Protection to the Antarctic Treaty (signed 1991, entered into force 1998; hereafter ‘the Protocol’), all waste, including plastics, must be either removed from the Antarctic or incinerated (ATS 2024). The only exception to this is the release of sewage waste, with mandatory treatment limited to maceration once research station numbers exceed 30 individuals. Annex I ‘Environmental Impact Assessment’ to the Protocol states that Parties must undertake an environmental impact assessment for all activities undertaken within the Antarctic Treaty area to ensure that steps are taken to minimize or mitigate any associated impacts, including activities that could cause environmental pollution.
Through Resolution 5 (2019) ‘Reducing Plastic Pollution in Antarctica and the Southern Ocean’ (https://www.ats.aq/devAS/Meetings/Measure/705), Parties agreed to encourage the elimination of personal care products containing microplastic beads in the Antarctic Treaty area, to share information on methods that should be implemented to reduce microplastic release from wastewater systems and to support greater monitoring of plastic pollution in Antarctica, particularly near areas of human activity. In parallel, the Environmental Protection Expert Group of the Council of Managers of National Antarctic Programs (COMNAP) provided advice to its members concerning the reduction of plastic pollution in Antarctica, including recommending the use of microplastic filters on research station washing machines and the prohibition of personal care products containing microplastics (https://www.comnap.aq/environmental-protection). However, the Expert Group also acknowledged the need for research to identify cost-effective responses to reduce plastics of all types entering the Antarctic environment. In an unpublished internal report for COMNAP Members, the Expert Group specifically identified plastic pollution from marker flags as an issue that required further research (A. Malaos, personal communication 2022).
Rothera Research Station is located on Adelaide Island, western Antarctica Peninsula, and it has been occupied continuously by the UK national Antarctic operator, the British Antarctic Survey (BAS), since 1976. Through the station environmental management system (EMS), steps are taken to minimize environmental impacts, including pollution, and a range of monitoring activities have been undertaken to ensure management activities are effective (e.g. Hughes et al. Reference Hughes, Bridge and Clark2007, Reference Hughes, Boyle, Morley-Hurst, Gerrish, Colwell and Convey2023b, Phillips et al. Reference Phillips, Silk, Massey and Hughes2019, Webb et al. Reference Webb, Hughes, Grand, Lohan and Peck2020, Robinson et al. Reference Robinson, Hughes, Seaton and Morley2024). Although efforts have been made to quantify plastic pollution levels in the marine environment near the station sewage outfall and further afield (Reed et al. Reference Reed, Clark, Thompson and Hughes2018), there is little understanding of the quantities of plastic fragments released into the environment by the ~1000 flags deployed by BAS each season. Acknowledging the call by the ATCM and COMNAP for further research into practical solutions to minimize plastic pollution in the Antarctic environment, this study aimed to quantify the degree of polyester flag degradation and the associated level of plastic input into the Antarctic environment and to investigate potential alternative flag materials and designs that might be more sustainable and less polluting.
Methods
Measurement of environmental conditions
Wind
Wind data were collected from the automatic weather station (AWS) located adjacent to the experimental site (67°31’57 S, 68°11’36 W; Fig. 1). The AWS undergoes yearly calibration and servicing by the BAS meteorological team and is composed of various instruments, including temperature, pressure and wind sensors. The wind data were collected using a RM Young Propvane that logged data onto a Campbell Scientific CR1000 data logger that was programmed to store 1 and 10 min average wind data. The Propvane was damaged in June 2023 because of high winds and, due to logistical barriers, was not replaced until August 2023. Therefore, no wind data were collected during this period. To represent the missing wind data, proxy wind speeds were averaged over the previous 5 years. Wind speed data for the local area were calculated from 10 min averaged data collected from 3 hourly observations at the Rothera Skiway AWS (Fig. 1).
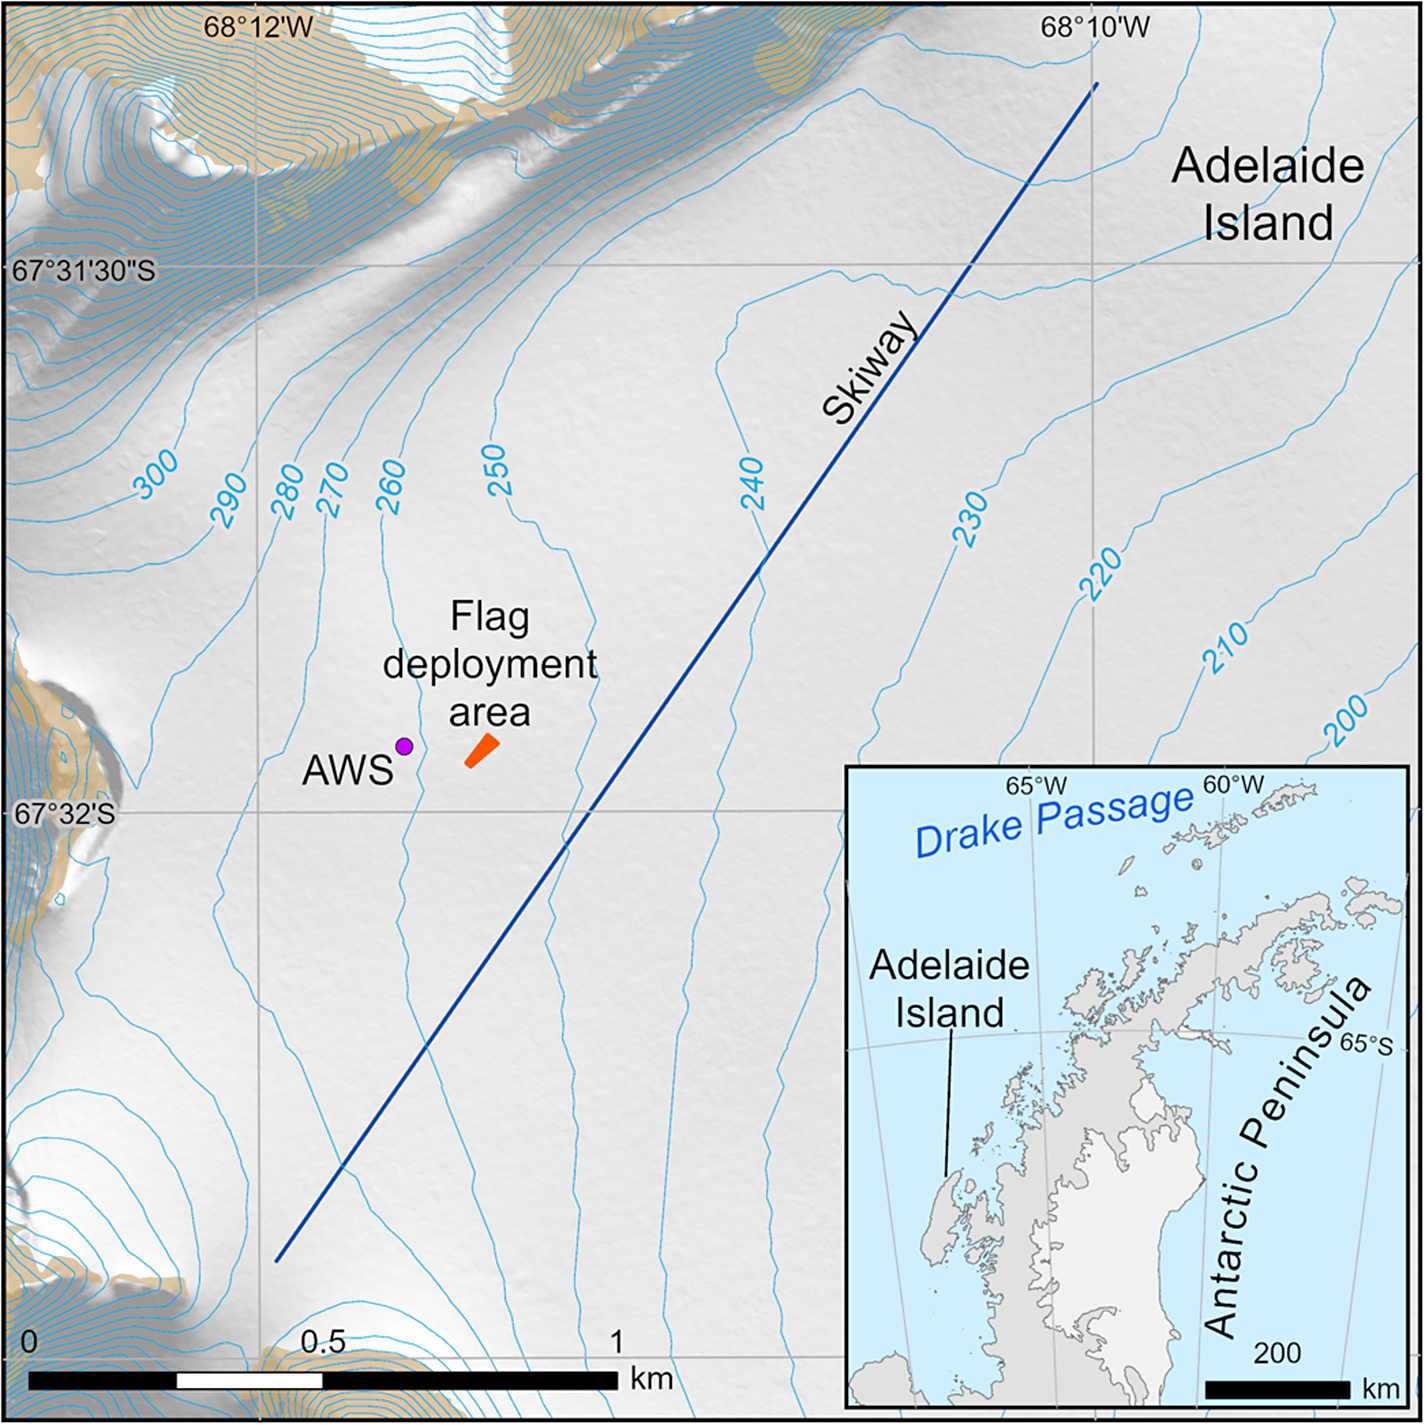
Figure 1. Map of the flag deployment area, automated weather station (AWS) and Rothera Research Station Skiway.
Ultraviolet radiation
Radiation measurements at Rothera Research Station were taken using a double monochromator spectroradiometer (DM150, Bentham Instruments, Reading, UK) with a scan range of 280–600 nm (step 0.5 nm) situated on the Bonner Laboratory roof. The radiometer was calibrated to a 1 kW quartz–halogen lamp traceable to a National Institute of Standards and Technology standard. UV radiation data were synthesized across a 15 year period from 1997 to 2012. Although these data fall outside the current study period, they were the only calibrated UV data available providing representative UV values at Rothera Research Station. Daily maximum UV radiation values were obtained and presented as a time series to account for cloudy days when readings would be lower (P. Geissler, personal communication 2024).
Temperature
Temperature data were obtained from the Rothera Skiway AWS using a platinum resistance thermometer housed in a radiation shield. The data are presented as a monthly time series, also using 10 min averaged data from 3 hourly observations at the AWS (automated surface synoptic observations (SYNOPs)).
Flag preparation
Four flag types were selected for investigation (see Table I & Fig. S1). Standard flags (38 cm × 50 cm), made from unhemmed polyester, were obtained from House of Flags (Cambridge, UK). These flags have been extensively used in Antarctica for several decades by BAS. To assess the effectiveness of hemming at reducing the degradation of these polyester flags, a further set of standard flags, with a 10 mm hem around the flag edge, were prepared using a sewing machine. Two other flag materials were selected to test whether they would provide more sustainable and less polluting alternatives to polyester (i.e. more durable and biodegradable). Ventile ${}^\circledR $
is a premium-quality tight-weave cotton fabric commonly used for Antarctic field equipment, most notably pyramid tents (also known as Scott tents) that can be deployed for months at a time and withstand high winds, low temperatures and high UV intensities for multiple summer seasons. Heavy cotton canvas is regularly used at Rothera Research Station in tarpaulins for snowmobiles, can withstand multiple years of exposure to polar conditions and is a cheaper but heavier alternative to Ventile
${}^\circledR $
is a premium-quality tight-weave cotton fabric commonly used for Antarctic field equipment, most notably pyramid tents (also known as Scott tents) that can be deployed for months at a time and withstand high winds, low temperatures and high UV intensities for multiple summer seasons. Heavy cotton canvas is regularly used at Rothera Research Station in tarpaulins for snowmobiles, can withstand multiple years of exposure to polar conditions and is a cheaper but heavier alternative to Ventile ${}^\circledR $
. Ventile
${}^\circledR $
. Ventile ${}^\circledR $
and canvas flags were double hemmed, sewn together using standard polyester thread and made to the standard dimensions. Flags were sewn with a single side pocket and two pieces of webbing for attaching the flag to a bamboo pole. Mean bamboo pole weight was further calculated based on weights of a subsample of eight randomly selected poles. Prior to deployment, each flag was assigned a unique identification number that was marked on the flag surface, and then each flag was then weighed (using a Sartorius LP4200, Sartorius AG, Germany) alongside the associated webbing.
${}^\circledR $
and canvas flags were double hemmed, sewn together using standard polyester thread and made to the standard dimensions. Flags were sewn with a single side pocket and two pieces of webbing for attaching the flag to a bamboo pole. Mean bamboo pole weight was further calculated based on weights of a subsample of eight randomly selected poles. Prior to deployment, each flag was assigned a unique identification number that was marked on the flag surface, and then each flag was then weighed (using a Sartorius LP4200, Sartorius AG, Germany) alongside the associated webbing.
Table I. Flag types used in the current trial.
a Exclusively material price, excludes labour.
b 100% organic cotton. Includes a coating of the PFC-free product ‘Durable Water Repellency’.
Flag deployment
A total of 76 flags (19 of each type) were deployed on flat glaciated terrain on 6 February 2023, ~5 km from Rothera Research Station, in an area with representative polar conditions, including catabatic winds from the surrounding mountains (Fig. 1). The flags were deployed ~5 m apart, in two lines orientated approximately east-west. To minimize the potential impact of variable mean wind speeds across the experimental site caused by local topography, individual flags were deployed across the flag lines in alternating order: polyester (hemmed), canvas, Ventile ${}^\circledR $
and polyester (unhemmed). To prevent the flags from being buried due to snow accumulation, they were raised by station personnel on three occasions during the winter. This simply involved removing the bamboo pole from the ground and replanting it in fresh snow in close proximity to the previous flag placement.
${}^\circledR $
and polyester (unhemmed). To prevent the flags from being buried due to snow accumulation, they were raised by station personnel on three occasions during the winter. This simply involved removing the bamboo pole from the ground and replanting it in fresh snow in close proximity to the previous flag placement.
On 9 January 2024, the experiment was terminated. The flags were carefully retrieved from the field location in the order in which they were deployed along the two east-west-orientated lines and returned to the Bonner Laboratory. The flags were then removed from the bags and dried to a constant weight (~48 h) to remove any melted snow/moisture prior to re-weighing using the same balance as used initially.
Data analysis
Data analysis was performed in R v.4.4.1 within the interface RStudio v2024.04.14. Analysis of the flag biomass data was conducted using a general linear model that was built to test the percentage weight loss of material for each of the four different flag types. P-values were obtained from the summary output of the model. Post hoc analysis was conducted using the package emmeans (estimated marginal means) to compute the pairwise differences between the flag types (RStudio 2024, version 4.4.1).
Results
Environmental conditions
Wind
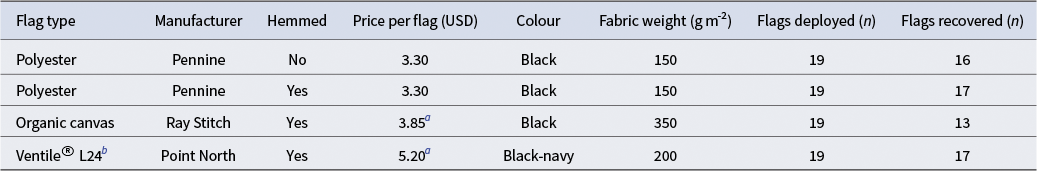
At the flag deployment site, the prevailing wind was north-north-easterly (see Fig. S2). Wind speed data are presented as monthly averages. In general, the 5 year average wind speed data (January 2019–January 2024) accorded well with the average wind speeds recorded during the deployment period, which both ranged between ~5 and 10 knots across the year, with slightly lower average wind speeds detected during the summer months (Fig. 2). As would be expected, the maximum 10 min average wind speeds were ~10–15 knots below the 5 year maximum 10 min average wind speeds, with values of ~20 knots or (sometime much) more recorded throughout the year. Gusts exceeding 60 knots occurred occasionally in the vicinity of Rothera Research Station, and in February 2023 a gust of 53 knots was recorded at the deployment site, which was the highest record that year (data not shown due to averaging effect).
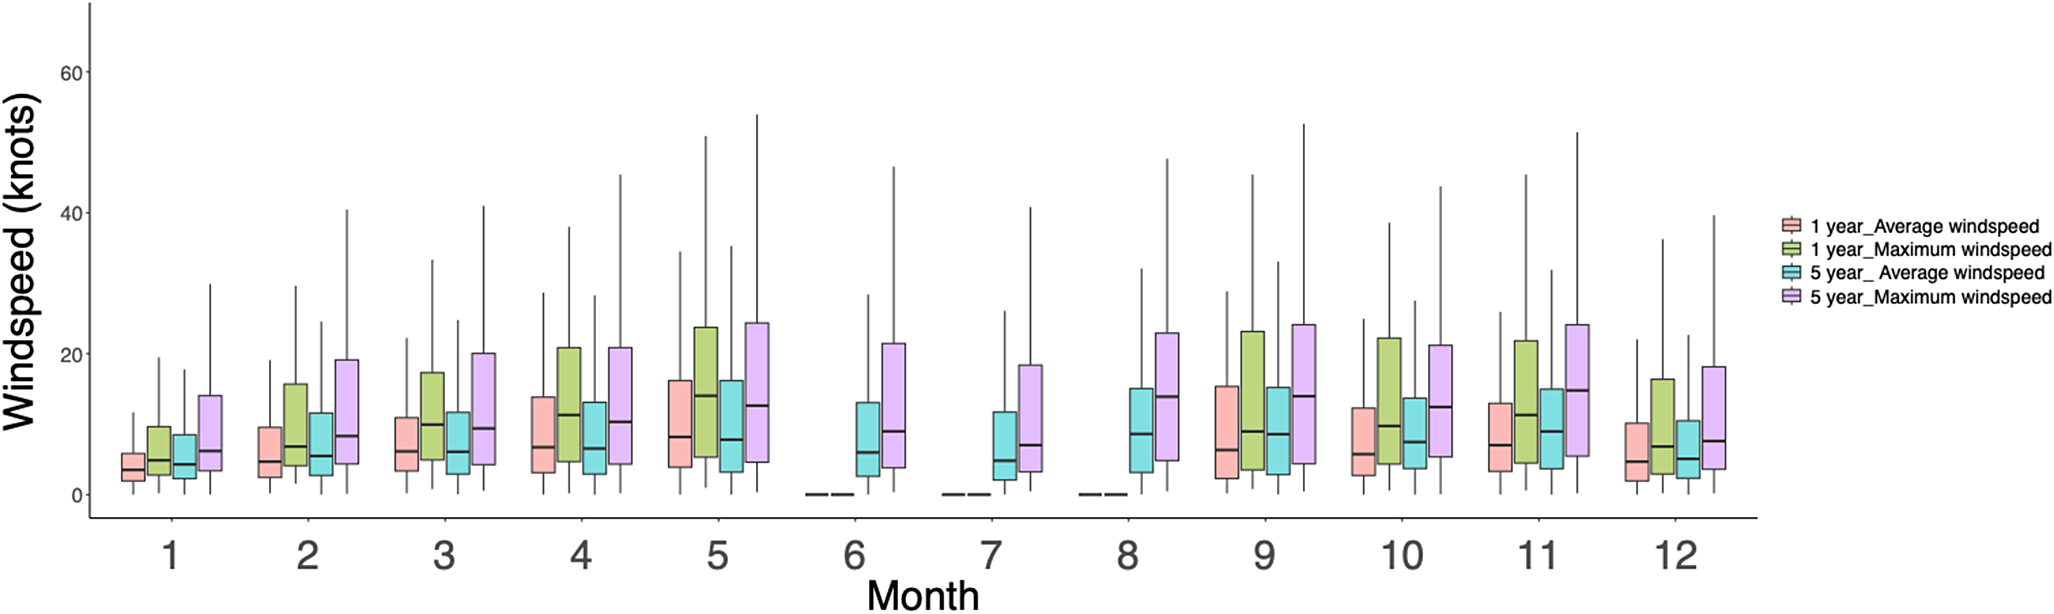
Figure 2. Average and maximum wind speed data recorded at Rothera Research Station Skiway automatic weather station between February 2023 and January 2024 (pink and green) and across a 5 year period between January 2019 and January 2024 (teal and purple). Boxes indicate the interquartile range, horizontal lines inside the boxes indicate the median and whiskers indicate the range of data per month.
Ultraviolet radiation
The location of Rothera Research Station is just above the Antarctic Circle, meaning that the sun does not rise/set for approximately 2 weeks either side of the winter and summer solstices, respectively. The formation of the Antarctic ozone hole in spring and early summer can lead to increased levels of UV radiation. This is shown by the enhanced levels of UV radiation recorded during the period between September and December compared to the values recorded during the period of equivalent solar angle (January to March) in the late summer when the ozone hole is no longer present (Fig. 3). During the summer at Rothera Research Station, UV-A (315–400 nm) and UV-B (280–315 nm) radiation may reach values of up to 58 and 1.7 Wm-2, respectively.
Figure 3. Maximum daily UV-A (315–400 nm; top) and UV-B (280–315 nm; bottom) radiation data (W m-2) recorded at Rothera Research Station between 1997 and 2012.
Temperature
Extreme cold temperatures are recorded regularly on the Antarctic Plateau, especially over the winter months (e.g. temperatures of −50°C or lower for periods of days to weeks are not uncommon at high-latitude locations). Rothera Research Station is located on the coast in Maritime Antarctica and generally experiences more mild temperatures. The coldest temperature experienced during the study period was −21.3°C. August was the coldest month, with a mean monthly temperature of −12.4°C (Fig. 4).

Figure 4. Monthly air temperatures (°C) recorded at Rothera Research Station Skiway between February 2023 and January 2024. Boxes indicate the interquartile range, horizontal lines inside the boxes indicate the median and whiskers indicate the range of data per month.
Release of material into the environment through flag degradation
In this study, 76 flags were deployed, but despite steps being taken to periodically check on the flags and raise them as necessary, 13 flags (17%) were not recovered because they had become completely buried in snow and consequently lost. Following subsequent consultation with the BAS operations team, it was suggested that flag loss was commonplace and the recovery of 83% of flags after almost 1 year of field deployment was a considered a high recovery rate.
During this study, on average, all the flag types were degraded and lost weight when exposed for a prolonged period to Antarctic environmental conditions (Fig. 5). A new standard polyester flag weighed 32.6 g (± standard error (SE) 0.17), and during the 11 month field deployment it lost 8.3 g (± SE 1.04), equivalent to 25.5% of its weight. Polyester hemmed flags shed less plastic compared to the standard unhemmed polyester flags, with the former loosing approximately half as much plastic (13.3% (± SE 3.7)) compared to the latter. Ventile ${}^\circledR $
flags degraded to a similar degree as standard unhemmed polyester flags, losing 26.9% (± SE 3.8) of their weight. Canvas flags degraded to the greatest extent and lost 44.1% (± SE 4.3) of their weight across the deployment period. Due to the heavier weights of Ventile
${}^\circledR $
flags degraded to a similar degree as standard unhemmed polyester flags, losing 26.9% (± SE 3.8) of their weight. Canvas flags degraded to the greatest extent and lost 44.1% (± SE 4.3) of their weight across the deployment period. Due to the heavier weights of Ventile ${}^\circledR $
and canvas (200 and 350 g m-2, respectively), when compared to unhemmed polyester flags the amount of material lost to the environment was on average approximately a third greater for Ventile
${}^\circledR $
and canvas (200 and 350 g m-2, respectively), when compared to unhemmed polyester flags the amount of material lost to the environment was on average approximately a third greater for Ventile ${}^\circledR $
flags and four times greater for canvas flags.
${}^\circledR $
flags and four times greater for canvas flags.
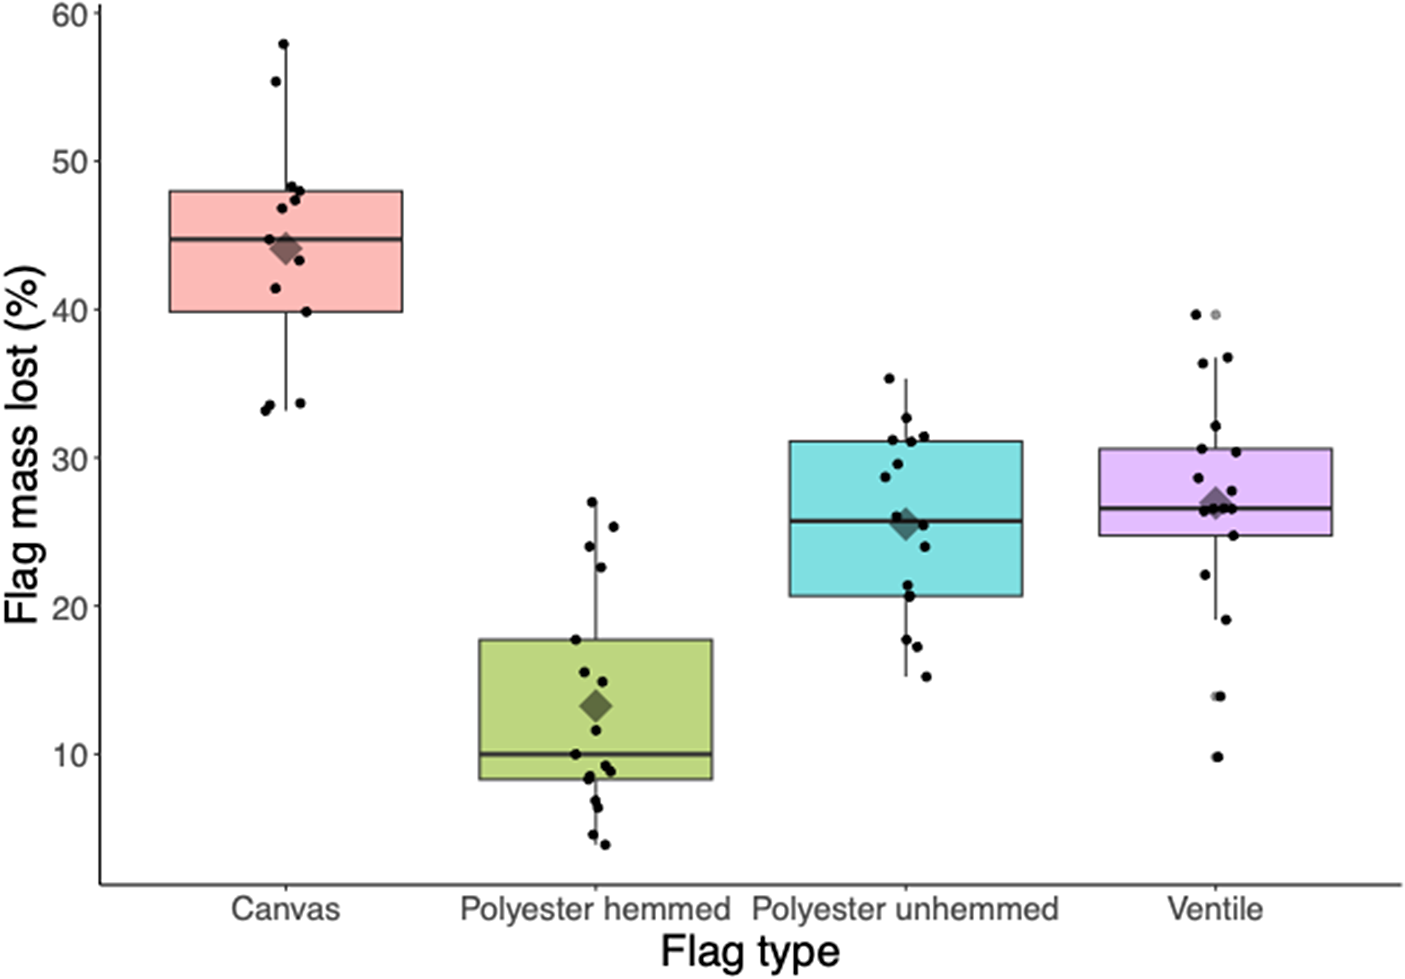
Figure 5. Percentage degradation of each flag type. Significantly different groups are shown by different asterisk combinations. Boxes indicate the interquartile range, horizontal lines indicate the median and whiskers denote the range of data per month. The mean value for each flag type is indicated by a diamond symbol. Points are superimposed on the boxplots.
The results of the linear model showed a statistically significant difference between flag material treatments (F
3,59 = 43.513, P < 0.001). The post hoc analysis showed that three treatments were significantly different from one another, and standard unhemmed polyester flags and Ventile ${}^\circledR $
flags experienced similar degradation rates (t
ratio = 0.55, P = 0.95; Fig. 5).
${}^\circledR $
flags experienced similar degradation rates (t
ratio = 0.55, P = 0.95; Fig. 5).
From the eight randomly selected bamboo poles, an average pole weighted 370 g, with there being high variability between each pole (± SE 69).
Discussion
Plastic pollution resulting from the use of polyester flags
In this study, we have attempted to quantify the release of plastic material from polyester marker flags that were subjected to Antarctic environmental conditions for almost 1 year. Our data showed that, on average, a single standard polyester flag lost 8.3 g of plastic during the deployment period. However, more generally, the degree of material loss is likely to vary depending upon the environmental conditions of the location where the flag is deployed. Factors that might contribute to increased rates of flag material breakdown include the high UV radiation levels that are seasonally increased due to ozone depletion, the mechanical stresses generated by high-frequency flag flapping during high wind speeds, the abrasion caused by blowing snow and ice particles and the changes in material stiffness with exposure to low temperatures (Bedenko et al. Reference Bedenko, Tropanikhin and Erokhina2017, Zhang & Zhang Reference Zhang and Zhang2017, Pinlova & Nowack Reference Pinlova and Nowack2023). Given that over 1000 flags are deployed per year in the vicinity of Rothera Research Station, we estimate that > 8.3 kg of plastic is lost to the local environment each year from these flags. The number of equivalent marker flags used at research stations and traverse routes by other national Antarctic programmes and tourist operators is not known. However, if we make a conservative estimate that each national Antarctic programme (n = 31), together with the three main land-based tourist operators (Antarctic Logistics and Expeditions, White Desert and Ultima), each use 1000 marker flags per year, then that equates to an annual release of ~300 kg of plastic into the Antarctic environment. This estimated value is approximately one or two orders of magnitude greater than the estimated microplastic weight of personal care products released annually from Antarctic research station wastewater systems (i.e. an average of 4.4–50 kg per year; Waller et al. Reference Waller, Griffiths, Waluda, Thorpe, Loaiza and Moreno2017). As is appropriate, much attention has been given to the adoption of measures to limit the release of plastics via wastewater systems, including use of water filters and the prohibition of personal care products containing microbeads. However, this study has shown that plastic release from flags may be at least as important an issue that would benefit from further consideration by the ATCM and COMNAP.
Plastic release into the environment
The fate of plastics released from flags may depend upon several factors, including the size of the fragments detached from the flags and whether the area downwind is permanent ice, ocean or ice-free ground. Smaller fragments of plastic flag may be transported in the air over considerable distances (Aves et al. Reference Aves, Revell, Gaw, Ruffell, Schuddeboom and Wotherspoon2022), and larger fragment may be blown across the snow surface before they lodge against a surface feature and become buried under accumulating snow (Hughes et al. Reference Hughes, Boyle, Morley-Hurst, Gerrish, Colwell and Convey2023b). Depending upon buoyancy, plastic deposited in the marine environment may be dispersed farther by ocean currents or sink to the ocean floor (Kooi et al. Reference Kooi, Reisser, Slat, Ferrari, Schmid and Cunsolo2016), and plastic released into areas of ice-free ground may become incorporated into soils or potentially be ingested by local wildlife (Gobulev Reference Golubev2020, Zhang et al. Reference Zhang, Zhang, Ju, Qu, Chu, Huo and Wang2022). In this study, the flags used were located less than 1 km from ice-free ground and within 2 km of the coast, meaning that plastic debris may have been wind-transported over short distances to a range of environment types.
Comparison with other flag types
Ventile ${}^\circledR $
degraded to approximately the same extent as polyester unhemmed flags, and we were therefore unable to identify a non-synthetic alternative flag material that was more resistant to degradation under Antarctic environmental conditions. Although experience has shown that canvas is effective at withstanding Antarctic conditions when used as a tarpaulin material, in our study canvas flags lost on average almost half of their mass across the deployment period. One explanation for this could be the degree of tension applied to the material, as canvas tarpaulins used to cover snowmobiles are fixed to the machines with elastic chords and are unable to flap in the wind as a flag would do. Therefore, tensioning of the canvas material could help to reduce degradation, as is done already on the ‘tensioned flags’ that are used as markers on the skiway near Rothera Research Station (Fig. 1). Tensioned flags are made of polyvinyl chloride (PVC)-coated polyester tarpaulin and can last 5 years or more. However, the manufacture of these flags is expensive relative to that of standard polyester flags (USD 64.00 per PVC-coated polyester flag compared to USD 3.30 for each standard polyester flag). The PVC-coated flags, at 610 g m-2, weigh much more than the currently used polyester flags and alternative material types, and therefore a lighter-weight alternative could be trialled. Our data also revealed that hemming polyester flags on average approximately halved the level of plastic released during their deployment. If a suitable non-synthetic flag material cannot be identified to replace polyester, then trials to identify a more robust flag design could further reduce plastic loss to the environment. Future trials could consider comparing the microstructure of the flag material pre- and post-deployment.
${}^\circledR $
degraded to approximately the same extent as polyester unhemmed flags, and we were therefore unable to identify a non-synthetic alternative flag material that was more resistant to degradation under Antarctic environmental conditions. Although experience has shown that canvas is effective at withstanding Antarctic conditions when used as a tarpaulin material, in our study canvas flags lost on average almost half of their mass across the deployment period. One explanation for this could be the degree of tension applied to the material, as canvas tarpaulins used to cover snowmobiles are fixed to the machines with elastic chords and are unable to flap in the wind as a flag would do. Therefore, tensioning of the canvas material could help to reduce degradation, as is done already on the ‘tensioned flags’ that are used as markers on the skiway near Rothera Research Station (Fig. 1). Tensioned flags are made of polyvinyl chloride (PVC)-coated polyester tarpaulin and can last 5 years or more. However, the manufacture of these flags is expensive relative to that of standard polyester flags (USD 64.00 per PVC-coated polyester flag compared to USD 3.30 for each standard polyester flag). The PVC-coated flags, at 610 g m-2, weigh much more than the currently used polyester flags and alternative material types, and therefore a lighter-weight alternative could be trialled. Our data also revealed that hemming polyester flags on average approximately halved the level of plastic released during their deployment. If a suitable non-synthetic flag material cannot be identified to replace polyester, then trials to identify a more robust flag design could further reduce plastic loss to the environment. Future trials could consider comparing the microstructure of the flag material pre- and post-deployment.
Flag management
Polyester flags are essential to many operators working in Antarctica. However, it is possible that they may be viewed by some operators as almost ‘disposable’ due to their low cost, which allows for their ready deployment and sometimes makes their retrieval difficult to justify given the cost of the associated logistical resources, their sometimes rapid rate of degradation depending upon the environmental conditions and their capacity to become buried and lost if they are not regularly maintained. In our study, challenging weather conditions during the winter meant that station personnel were not able to access the flag study site as often as was desired, and so 17% of the flags were lost (Table I). More generally, BAS logistics experts estimate that ~70% of station and field flags are never recovered (R. Grant & T. Sylvester, personal communication 2024). Indeed, flags that are blown away and/or become buried are rarely if ever recovered, resulting in a total loss of flag plastic to the environment. If we extrapolate this across all national Antarctic programmes and land-based tourism companies, this may equate to a potential loss/burial of ~23 800 flags per year, equating to the loss of ~800 kg of plastic and ~9000 kg of bamboo poles (assuming a typical 2.4 m pole weighs ~370 g). We note, however, that the specification of bamboo poles and flags used across operators remains unknown, and the actual values could be greater or smaller than the estimated values employed. Nevertheless, in accordance with Annex I to the Protocol, efforts should be made to identify means to mitigate this potential environmental impact and to identify a marker system that is less damaging to the environment (Hughes et al. Reference Hughes, Boyle, Morley-Hurst, Gerrish, Colwell and Convey2023b).
Conclusions
This work was undertaken as a response to ATCM and COMNAP requests for further research on sources and quantities of plastics released into the Antarctic environment. Our study identified polyester flags as a substantial source of plastic pollution compared to the release of microplastics derived from personal care products in wastewater from Antarctic research stations. During our trial, it was not possible to identify a non-synthetic flag material that was more durable under Antarctic environmental conditions than standard polyester flags; however, the tight-weave cotton Ventile ${}^\circledR $
fabric was comparable in terms of durability. Based on our research and consideration of the issue we propose the following recommendations:
${}^\circledR $
fabric was comparable in terms of durability. Based on our research and consideration of the issue we propose the following recommendations:
-
• Consideration should be given to minimizing the number of flags used in the field while at the same time ensuring that human safety is not compromised.
-
• National Antarctic programmes and the tourism industry should consider moving away from the use of polyester to non-synthetic alternatives for the construction of marker flags (e.g. Ventile ${}^\circledR $
or a more cost-effective alternative).
${}^\circledR $
or a more cost-effective alternative). -
• Further research should be undertaken to investigate a wider range of non-synthetic flag materials (potentially incorporating UV protective coatings; Li et al. Reference Li, Li and Ren2019) and flag designs (including hemming, alternative fabric weaves and the use of tension). Although a more robust product might entail higher production costs, these might be offset by a prolonged product lifespan.
-
• In their planning, those deploying flags should account for the need to provide adequate flag maintenance and retrieval. Flags should not be viewed as semi-disposable items, and their use, at both a project-specific and organizational level, should be subject to appropriate environmental impact assessments, as set out in Annex I to the Protocol.

Supplementary material
To view supplementary material for this article, please visit http://doi.org/10.1017/S0954102025000112.
Acknowledgements
The authors thank Laura Gerrish of the British Antarctic Survey (BAS) Mapping and Geographic Information Centre (MAGIC) for the provision of Fig. 1, Jamie Oliver for providing the graphical abstract, Bede West and Eloise Chambers for raising the flags during the 2023 Antarctic winter, Matthew Hughes for helping to collect the flags at the end of the deployment period, Floor Van Den Heuvel and Simon Morley for their input and support during this project and Sam Hunt and Rob Grant from the BAS field operations team for the provision of useful insights regarding flag use and deployment.
Data availability
Data will be made publicly available at the following repository: https://github.com/nadiafrontier/Antarctic-plastic-flags.git.
Competing interests
The authors declare none.
Author contributions
NF: conceptualization, formal analysis, investigation, resources, methodology, project administration, writing - original draft, writing - review & editing. JHC: formal analysis, investigation, methodology, visualization, writing - review & editing. KAH: supervision, validation, writing - original draft, writing - review & editing.


 Open access