


Introduction
Palmer Station is the smallest of three US scientific research bases in Antarctica. It is located on the south-western coast of Anvers Island, which is mostly glaciated, on the western side of the Antarctic Peninsula. Here, the temperature is considered mild (on average -4.7°C in winter and 1.9°C in summer from 1997 to 2023), but rapid warming is occurring despite high interannual variability (Jones et al. Reference Jones, Bromwich, Nicolas, Carrasco, Plavcová, Zou and Wang2019, Carrasco et al. Reference Carrasco, Bozkurt and Cordero2021). Palmer Station was constructed in 1968 to support scientific research, replacing ‘Old Palmer’ established in 1965 on Amsler Island (~2 km north-west of Palmer Station). The station was named after Nathaniel B. Palmer, an American sealer from Connecticut, who may have been the first person to see Antarctica during an exploratory voyage in 1820. Palmer Station is built on solid rock, and it has two main buildings and three smaller ones, two fuel tanks and a pier with a station maximum capacity of 44 people. In 1990, it was designated a Long-Term Ecological Research (LTER) site (Smith et al. Reference Smith, Baker, Fraser, Hofmann, Karl and Klinck1995), but it also supports various research efforts on climate, aeronomy, astrophysics, glaciology and marine and terrestrial organisms. Behind Palmer Station sits the Marr Ice Piedmont, which once covered most of the rocky terrain (Fig. 1). Here, we present for the first time a 60 year record of glacial retreat behind Palmer Station from 1963 to 2023 (some years shown in McClintock et al. Reference McClintock, Ducklow and Fraser2008, Groff et al. Reference Groff, Beilman, Yu, Ford and Xia2023).
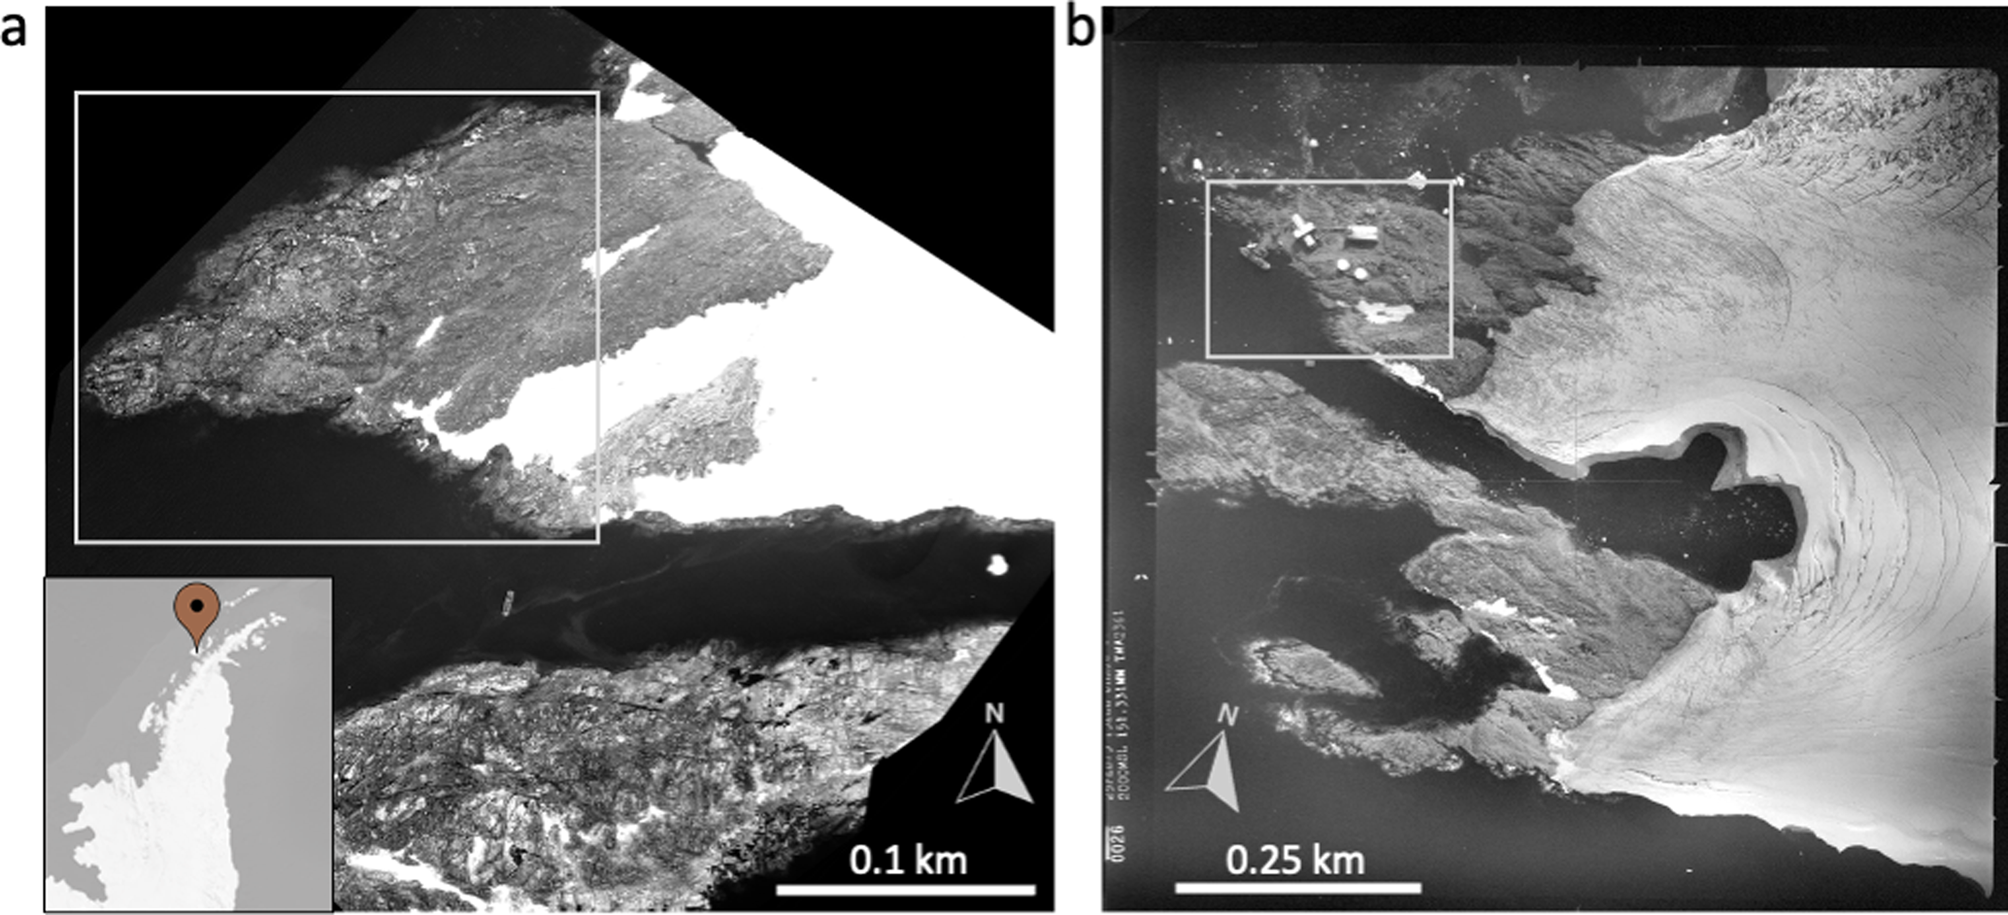
Fig. 1. Early aerial photography on a. 25 January 1963 (US Geological Survey) and b. 25 February 1975 from 2000 ft (Scientific Committee for Antarctic Research). Palmer Station was built in 1968. The grey box highlights approximately the same region in the two images. The inset in a. shows the location of Palmer Station along the West Antarctic Peninsula.
Methods
The location of the glacier terminus was determined using multiple methods. Terminus lines prior to 1987 (n = 3) were obtained from historical aerial imagery (e.g. Fig. 1). After 1987 (n = 20), data were collected sporadically, generally every 1–5 years until 2017, when data were collected annually. A continuous GPS base station named PALM was installed in 1997 by the US Geological Survey (USGS). Glacier terminus lines between 1997 and 2006 were recorded with an Ashtech Z-12 GPS receiver. In 2006, the PALM station was upgraded to a continuous Global Navigation Satellite System (GNSS) base station (Trimble NetR8 base receiver) named PAL2 by the University NAVSTAR Consortium (UNAVCO). Measurements from 2006 to 2023 were made by walking the glacial melt boundary using either a post-processed kinematic survey or a real-time kinematic survey with a backpack-mounted Trimble R7, Pacific Crest RFM96W radio and a Trimble TSC2 Data Collector. Most surveys were conducted during the peak of the summer between January and March, when the terrain is generally snow-free. We calculated the area of land not covered by glacial ice for each year in which a glacial terminus survey was conducted. To do this, polygons were created from the surveyed coastline to each glacial terminus line, and the area of bare rock was determined using the feature to polygon tool in the data management toolbox in ArcGIS Pro v10.8. The rate of retreat was calculated by determining the area of newly exposed bare rock per year.
Results
The glacier has been in retreat since before the station was established, where the terminus was 42 m (closest distance) east of the Terra Laboratory in 1963 (Fig. 2a) and 506 m east of the Terra Laboratory in 2023 (a change of 464 m in 60 years or 7.7 m/year). The area of exposed bare rock increased linearly over time, with 0.034 km2 of exposed rock in 1963 and 0.27 km2 of exposed rock in 2023. However, the rate of glacial ice loss varied by two orders of magnitude, ranging from 0.00025 to 0.012 km2 of newly exposed bare rock per year (Fig. 2b). With this high variability, the trend was weak (P = 0.1), suggesting there has been only a modest acceleration in ice loss over time (Fig. 2b).
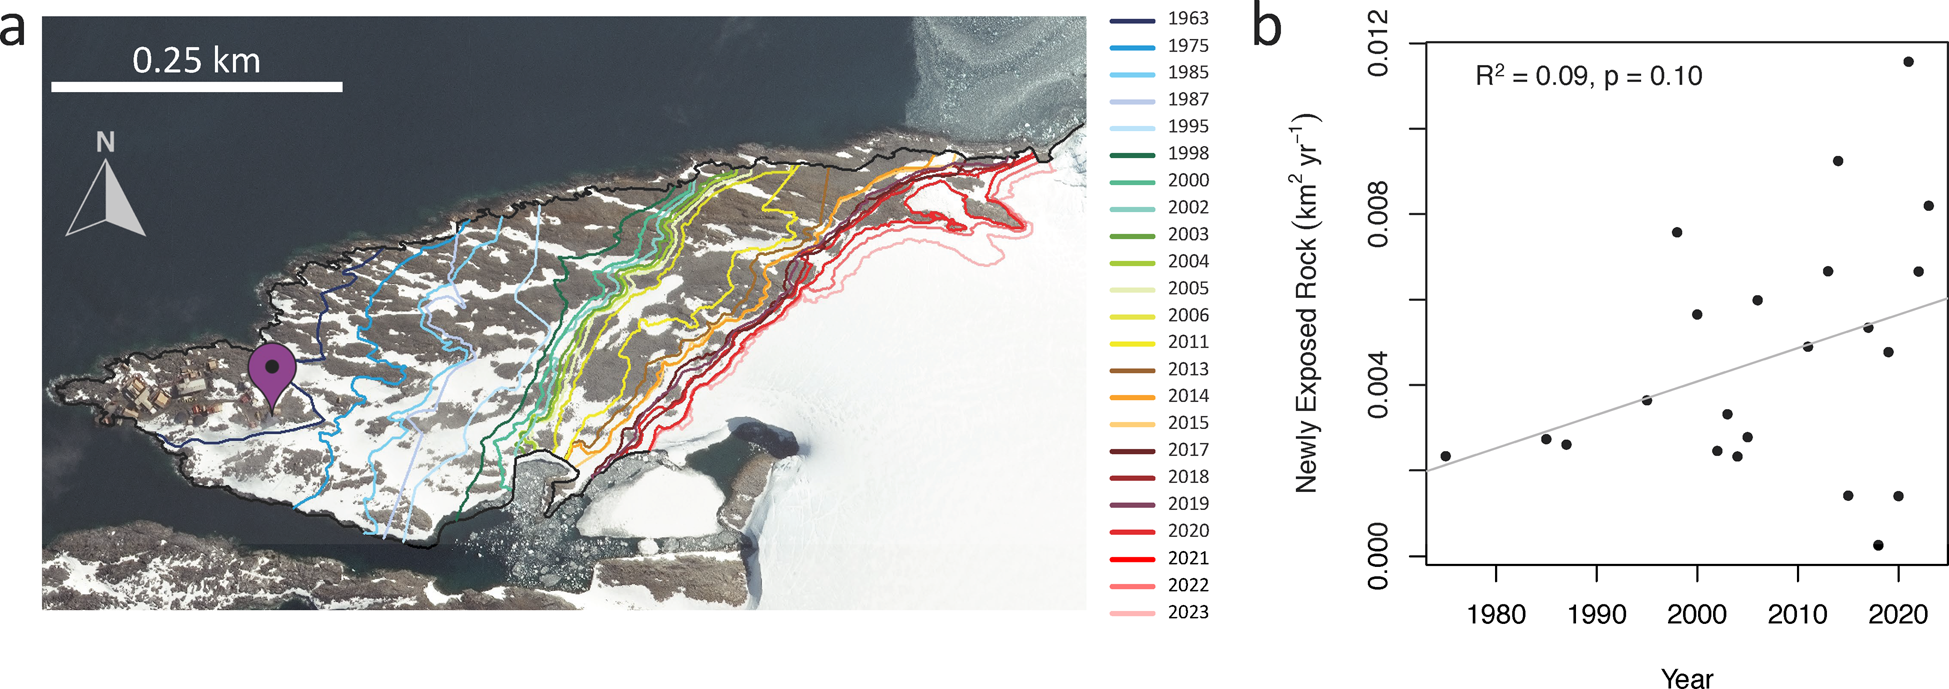
Fig. 2. Glacial retreat behind Palmer Station. a. Satellite image of the Palmer Station region taken in 2019 (Digital Globe), with coloured lines representing the location of the glacial terminus in surveyed years. The purple marker indicates the location of the Terra Laboratory and the black line is the surveyed coastline. b. Time series of the rate of glacial retreat, showing the area of newly exposed bare rock per year.
Discussion
Here, we show rapid glacial retreat of the Marr Ice Piedmont over 60 years (7.7 m/year), which agrees with estimates from past studies of 10 m/year (Bockheim et al. Reference Bockheim, Vieira, Ramos, López-Martínez, Serrano and Guglielmin2013) and 8.7 m/year since 1963 (Groff et al. Reference Groff, Beilman, Yu, Ford and Xia2023). In addition to the dramatic visual changes in the landscape, glacial melt can have subtle yet profound ecosystem impacts. Glacial meltwater contributes freshwater to the ocean, physically impacting water column characteristics (e.g. turbidity, stratification) and biogeochemistry, which can influence phytoplankton community composition and bloom magnitude (Lima et al. Reference Lima, Pezzi, Mata, Santini, Carvalho and Sutil2022, Jones et al. Reference Jones, Meredith, Lohan, Woodward, Van Landeghem and Retallick2023). Such changes at the base of the food web can then cascade to higher-level benthic and pelagic predators. The exposure of smooth rock or gravel can provide suitable environments for terrestrial plants (e.g. Antarctic hairgrass Deschampsia antarctica, turf mosses Polytrichum strictum and Chorisodontium aciphyllum) and new haul-out sites for seals or breeding grounds for penguins and other seabirds. The rapid glacial retreat reported in this study is not unique; ~60% of the glaciers along the Antarctic Peninsula are retreating (Silva et al. Reference Silva, Arigony-Neto, Braun, Espinoza, Costi and Jaña2020). The close proximity of this glacier to a major scientific station provides an opportunity to study the biogeochemical, trophic and habitat impacts of glacial retreat on a model Antarctic ecosystem. Moreover, as expedition cruise ships regularly visit the region of Palmer Station, this recession provides an opportunity for educational outreach by giving visitors a strong visual measure of rapid climate change in Antarctica.
Acknowledgements
This material is based on services provided by the GAGE Facility, operated by the EarthScope Consortium, with support from the National Science Foundation, the National Aeronautics and Space Administration and the US Geological Survey under NSF Cooperative Agreement EAR-1724794. We thank the many Palmer Station research associates that have contributed to mapping the glacier terminus in previous years and Darren Roberts and Megan Roberts for ArcGIS assistance. We thank the editor and reviewers, including James McClintock, who offered editorial insights and over two decades encouraged many a Palmer Station-based science technician to pack their GPS devices and hike the terminus of the Marr Glacier.
Financial support
MAC acknowledges support from the National Science Foundation Office of Polar Programs (ANT-2026045).
Author contributions
MAG and MAC conceived of the study. MAG participated in data collection and gathered historical photos and data. SB analysed the data in ArcGIS. MAC wrote the manuscript with additions from MAG and SB. MAC, MAG and SB interpreted the data, and MAC and SB made the figures.
Availability of data
Data are available from the Environmental Data Initiative at https://doi.org/10.6073/pasta/17fb0d6521936574547113574c2cd703 (Palmer Station Antarctica LTER et al. Reference Bent, Cimino and Goerke2023).


 Open access