Introduction
Seabirds are considered one of the most threatened avian groups globally, with anthropogenic impacts operating both at terrestrial breeding grounds and in marine foraging areas (Croxall et al. Reference Croxall, Butchart, Lascelles, Stattersfield, Sullivan, Symes and Taylor2012, Dias et al. Reference Dias, Martin, Pearmain, Burfield, Small, Phillips, Yates, Lascelles, Borboroglu and Croxall2019). Among the assemblage, the most threatened species are those which are highly pelagic, such as the Procellariiformes (albatrosses, petrels, and shearwaters) and Sphenisciformes (penguins). Whilst large foraging ranges may buffer against localised prey scarcity, the wide-ranging movements of pelagic seabirds may increase their exposure to acute threats such as fisheries bycatch. A recent assessment of the marine-based conservation issues facing the storm petrels (Hydrobatidae and Oceanitidae) highlighted pollution, energy production and mining, attraction to artificial light sources and climate change as the main threats (Dias et al. Reference Dias, Martin, Pearmain, Burfield, Small, Phillips, Yates, Lascelles, Borboroglu and Croxall2019).
Implementation of effective global conservation action for seabirds requires information on their marine distribution in order to assess and manage marine-based threats. For species that disperse over wide areas with little, or unpredictable, spatial aggregation, conservation measures are required at regional, or ocean-basin, scale (Oppel et al. Reference Oppel, Bolton, Carneiro, Dias and Green2018), and necessitate effective management of the issues by the relevant national or international authorities. For species with less extensive and with predictably aggregated distributions, spatially mediated protection measures such as Marine Protected Areas, (MPAs) are more likely to be appropriate and effective (Wilson et al. Reference Wilson, Black, Brewer, Potts, Kuepfer, Win, Kober, Bingham, Mavor and Webb2014). Croxall et al. (Reference Croxall, Butchart, Lascelles, Stattersfield, Sullivan, Symes and Taylor2012) identified the need for national, regional, and global networks of marine IBAs as a central pillar of seabird conservation worldwide, alongside the need to effectively reduce seabird bycatch to negligible levels. Whilst the identification and classification of terrestrial sites used by seabirds for breeding was undertaken throughout Europe several decades ago, the designation of marine areas used for foraging by seabirds during the breeding season has progressed more slowly, due to the difficulty in identifying suitable areas (European Commission 2007, Kober et al. Reference Kober, Webb, Win, Lewis, O’Brien, Wilson and Reid2010, Ramirez et al. Reference Ramirez, Tarzia, Dias, Burfield, Ramos, Garthe and Paiva2017). To date, knowledge of regional-scale patterns of marine distribution of seabirds has derived principally from boat-based and aerial transect surveys (Winiarski et al. Reference Winiarski, Burt, Rexstad, Miller, Trocki, Paton and McWilliams2014, Heinänen et al. Reference Heinänen, Žydelis, Dorsch, Nehls and Skov2017), which have been used to map regional-scale variation in vulnerability to bycatch (Bradbury et al. Reference Bradbury, Shackshaft, Scott-Hayward, Rexstad, Miller and Edwards2017), oil pollution (Williams Reference Williams, Tasker, Carter and Webb1995, Webb et al. Reference Webb, Elgie, Irwin, Pollock and Barton2016) and offshore windfarm developments (Bradbury Reference Bradbury, Trinder, Furness, Banks, Caldow and Hume2014, Certain et al. Reference Certain, Jørgensen, Christel, Planque and Bretagnolle2015) and also to identify candidate MPAs (Kober et al. Reference Kober, Wilson, Black, O’Brien, Allen, Win, Bingham and Reid2012). However, attempts to identify areas for consideration as MPAs from seabird transect data found relatively few areas that met the threshold criteria for regular aggregation of seabirds, often due to insufficiency of data (Kober et al. Reference Kober, Wilson, Black, O’Brien, Allen, Win, Bingham and Reid2012).
Although transect-based marine surveys enable the collection of abundance data for multiple species simultaneously, they may not be cost-effective for mapping highly pelagic species that roam over large areas at ocean-basin scale. Furthermore, the breeding status and colony provenance of individuals counted during transect surveys are generally unknown, so aggregations of seabirds considered to be of conservation importance, or at risk from particular threats, are anonymous: the colonies that would benefit from the implementation of conservation measures to safeguard such seabird aggregations are seldom known with certainty. In recent years, the increasing miniaturisation and affordability of telemetry devices has led to an upsurge in seabird tracking which has enabled a colony-focused approach to mapping seabird marine distribution. Large-scale, multi-colony tracking programmes have also enabled the estimation of regional-scale marine distribution of several seabird species by modelling space-use as a function of colony attributes, accessibility and environmental covariates (e.g. Wilson et al. Reference Wilson, Black, Brewer, Potts, Kuepfer, Win, Kober, Bingham, Mavor and Webb2014, Wakefield et al. Reference Wakefield, Owen, Baer, Daunt, Dodd, Green, Guilford, Mavor, Miller, Newell, Newton, Robertson, Shoji, Soanes, Votier, Wanless and Bolton2017).
A variety of analytical techniques, such as maximum curvature (O’Brien et al. Reference O’Brien, Webb, Brewer and Reid2012, Wilson et al. Reference Wilson, Black, Brewer, Potts, Kuepfer, Win, Kober, Bingham, Mavor and Webb2014) and the Getis-ord Gi* statistic (Kober et al. Reference Kober, Wilson, Black, O’Brien, Allen, Win, Bingham and Reid2012) have been applied to transect survey data and modelled density surfaces, to identify persistent high-usage areas and delimit areas for statutory protection as MPAs. More recently, Lascelles et al. (Reference Lascelles, Taylor, Miller, Dias, Oppel, Torres, Hedd, Le Corre, Phillips, Shaffer, Weimerskirch and Small2016) have developed a colony-orientated framework that can be applied directly to raw tracking data, to identify candidate marine IBAs, which has been used to identify potential MPAs in the Mediterranean, Indian and Atlantic oceans (Louzão et al. Reference Louzão, Bécares, Rodríguez, Hyrenbach, Ruiz and Arcos2009, Dias et al. Reference Dias, Oppel, Bond, Carneiro, Cuthbert, González-Solís, Wanless, Glass, Lascelles, Small, Phillips and Ryan2017, Krüger et al. Reference Krüger, Ramos, Xavier, Grémillet, González-Solís, Kolbeinsson, Militão, Navarro, Petry, Phillips, Ramírez, Reyes-González, Ryan, Sigurðsson, Van Sebille, Wanless and Paiva2017, Heerah et al. Reference Heerah, Dias, Delord, Oppel, Barbraud, Weimerskirch and Bost2019).
Notwithstanding the huge increase in seabird tracking effort in recent years, the smallest species such as the storm-petrels have remained poorly studied, due to the lack of sufficiently lightweight tracking devices. Until recently tracking of storm-petrels has only been possible using low resolution (both temporal and spatial) geolocation (GLS) tags, which are sufficiently small to deploy on species weighing <50 g. Such tags have permitted the broad-scale characterisation of marine distribution of larger storm-petrel species such as Leach’s Storm petrel Hydrobates leucorhous that undertake foraging trips of up to one week’s duration and that range several thousand kilometres from the colony (Pollet et al. Reference Pollet, Ronconi, Jonsen, Leonard, Taylor and Shutler2014, Hedd et al. Reference Hedd, Pollet, Mauck, Burke, Mallory, McFarlane Tranquilla, Montevecchi, Robertson, Ronconi, Shutler, Wilhelm and Burgess2018). However, these tracking devices are unable to provide the fine-scale resolution required for species undertaking trips of shorter duration, such as the smallest Atlantic seabird, the European Storm-petrel Hydrobates pelagicus (hereafter “Storm-petrel”), which typically spends 1–3 days at sea (Davis Reference Davis1957a, Reference Davis1957b). Consequently, the foraging ranges of these Storm-petrels during the breeding season are currently known principally from boat-based transect surveys (e.g. Kober et al. Reference Kober, Wilson, Black, O’Brien, Allen, Win, Bingham and Reid2012, Waggitt et al. Reference Waggitt, Evans, Andrade, Banks, Boisseau, Bolton, Bradbury, Brereton, Camphuysen, Durinck, Felce, Fijn, Garcia-Baron, Garthe, Geelhoed, Gilles, Goodall, Haelters, Hamilton, Hartny-Mills, Hodgins, Jessopp, Kavanagh, Leopold, Lohrengel, Louzao, Markones, Martinez-Cediera, O’Cadhla, Perry, Pierce, Ridoux, Robinson, Santos, Saavedra, Skov, Stienen, Sveegaard, Thompson, Vanermen, Wall, Webb, Wilson, Wanless and Hiddink2020), and even this is challenging. With a wing length of just 12 cm (Scott Reference Scott1970), the Storm-petrel is extremely difficult to detect in all but the calmest of sea conditions. The densities estimated from transect surveys are typically extremely low (Kober et al. Reference Kober, Webb, Win, Lewis, O’Brien, Wilson and Reid2010), with the highest concentrations reported from the continental shelf edge (Kober et al. Reference Kober, Webb, Win, Lewis, O’Brien, Wilson and Reid2010, Reference Kober, Wilson, Black, O’Brien, Allen, Win, Bingham and Reid2012), where upwelling of nutrient-rich cold water results in high food availability in the surface layers. Whilst Storm-petrels are generally absent from coastal waters during daylight, they return to the breeding colony during the hours of darkness (Davis Reference Davis1957a), and hence the pattern of marine distribution is likely to exhibit pronounced diurnal variation. Boat-based visual surveys, necessarily conducted during daylight and during calm sea states, may not fully represent their marine distribution integrated across the entire diurnal cycle, and in all weather conditions. Thaxter et al. (Reference Thaxter, Lascelles, Sugar, Cook, Roos, Bolton, Langston and Burton2012) estimated from survey data that the maximum foraging range exceeded 65 km, and they considered the level of confidence in the estimate was “poor”.
In the last few years, lightweight (<1 g) GPS tags have become available that permit fine-scale high-precision tracking of birds as small as the Storm-petrel. Here I report the first multi-annual empirical determination of foraging range of Storm-petrels during both incubation and chick-rearing at the largest UK colony. The median and maximum foraging ranges are compared for birds during incubation, brooding and post-brooding phases of breeding. I examine the representativeness of the sample of birds tracked during each breeding stage to estimate colony-level foraging areas, and I apply the method of Lascelles et al. (Reference Lascelles, Taylor, Miller, Dias, Oppel, Torres, Hedd, Le Corre, Phillips, Shaffer, Weimerskirch and Small2016) to identify high usage areas that may warrant consideration for statutory protection given the international significance of the breeding colony. Marine distributions of birds during daylight, during which boat-based transect surveys would be undertaken, are compared with those at night, when many birds return to the colony. Finally, Storm-petrel marine distribution is examined in relation to a variety of marine threats, such as offshore wind farms, hydrocarbon wells and platforms.
Methods
Study site and tag deployment protocol
Fieldwork was carried out on the island of Mousa, Shetland Isles, UK (60°00’N, 01°10’W) between mid-July and late August each year between 2014 and 2017. During the “Seabird 2000” census (Mitchell et al. Reference Mitchell, Newton, Ratcliffe and Dunn2004), the colony held an estimated 6,800 pairs, some 27% of the UK population at that time. Since then, the colony increased to almost 11,000 pairs in 2015 (Bolton et al. Reference Bolton, Sheenan, Bolton, Bolton and Bolton2017), representing around 2.5% of the minimum estimate of the global population of the species (876,000 mature individuals; BirdLife International 2015). The island is designated as a European Special Protection Area (SPA), with Storm-petrels named as a protected feature. Up to 50 pairs breed in nest boxes located in natural habitat and stone walls throughout the colony (Bolton Reference Bolton1996) which facilitates monitoring, marking and capture of breeding birds with a minimum of disturbance. One member of each pair typically remains in the nest for up to three consecutive days during incubation (Davis Reference Davis1957a) and for periods of one day during brooding, which typically lasts for a week after chick hatching (Davis Reference Davis1957b). Nest visits, to change over nest attendance or to provision chicks after the brooding phase, occur exclusively at night. Birds breeding in nest-boxes were plumage-dyed to facilitate individual-recognition by gently lifting the nest-box lid and marking birds on their tertial feathers with non-toxic paint, applied without handling birds, as they remained on the nest. Birds typically showed no response to being marked in this way, indicating that they were undisturbed by the procedure. Prior to tag deployment, nests were inspected daily to determine attendance patterns. Individuals were selected for tagging on the anticipated day of departure to avoid wasteful tag battery depletion whilst birds remained at the nest. Birds were caught by hand at the nest less than one hour before nightfall, weighed to 0.1 g and tags were attached to the base of the central tail feathers using three 2 mm wide strips of Tesa® tape. Tags weighed <1 g (typically 0.93 g), representing 3–4% of adult body mass. In 2014 tags were supplied by Biotrack (PinPoint 8), with capacity for 8 locations (“fixes”). In 2015–2017 Pathtrack NanoFix mini tags (manufacturer’s specified capacity of 80 fixes) were used. Study nests were selected from widely separated locations (up to 1.2 km apart) within the colony, since some studies have shown intra-colony differences in marine distribution related to nest location (e.g. Ceia et al. Reference Ceia, Paiva, Ceia, Hervías, Garthe, Marques and Ramos2015). Nests were checked daily after tag deployment for the return of tracked birds. For individuals tracked during incubation and brooding, to reduce disturbance tags were removed just before nightfall towards the end of the subsequent nest attendance shift and birds were weighed on tag retrieval. Birds were therefore weighed at a similar point in their nest attendance cycle on both tag deployment and retrieval, so body mass would be similar if tags did not affect foraging efficiency. During the post-brooding period, nests were checked repeatedly overnight to retrap adults. Due to the limited data capture and storage capacity of tags, and the anticipated differences in duration of foraging trips with breeding stage, and unknown battery life, a variable programming schedule was adopted (Table S1 in the online supplementary materials). Tag schedules were designed to maximise temporal resolution, while ensuring tags remained active until the completion of at least one foraging trip. The duration of the brooding phase (when chicks are brooded during daylight by an adult) is variable among pairs and the end of the brooding stage was defined as the first day on which the chick was left unattended. On occasion, tags deployed during the brooding stage recorded bird movements in both the brooding and post-brooding stage, if the brooding period ended during the period of tag deployment. The breeding stage of each trip was categorised according the breeding stage at the time of the trip, not on tag deployment.
Potential impacts of tagging on foraging performance and breeding success
Potential negative impacts of tagging on foraging performance were examined by comparing the change in body mass of tracked individuals between tag deployment and tag retrieval, under the null hypothesis of no change in mass. Daily failure rates of nests attended by tagged individuals were also compared with those attended by untagged control birds. A GLM with binomial errors and a logit link function was used to examine whether daily nest failure rates varied among years and between tagging treatments, also considering if there was any interaction between any effects of year and tagging on nest failure.
Processing of tracking data
Due to the low temporal resolution and limited quantity of data collected in 2014, it was not possible to construct trajectories for individuals tracked in that year. During the 2015-2017 field seasons, improvements in tag performance allowed entire foraging trips to be recorded, but 34% of 29 tags failed to obtain locations for considerable periods (>8 hours), possibly due to water ingress, before resuming normal function. Procedures for dealing with unobserved locations can lead to bias in estimation of trip characteristics such as foraging range. For example, if temporary tag failure occurs at random, or becomes more likely with increasing time at sea, it will be more likely to occur at least once on longer trips. Exclusion of all incompletely observed trips may therefore result in bias towards trips of shorter duration, which would affect estimation of trip characteristics and utilisation distributions. Such potential bias must be balanced against the uncertainties introduced by modelling putative locations during protracted unobserved periods. Tracks obtained in 2015–2017 which comprised more than one foraging trip were split into individual trips by visual inspection. Since all parts of the colony lie within 1.2 km of the centre of the island, the start of a trip was defined when a bird was > 1.3 km from the centre of the island and did not return for >12 hr. Multiple trips per deployment occurred if the bird was not retrapped during the first return to the colony. This was most likely during the post-brooding period, when nocturnal visits to the nest may be very brief (<20 mins). I excluded data from four individuals for periods where the timing and duration of unobserved locations resulted in uncertainty as to whether the individual returned to the colony during the unobserved period (i.e. the unobserved period spanned the entire period of darkness when birds may have returned to the colony). I also excluded four trips where battery failure occurred whilst the birds were still more than 100 km of the colony, and I excluded the final trips of two individuals tracked over multiple trips where battery failure occurred shortly after the final departure from the colony. The sample retained for analysis comprised 31 trips from 23 individuals, including one bird tracked in two years. These trips were rediscretised to a constant 30 min sampling interval by fitting a Continuous-Time Correlated Random Walk model (CTCRW; Johnson et al. Reference Johnson, London, Lea and Durban2008) implemented in R (R Core Team 2016) package “crawl” (Johnson Reference Johnson2017), which estimates locations during unsampled periods. A CTCRW approach has advantages over linear data interpolation since it makes use of variance and autocorrelation in velocity to parameterise a movement model. This procedure estimates not only the bird’s likely location during unsampled periods but also allows the calculation of errors in latitude and longitude related to the length of time interval to the closest known location.
Estimation of foraging range, total distance travelled and trip duration
Foraging range (the maximum distance attained from the colony) and the total distance travelled (the sum of the distances between successive estimated locations) were calculated for each breeding stage, including the start and end points within the 1.3 km buffer around the central point of the colony.
Assessment of marine distribution, threat exposure and suitability of area-based conservation measures
Following Soanes et al. (Reference Soanes, Arnould, Dodd, Sumner and Green2013) I defined the “home range” and “core use” areas as the 95% and 50% Utilisation Distribution (UD) contours respectively. UDs were constructed using Kernel Density Estimation with a smoothing parameter value (h) derived from the scale of Area Restricted Search (ARS; Lascelles et al. Reference Lascelles, Taylor, Miller, Dias, Oppel, Torres, Hedd, Le Corre, Phillips, Shaffer, Weimerskirch and Small2016, Beal et al. Reference Beal, Oppel, Handley, Pearmain, Morera-Pujol, Miller, Taylor, Lascelles and Dias.2020). To assess whether Storm-petrels were aggregated sufficiently highly and regularly in any marine area to warrant consideration of spatially-explicit conservation measures, I estimated the number of individuals using core foraging areas using procedures described in Lascelles et al. (Reference Lascelles, Taylor, Miller, Dias, Oppel, Torres, Hedd, Le Corre, Phillips, Shaffer, Weimerskirch and Small2016), implemented in the R package ‘track2KBA’ (Beal et al. Reference Beal, Oppel, Handley, Pearmain, Morera-Pujol, Miller, Taylor, Lascelles and Dias.2020). Firstly, I used a bootstrapping procedure to examine the colony-level representativeness of the core use areas from the samples of tracks obtained during each breeding stage. Data groups for which the sample represented >60% of the estimated colony-level core usage area were considered adequate for further analysis, and calculated usage of all areas was down-weighted by the estimate of colony-level representativeness. The core use area of each independent trip was overlapped on a 1 x 1 km grid on a Lambert Equal-Area Azimuthal projection, and the proportion of trips whose core use areas overlapped was calculated. The number of individuals from the breeding colony on Mousa estimated to use each area was determined from the proportion of overlapping trips multiplied by the number of individuals breeding within the colony, and down-weighted to reflect the colony-level representativeness of the sample of tracks (see Lascelles et al. Reference Lascelles, Taylor, Miller, Dias, Oppel, Torres, Hedd, Le Corre, Phillips, Shaffer, Weimerskirch and Small2016 and Beal et al. Reference Beal, Oppel, Handley, Pearmain, Morera-Pujol, Miller, Taylor, Lascelles and Dias.2020 for details). The number of birds estimated to use key foraging areas was compared with estimates of the minimum global population size of Storm-petrels (876,000 mature individuals; BirdLife International 2015) according to criterion A4 for identification of Important Bird Areas (Grimmett and Jones Reference Grimmett and Jones1989, Donald et al. Reference Donald, Fishpool, Ajagbe, Bennun, Bunting, Burfield, Butchart, Capellan, Crosby, Dias, Diaz, Evans, Grimmett, Heath, Jones, Lascelles, Merriman, O'Brien, Ramírez and Wege2019).
Comparison of daytime and night-time marine distributions
Since Storm-petrels only visit the colony during the hours of darkness, it is likely that their marine distribution varies markedly between the hours of daylight (when they are available for visual detection by boat surveys) and darkness (when they may be most vulnerable to attraction to gas flares). Furthermore, the convergence of crepuscular commuting flights to and from the colony may result in considerably higher densities in the vicinity of the colony at these times of day than those observed during daylight. Marine UDs (excluding all locations within 1.3 km of the colony centre) were computed over the 24-hr cycle and compared with distributions between (i) sunrise and sunset (“day”), and (ii) sunset and sunrise (“night”). The timing of sunrise and sunset was computed using R package ‘maptools’ (Bivand and Lewin-Koh Reference Bivand and Lewin-Koh2019) defining “day” and “night” from the timing of civil twilight (solar angle of -6o).
Extent of overlap during daylight and darkness with oil and gas fields
Exposure to pressures associated with oil and gas platforms, such as surface oil pollution and incineration in gas flares, was assessed from the extent of overlap of the home range and core use areas with locations of oil and gas platforms and wells in waters surrounding the study colony (data obtained from the UK Oil and Gas Authority National Data Repository https://ndr.ogauthority.co.uk accessed 30/07/2019. In light of the potential variation in marine distribution between daylight and darkness, and the increased likelihood of attraction to gas flares during darkness, the extent of overlap was estimated separately for day and night distributions.
Results
Tag retrieval rates and potential negative impacts
Retrieval rates of tags were generally high, with 45 of 58 (78%) tags recovered (Table S1). Deployments made during the brooding period were particularly successful (100% of 13 tags recovered) since foraging trips were of shorter duration than at other stages, reducing the chance of tag loss at sea, and the adults remained at the nest during the day following their return, greatly facilitating recapture. In contrast, tags were difficult to retrieve during the post-brooding stage, with 16 of 23 (70%) tags recovered, as adults visited the nest only at night, and analysis of tracks revealed that birds generally remained for only a short period to feed the chick before returning to sea. The maximum period for which a tag remained attached was 12 days, whereas one individual retrapped just 27 hr after deployment had shed its tag, likely due to poor adhesion of the tape. There was a slight increase in body mass between tag deployment and retrieval (mean 1.32 g + 0.41 t 43= 3.204 P <0.003), indicating that tagging was not associated with negative impacts on foraging performance. Across all years, daily failure rates of nests attended by tagged birds did not differ from controls (means 0.0128 + 0.0018 (SE) n = 57 and 0.0122 + 0.0007 (SE) n = 92 respectively X 21 = 0.009 P = 0.92). There were no differences in daily nest failure rates according to year (X 23 = 2.734 P = 0.43) and no interaction between year and tagging treatment (X 23= 0.732 P = 0.87).
Trip durations and distances in relation to breeding stage and year
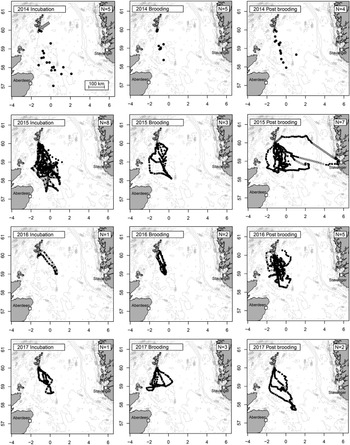
Visual inspection of the raw tracking data and modelled gap-filling locations indicated a high degree of consistency in foraging range and bearing in all four years (Figure 1). Most trips departed the colony within a narrow range of bearings between 135o and 180o, and with the exception of a single individual that was probably storm-driven 397 km from the colony to the coast of Norway, all individuals used shallow shelf waters south of the colony. Trip durations during incubation were highly variable – ranging from one to three days (median 49 hr; Table 1), whereas birds brooding small chicks were never away from the colony for more than 28 hr, increasing to a maximum of 52 hr after chicks developed thermal independence. Although there were highly significant positive correlations between trip duration, the total distance travelled and the maximum range from the colony (Figure 2), and there was a tendency for trip durations to vary according to breeding stage (Kruskal-Wallis X22 = 5.57 P = 0.062), there were no significant differences in total distance travelled or foraging range among breeding stages (X22 = 4.50 P = 0.11 and X22 = 4.21 P = 0.12 respectively).

Figure 1. Marine distribution of Storm-petrels breeding on Mousa (arrowed, upper left panel), Shetland, UK, by year and breeding stage. All observed locations (at the temporal resolution shown in Table S1) shown as filled circles. Gap-filling locations estimated at 30 min intervals from Continuous-time Correlated Random Walk (CTCRW) applied to data collected in 2015, 2016 and 2017 also shown (open circles, see methods for details). Number of individuals tracked in each stage and year shown in upper right of each panel. Bathymetry data uploaded from NOAA using the R package “marmap” Pante and Simon-Bouhet (Reference Pante and Simon-Bouhet2013).
Table 1. Trip duration, total distance travelled and maximum range from the breeding colony of Storm-petrels foraging during incubation, brooding and post brood stages tracked between 2015 and 2017 (median, (LQ-UQ), max, (n)), including all unobserved periods where locations were modelled.


Figure 2. Positive relationships between trip duration and (a) total distance travelled (Spearman’s R = 0.79 P < 0.0001), (b) maximum foraging range (Spearman’s R = 0.73 P < 0.0001) and (c) between total distance travelled and maximum range (Spearman’s R = 0.92 P < 0.0001). Grey symbols = incubation, open symbols = brooding, black symbols = post-brooding.
Identification of potential marine Important Bird Areas
There was no evidence of individual foraging area fidelity (mean value from 1,000 resamples P > 0.2) and therefore multiple trips by the same individual were regarded as independent. The radius of Area Restricted Search behaviour was used as the smoothing parameter h for kernel density estimation, and varied from 7 km during incubation, to 5 km during brooding and 6 km during post-brooding (5.5 km for all stages combined). Bootstrapping (1,000 resamples) indicated that the samples of trips obtained during incubation, brooding and post-brooding respectively characterised 65%, 84% and 77% of the colony-level distribution (Figure S1). Overlaying the trip-level core use areas of the samples of trips obtained during each breeding stage revealed two marine areas (Figure 3) that were each estimated to be used by up to 15,400 individuals breeding within the colony on Mousa (equivalent to >1.7% of the species’ global population). The waters adjacent to the breeding colony (covering c.340 km2), were used by 14,100 individuals during incubation, 15,400 individuals during brooding, and 12,100 individuals during the post-brooding period, reflecting the aggregations of birds commuting to and from the colony. A second area, covering c.620 km2, situated c.110 km to the south of the colony, was estimated to be used by > 15,400 individuals during the brooding period.

Figure 3. Candidate marine Important Bird Areas, estimated to be used by >1% of the global population of Storm-petrels, from the Mousa breeding colony (arrowed) during incubation, brooding and post brooding stages. The locations of existing protected marine areas are also shown: SPAs, Special Areas of Conservation (SACs) and Nature Conservation Marine Protected Areas (NCMPAs). Note that none of the existing protected areas shown include Storm-petrels as a protected feature. See online version for colour.
Comparison of daylight, nocturnal, and 24-hour Storm-petrel distributions
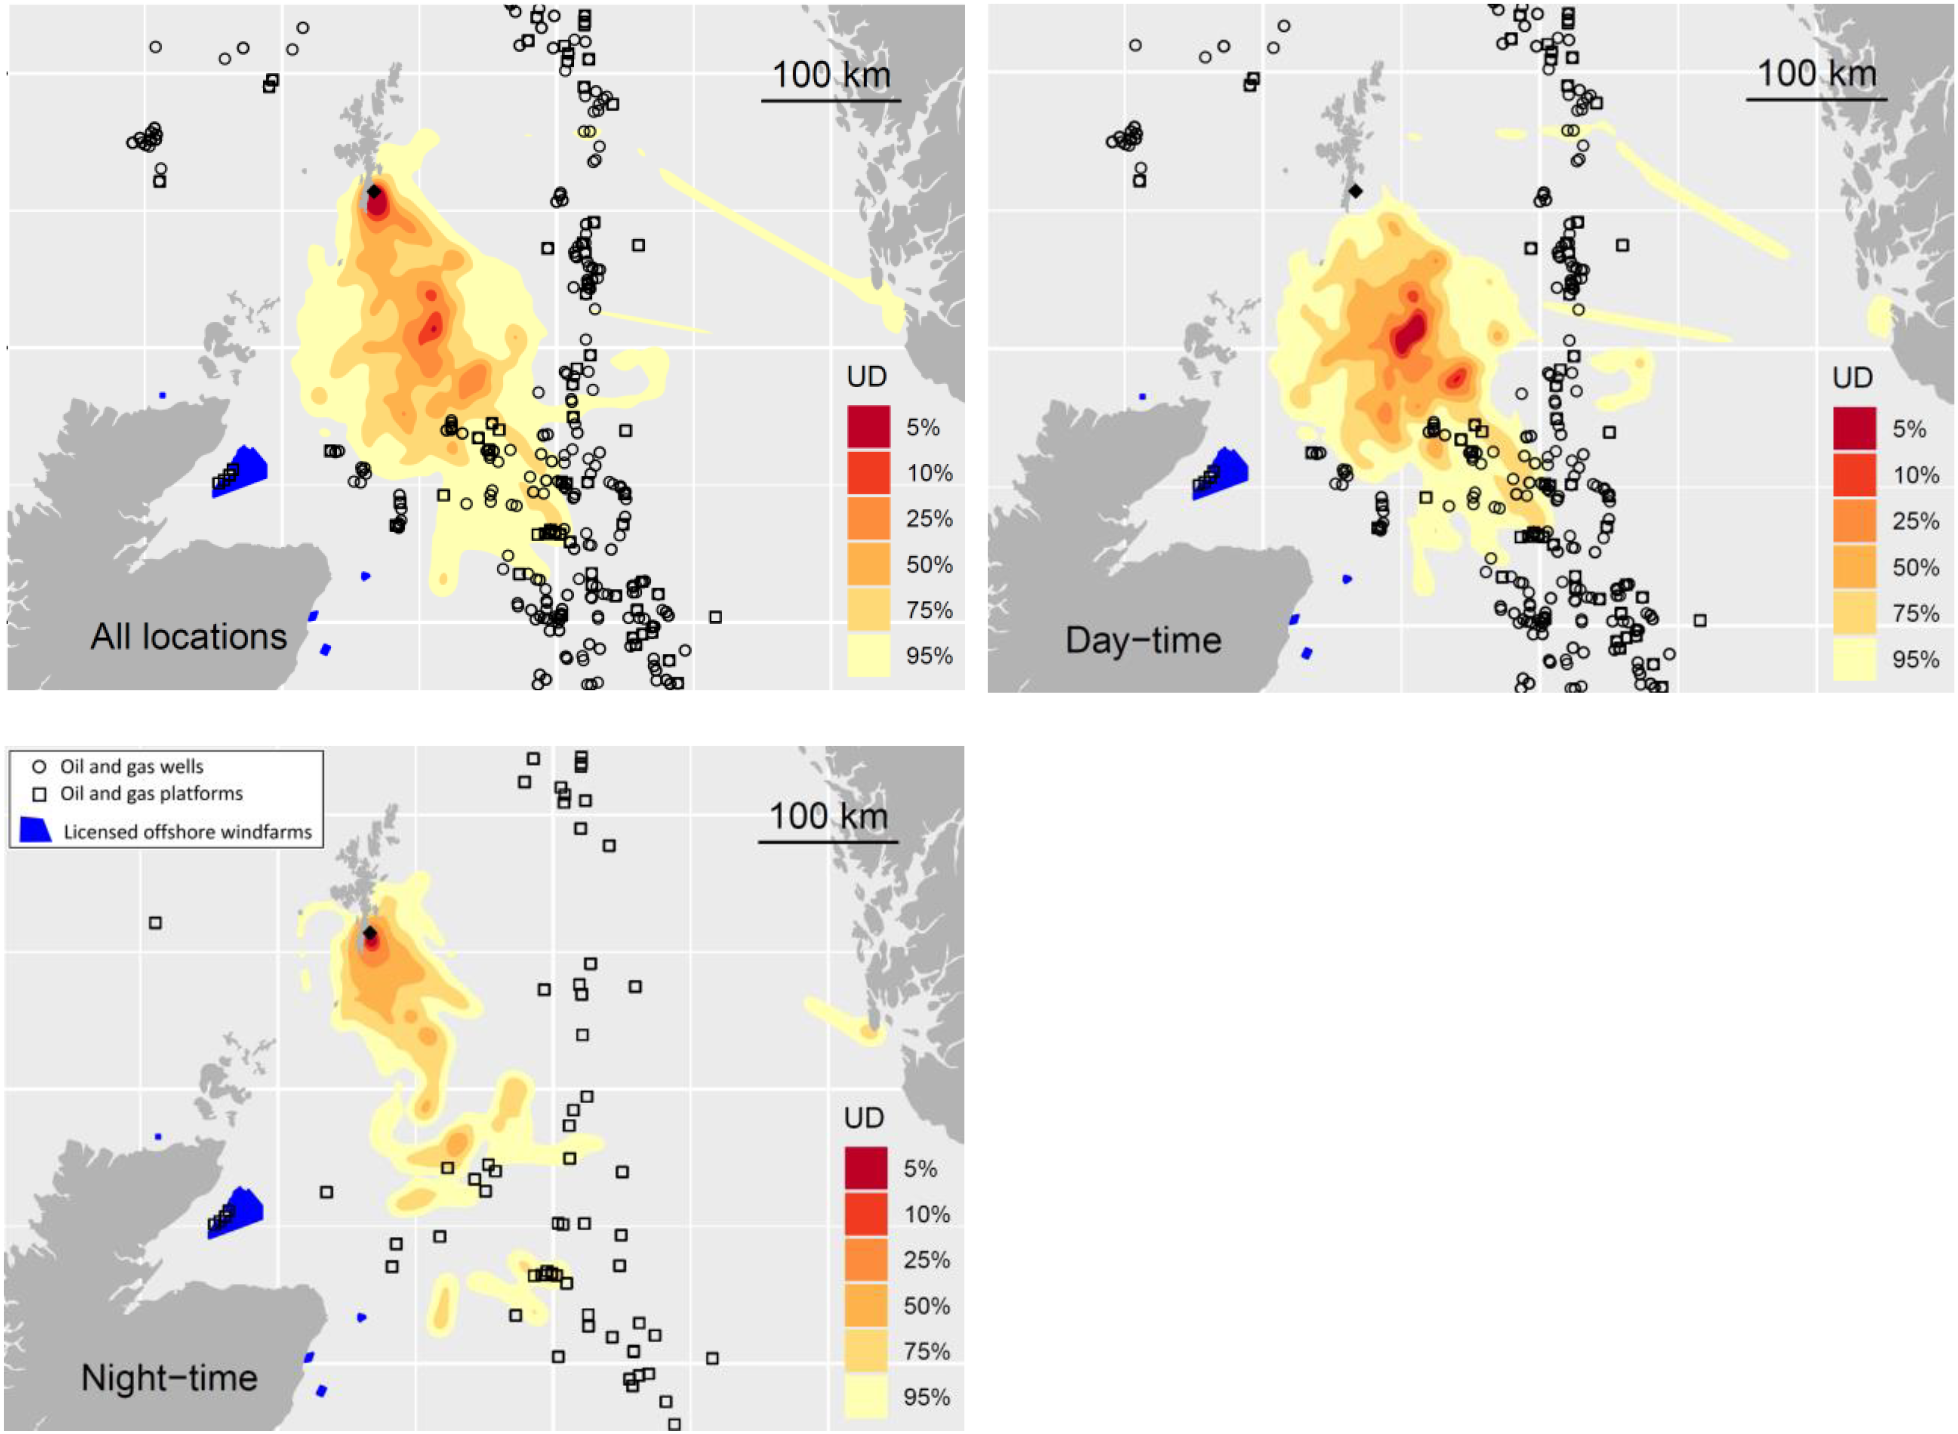
During the hours of daylight Storm-petrels showed a considerably more pelagic distribution compared to the pattern at night, or over the entire 24 hour cycle (Figure 4), reflecting the diurnal scheduling of offshore foraging during daylight and commuting back to the colony from early afternoon to arrive at the colony during darkness.

Figure 4. Marine distribution of Storm-petrels over the entire 24-hour cycle (upper left panel); during the hours of daylight (upper right panel) and at night (lower left panel). Also shown are active (currently drilling or operating) oil and gas wells (circles), platforms (squares) and licensed offshore windfarms. The location of the breeding colony is shown (black diamond). Note that the close proximity of some wells does not allow visual separation of all wells at the plotted scale. See acknowledgements for data sources and online version for colour.
Utilisation distributions and threat assessment
The home range (95% UD contour) of Storm-petrels breeding on Mousa SPA overlapped with 206 active hydrocarbon wells and 14 operating platforms in the North Sea (Figure 4). Of these, 92 wells and five platforms fell within the 75% UD contour, but no wells or platforms lay within the core usage (50% UD) area. Considering the marine distribution of Storm-petrels at night, when they may be more vulnerable to attraction to flares but a proportion of birds commute back to the colony, the 95%UD overlapped with 11 operating platforms, of which six lay within the 75% contour but none intersected with the core use area (Figure 4).
Discussion
This study presents the first high-precision, multi-annual tracking of Storm-petrels, breeding within the largest UK colony, which is designated as an SPA for the species. The median foraging range calculated across all breeding stages (159 km) greatly exceeded the previous estimate for the species (65 km; Thaxter et al. Reference Thaxter, Lascelles, Sugar, Cook, Roos, Bolton, Langston and Burton2012). Storm-petrels regularly ranged up to 300 km from the colony, and one individual, likely storm-driven, travelled nearly 400 km to the coast of Norway, but had returned to feed its chick 24 hours later. There were no statistically significant differences in trip duration or total distance travelled according to breeding stage. Tracked Storm-petrels showed highly consistent use of continental shelf waters to the south of the colony in all breeding stages and years of the study. An area in the close vicinity of the colony was used by a large proportion of the individuals tracked during all breeding phases as they commuted to and from the colony. A further area located about 110 km to the south of the colony was particularly important during the brooding period, when foraging ranges were more constrained by the need to return to the colony nightly. The number of birds estimated to use each of these areas during the brooding period exceeds 1% of the global population, the threshold for identification as a candidate marine IBA. Given the international importance of the breeding colony, statutory protection of these areas should be considered. Equally, other techniques such as the Getis-ord Gi* statistic or maximum curvature, could be applied to delimit the boundary of high usage areas, which would likely identify larger areas (Cleasby et al. Reference Cleasby, Owen, Wilson, Wakefield, O’Connell and Bolton2020).
The larger of the two areas overlaps extensively with the existing Central Fladen MPA designated for its benthic features. The second area overlies the existing seabird SPA at Sumburgh Head and Nature Conservation MPA “Mousa to Boddam” (Figure 3). Storm-petrels avoid coastal waters during daylight, presumably to avoid avian predators, and it is noteworthy that the high usage of the area close to colony was restricted entirely to the hours of darkness (Figure 4). Reliance on daytime boat-based surveys to quantify Storm-petrel marine distribution would fail to identify this area, since birds were almost entirely absent from this area during daylight.
Whilst the use of GPS tags has considerably advanced our understanding of the foraging range and colony-level marine distribution of this species, there are several potential limitations of this study. Firstly, there is a growing body of evidence that capture, handling and tagging of birds may affect their subsequent behaviour, breeding success and survival (see recent review by Bodey et al. Reference Bodey, Cleasby, Bell, Parr, Schultz, Votier and Bearhop2018). The GPS tags deployed in the study were the smallest and lightest commercially available at the time and represented <4% of adult Storm-petrel body mass. There was no evidence of adverse impacts on behaviour: tagged birds did not lose mass during the deployment period, and daily survival rates of their eggs and chicks were not significantly poorer than those of controls. Tags were attached to the central tail feathers using three very thin strips of adhesive tape, and in the event of non-retrieval, the tags will have detached within a few weeks after repeated immersion in salt water, reducing the likelihood of longer-term impacts. A second potential limitation of the study is that although marine distributions were highly consistent across three breeding stages in each of four years, the annual field seasons were confined to a relative short six-week period between mid-July and late August. Storm-petrel breeding is extremely protracted, with birds attending the study colony from late May to November. The current study provides no information of marine distribution before mid-July or from the start of September. Thirdly, although this work provides important new descriptive information on foraging ranges and marine distribution, which is crucial for conservation management and marine planning, it does not attempt to identify the drivers of the observed distribution. Knowledge of diet and seasonal shifts in prey choice and prey distribution will be fundamental in understanding the causes of the distributional pattern observed and likely seasonal, and longer-term, shifts in distribution. Lastly, the use of archival tags requires that birds complete a foraging trip and return safely to the colony for data retrieval. The marine distribution of bird which are injured or die whilst foraging, and do not return to the colony, cannot be determined using such tags.
Throughout their breeding range in north-west Europe, most Storm-petrel breeding colonies are located close to the continental shelf edge and in Britain and Ireland colonies are located on the northern and western coasts (Mitchell et al. Reference Mitchell, Newton, Ratcliffe and Dunn2004), mostly within 150 km of the shelf edge. This suggests that Storm-petrels are reliant on the biologically productive waters of the shelf edge for feeding. Boat-based surveys have tended to support this conclusion (Kober et al. Reference Kober, Wilson, Black, O’Brien, Allen, Win, Bingham and Reid2012, Waggitt et al. Reference Waggitt, Evans, Andrade, Banks, Boisseau, Bolton, Bradbury, Brereton, Camphuysen, Durinck, Felce, Fijn, Garcia-Baron, Garthe, Geelhoed, Gilles, Goodall, Haelters, Hamilton, Hartny-Mills, Hodgins, Jessopp, Kavanagh, Leopold, Lohrengel, Louzao, Markones, Martinez-Cediera, O’Cadhla, Perry, Pierce, Ridoux, Robinson, Santos, Saavedra, Skov, Stienen, Sveegaard, Thompson, Vanermen, Wall, Webb, Wilson, Wanless and Hiddink2020). The finding here, that birds nesting at a colony in south-east Shetland were foraging in shallow shelf waters to the south of the colony was somewhat unexpected. The 1,000 m isobath lies approximately 220 km offshore from the colony, which is slightly further than the median foraging range reported here, but well within the foraging range of many trips. The use of shallow seas to the south of the colony may reflect avoidance of competition with conspecifics from large breeding colonies in north-west UK and the Faroe Islands (Wakefield et al. Reference Wakefield, Owen, Baer, Daunt, Dodd, Green, Guilford, Mavor, Miller, Newell, Newton, Robertson, Shoji, Soanes, Votier, Wanless and Bolton2017, Bolton et al. Reference Bolton, Conolly, Carroll, Wakefield and Caldow2019). If avoidance of competition, rather than prey distribution, is the primary driver of foraging distribution, one might expect birds from Mousa to also exploit areas to the east and north-east of the colony, since there are no known larger colonies to the north of the study site. The highly consistent usage of a relatively small proportion of the potential foraging area, across years and breeding stages, suggests the foraging distribution may reflect the predictable distribution of certain abundant prey type(s). The waters accessed for foraging are seasonally stratified (Nielsen and St John Reference Nielsen and St John2001) and the area of highest usage was centred over the deepest water in the north-eastern North Sea, where a trench descends steeply to 243m (“The 110 Miles Holes”). This bathymetric feature is likely to be associated with increased mixing of the water column, and Scott et al. (Reference Scott, Webb, Palmer, Embling and Sharples2013) have found that local densities of foraging Storm-petrels in waters of south-west England were greatest where internal waves were generated over banks.
Prevailing wind direction may also play a role in determining both the location, and routes, used to access profitable feeding areas. Storm-petrels are able to detect prey downwind by olfaction (Hutchison and Wenzel Reference Hutchison and Wenzel1980, Verheyden and Jouventin Reference Verheyden and Jouventin1994), and flight efficiency will be affected by both wind speed and direction. Spear and Ainley (Reference Spear and Ainley1997) found that flight direction of a variety of storm-petrel species was generally orientated to avoid tail winds in favour of cross winds which provide lift as birds move at an angle across wave fronts. However, at high wind speeds storm-petrels are vulnerable to being storm-driven (Teixeira Reference Teixeira1987). Bolton (Reference Bolton1995) found that nocturnal provisioning of chicks was reduced following daytime wind speeds in excess of 38 km/hr. Extreme summer weather events are predicted to become more frequent as a result of climate change (IPCC 2014), and are likely to have significant impacts of the foraging ability and marine distribution of small seabirds such as Storm-petrels.
The unexpected finding that the foraging areas of Storm-petrels from this protected breeding colony lie to the south-east, rather than the west, of the Shetland archipelago has important implications for threat assessment. Mapping the vulnerability of a species to a particular threat relies on an assessment of (i) the species’ sensitivity to the particular threat and (ii) the extent of overlap in distributions of the threat and species (Williams et al. Reference Williams, Tasker, Carter and Webb1995, Certain et al. Reference Certain, Jørgensen, Christel, Planque and Bretagnolle2015). Species sensitivity will depend on the species’ behavioural, morphological, and ecological characteristics. Storm-petrels have been considered to have relatively low sensitivity to bycatch (Bradbury et al. Reference Bradbury, Shackshaft, Scott-Hayward, Rexstad, Miller and Edwards2017) and collision with, or displacement by, renewable energy devices (Furness et al. Reference Furness, Wade, Robbins and Masden2012, Reference Furness, Wade and Masden2013). However, a more recent detailed assessment has suggested that the overall “Species Sensitivity Index” of Storm-petrels to adverse impacts from windfarms was among the highest calculated for 30 seabird species (Certain et al. Reference Certain, Jørgensen, Christel, Planque and Bretagnolle2015). Whilst the mapped foraging distribution does not overlap with any commissioned or consented offshore windfarms, further, extensive offshore windfarm development in the North Sea is likely (Marine Scotland Reference Scotland2018). Storm-petrels are vulnerable to surface oil pollution (Williams et al. Reference Williams, Tasker, Carter and Webb1995) and are also considered to be sensitive to light pollution (Montevecchi Reference Montevecchi, Rich and Longcore2006), and consequent attraction towards, and incineration in, flares from oil and gas platforms (Weise et al. Reference Weise, Montevecchi, Davoren, Huettmann, Diamond and Linke2001, Baillie et al. Reference Baillie, Robertson, Wiese and Williams2005, Ellis et al. Reference Ellis, Wilhelm, Hedd, Fraser, Robertson, Rail, Fowler and Morgan2013, Ronconi et al. Reference Ronconi, Allard and Taylor2015, Hedd et al. Reference Hedd, Pollet, Mauck, Burke, Mallory, McFarlane Tranquilla, Montevecchi, Robertson, Ronconi, Shutler, Wilhelm and Burgess2018). Formerly, these threats were considered to present a low overall risk to Storm-petrels breeding within the Mousa SPA, due to the presumed absence of significant overlap between their marine distribution and hydrocarbon fields, which are predominantly located to the east and south of the Shetland archipelago. The tracking data presented here reveal some overlap, including at night when birds are likely to be more sensitive to light attraction. Resurvey of the study colony in 2015 revealed that earlier population growth (between 1996 and 2008; Bolton et al. Reference Bolton, Brown, Moncrieff, Ratcliffe and Okill2010) had been arrested, and the colony may be declining (Bolton et al. Reference Bolton, Sheenan, Bolton, Bolton and Bolton2017). Should the SPA breeding colony show significant future decline, the potential impact of offshore platforms should be considered further. The closely related Leach’s Petrel has declined substantially across the northern Atlantic (BirdLife International 2018), especially within the very large colonies in eastern Canada. Strandings and mortality of up to 50 individual Leach’s Petrels (platform-1.day-1) has been reported (Baillie et al. Reference Baillie, Robertson, Wiese and Williams2005) at offshore oil platforms on the Grand Banks, which lie within the foraging areas of the largest breeding colonies (Hedd et al. Reference Hedd, Pollet, Mauck, Burke, Mallory, McFarlane Tranquilla, Montevecchi, Robertson, Ronconi, Shutler, Wilhelm and Burgess2018).
The effectiveness of area-based conservation measures for highly mobile marine species, such as pelagic seabirds and marine mammals has been widely debated (e.g. Boersma and Parrish Reference Boersma and Parrish1999, Yorio Reference Yorio2009). For species that disperse widely and may be exposed to diffuse threats, large-scale marine management, targeted at the particular threat (such as bycatch or fishery stock depletion), is likely to be more effective than an area-based approach. A recent review of the spatial extent of movements of 52 species of seabirds tracked using GPS tags in the Atlantic Ocean, compared with the size of existing MPAs, concluded that for species such as shags (Phalacrocoracidae), gulls and terns (Laridae), and auks (Alcidae), the scale of movement was sufficiently limited to permit an area-based approach, but for other species such as albatrosses and petrels, the scale of movement was too large for MPAs to be effective (Oppel et al. Reference Oppel, Bolton, Carneiro, Dias and Green2018). The finding of highly aggregated and temporally consistent foraging grounds in a Storm-petrel species, especially during the brooding stage, indicates that an area-based approach may in fact represent a valuable conservation mechanism for this species. Earlier attempts using boat-based survey data to identify temporally and spatially persistent foraging aggregations of Storm-petrels in UK waters were unsuccessful (Kober et al. Reference Kober, Wilson, Black, O’Brien, Allen, Win, Bingham and Reid2012), largely due to paucity of data. The advent of low cost, lightweight, high precision and high capacity tracking devices offer huge potential to obtain data on the marine distribution of seabirds whose small size, nocturnal movements, and potentially large foraging ranges, mean that traditional, boat-based, visual survey methods may be less effective. Future work should focus on understanding the drivers of the observed foraging distribution and location of high usage areas, in order to establish the likelihood that these areas will remain constant over the longer term.
Supplementary Materials
To view supplementary material for this article, please visit http://dx.doi.org/10.1017/S0959270920000374.
Acknowledgements
I am indebted to my family (Jane, Jack and Susannah) who assisted in all aspects of the four fieldwork seasons. I thank the operators of the Mousa ferry for their exceptional service in transporting fieldworkers and equipment to the island, and the RSPB Shetland team for their support and assistance throughout. I also thank Matthew Carroll, Saskia Wischnewski, Steffen Oppel, Ian Cleasby, Adam Seward, Martin Beal and Devin Johnson for many useful discussions on the analysis of the data, and for their supply of, and assistance in running, R scripts. Nigel Butcher, Andrew Asque and Colin Gooch provided technical expertise and assistance in the supply and maintenance of equipment. Sarah Levett (Biotrack), Gary Brodin and Andrew Howarth (Pathtrack) provided helpful guidance on the selection and preparation of tags. Permission to work on Mousa was granted by SNH, RSPB and the Bell family. All capture, handling and tagging of birds was conducted under appropriate licences issued by the BTO. Data on the location SPAs and SACs with marine components were obtained from https://hub.jncc.gov.uk and data for NCMPAs were obtained from https://gateway.snh.gov.uk/natural-spaces/dataset.jsp?dsid=MPA (accessed 19/07/2019). All data were used under the terms of the Open Government Licence v3.0 (http://www.nationalarchives.gov.uk/doc/open-government-licence/version/3) and contain Joint Nature Conservation Committee data © copyright and database right [2019] and Scottish Natural Heritage Data © copyright and database right [2019]. JNCC accepts no liability for the use of this data or for any further analysis or interpretation of the data. Data on locations of windfarms subject to current legal agreements obtained from https://www.crownestatescotland.com/maps-and-publications, and used under the terms of the Open Government Licence v3.0. Data on locations of active hydrocarbon well and platforms obtained from the UK Oil and Gas Authority National Data Repository https://ndr.ogauthority.co.uk accessed 30/07/2019 and used under the terms of the Open Government Licence v3.0. Helpful comments on an earlier draft of the manuscript were provided by Alex Kinninmonth, Charles Nathan, Euan Dunn, Helen Moncrieff, Steffen Oppel, Linda Wilson, Ian Cleasby, Ellie Owen, Maria Dias, Jeremy Wilson and two anonymous referees. This work was funded by the RSPB.