


A key challenge confronting governments is how to promote the common good, understood as translating citizen resources into policies that enhance aggregate welfare, but there are political hurdles to enacting general interest legislation. For instance, policy proposals may enhance collective welfare but produce net costs for some regions or groups. When individual legislators represent geographic constituencies, the officeholder is under pressure to be responsive to their constituents, which may undercut support for policies that, on balance, improve public welfare (Arnold Reference Arnold1990). Prior research suggests that voters punish incumbents who fail to garner sufficient distributive spending for their constituents (Mayhew Reference Mayhew1976; Weingast, Shepsle, and Johnsen Reference Weingast, Shepsle and Johnsen1981). Representatives interested in policies that have positive net benefits for society may sometimes face a conflict when legislation that is good for the collective leaves their constituents worse off.
This tension between local and aggregate benefits is well understood in work focusing on legislative policy making (Patashnik, Gerber, and Dowling Reference Patashnik, Gerber and Dowling2017). Seminal studies focus on how incumbents make decisions to optimally redistribute benefits among groups more generally (Lowi Reference Lowi and Ripley1966) or exploit the legislative process to obscure negative outcomes from voters to protect incumbents (Arnold Reference Arnold1990). This work rests on a set of assumptions about voters' support for legislators who support policies that prioritize constituency benefits over societal interests. However, there is limited direct evidence about how voters may trade off constituency and general interests. Although previous studies have focused on how legislatures balance competing particularistic interests to improve aggregate social welfare, primarily through norms such as logrolling and legislative exchange (Shepsle and Weingast Reference Shepsle and Weingast1981), these studies do not attempt to measure how voters evaluate the tension between district particularism and policies that promote the common good.
We study how voters respond to potential trade-offs between district-level electoral accountability and government production of policies that promote social welfare. We report the results of two experiments and two replication studies that investigate how voters react to aggregate and district welfare changes to understand how concerns about district service shape policy, particularly when it conflicts with general social welfare. For example, voters may punish incumbents who support policies with large aggregate gains when their communities lose or if their district does worse than others. Conversely, voters may punish their representatives if a policy reduces overall social welfare despite having benefits for their district.
Importantly, understanding the political consequences of a district ‘winning’ and ‘losing’ helps identify how mass attitudes can influence the way in which legislatures can adjust policies that enhance aggregate social welfare through mechanisms such as side payments to make otherwise politically infeasible options electorally palatable (Arnold Reference Arnold1990, 109). At the same time, it is unclear how this tension between particularistic and aggregate benefits plays out in the campaign context, where electoral challengers may raise criticisms about the shortcomings of a policy for an incumbent's district, even though it enhances social welfare (Arnold Reference Arnold1990, 10; Kingdon Reference Kingdon1989).
In this project, we conduct a series of survey experiments to measure how citizens evaluate legislators who support policies that provide different levels of district and societal returns. This data allows us to understand the specific mapping between these policy outputs and voters' support for their incumbent legislator. A policy proposal may be thought of as having an economic return for each constituency and a political return for the district's incumbent. We measure the mapping between these economic and political returns using survey experiments.
Our core experiment focuses on a hypothetical scenario in which a city council has passed a road project with the support of the respondent's legislator. We independently and experimentally manipulate the benefits the project returns to the city as a whole and to the respondent's home district, with a wide range of potential values for each dimension of manipulation. In this hypothetical scenario, the respondent's ‘home district’ is a smaller district (local) within the city (aggregate).Footnote 1 Although we focus on the United States in our study, this is a specific instance of the more general institutional design present in many countries and levels of government in which elected officials represent defined geographic constituencies but come together to make collective decisions.
As expected, we find that voters prefer policies with outcomes that return at least as much as they pay in taxes at the particular and aggregate levels. However, it is surprising how voters make a trade-off between the return for their home district and the aggregate. Even if policies generate substantial aggregate returns for the city, they result in less support for the incumbent legislator if they make the home district slightly worse off.
There is clear evidence that the political response to economic benefits for both city and district returns is non-linear. In particular, respondents exhibit a distinct and discontinuous sensitivity around zero: voters punish legislators who do not secure a non-negative return for either the city or the district, but they provide a sharp jump in political support when either the city or district return is net neutral. At the same time, however, the marginal return for doing much better than a net neutral return is quite low. Our core interest is understanding how a district's returns affect support for policies that produce aggregate social welfare. We confirm the critical importance of a district at least breaking even for incumbent support in two pre-registered replications. While the first replication, Experiment R1, was largely similar to Experiment 1 but with a larger sample for greater statistical power and to rule out sampling variability as the explanation for our original finding, the second replication, Experiment R2, changed both the survey sample provider and some features of the survey vignettes to address concerns about respondent attention and the scope of geographic trade-offs between local and aggregate returns.Footnote 2
This non-linear relationship between economic and political returns to a policy implies that shifting a fixed economic benefit across districts may increase the aggregate political returns to incumbents from passing a policy, thereby enhancing its political viability. Given this trade-off, we conduct a simulation whereby a hypothetical policy returns a fixed social surplus and estimate whether redistributing this pool of benefits as ‘side-payments’ to policy ‘losers’ can be used to build feasible majority coalitions. We find that legislators from a coalition that benefits from a policy can, at a modest political cost, use some of their surplus to ‘buy off’ legislators from a coalition that accepts costs to build support for the policy. These side payments can make supporting the policy electorally attractive with minimal economic and electoral benefits loss for those who control the policy agenda.
Of course, electoral competition incentivizes incumbents and challengers to make political information salient to voters and provide cues about how to process such information (Gordon and Huber Reference Gordon and Huber2007). Therefore, we extend our initial design in a second experiment by introducing experimental manipulations in which the councillor's challenger can raise different critiques, like those in a competitive campaign environment. While this non-linearity of responsiveness around net zero returns persists, critiques about the fairness of the distribution of benefits can effectively reduce support for an incumbent legislator. The magnitude of this critique effect can be enough to eliminate the gains in approval from securing a net zero return, which suggests that side payments have limitations for building majority coalitions among those receiving minimal returns and explains efforts by incumbents to advertise their performance in ways that obscure this relative performance benchmark (Grimmer, Westwood, and Messing Reference Grimmer, Westwood and Messing2015).
Policy Returns and Electoral Support
To retain office, legislators must balance their desire to enact normatively ‘good’ public policy while satisfying voter preferences. These impulses may be in tension when elected officials representing distinct geographic constituencies consider legislation that improves general welfare but makes the voters in their home constituencies worse off. If constituents prefer to receive more from distributive policies, they will punish incumbents who fail to return funds to their home districts even if those policies improve social welfare in the aggregate. Voter preferences may, therefore, undercut the willingness of legislators to produce policies that serve the general interest.
Extensive observation of elite behaviour suggests legislators believe that providing benefits to their districts is important for their electoral fortunes. For example, legislators frequently use credit claiming to inform voters of government spending in their constituencies regardless of whether they are responsible for the funds (Grimmer Reference Grimmer2013; Mayhew Reference Mayhew1976). These impulses also appear to shape the crafting of legislation and coalitions. Policies that benefit many legislative districts are more likely to receive attention on the legislative agenda and are more likely to be enacted than those that benefit only a few districts. In cases where districts experience substantial costs, legislative procedures distance legislators from those costs (Arnold Reference Arnold1990).
The pressure to provide district benefits may also help explain patterns of limited universalism in which the legislation provides benefits to all districts – albeit with some legislators getting more (Balla et al. Reference Balla2002; Berry and Fowler Reference Berry and Fowler2016) – rather than hypothetical minimum winning coalitions where the benefits are divided among a bare majority of legislators.Footnote 3 In particular, legislators can use either log rolls to ensure that all districts come out ahead in the aggregate or rely on jurisdictional property rights associated with committees to secure benefits on policy dimensions their districts care deeply about to offset losses in other less important policy areas (Bickers and Stein Reference Bickers and Stein1996; Clemens, Crespin, and Finocchiaro Reference Clemens, Crespin and Finocchiaro2015; Evans Reference Evans2004). Both approaches reduce the overall incidence of ‘losing’ districts. Historically, compensating veto players with short-term losses through ‘side payments’ has been an effective strategy for governments worldwide to build coalitions for policies that improve collective welfare in the long run (Jacobs Reference Jacobs2016; Lindvall Reference Lindvall2017).Footnote 4 These studies focus on national and state legislators, but local politicians face similar pressures. Indeed, the distribution of public resources remains a policy dimension somewhat orthogonal to national partisan conflict (Bucchianeri et al. Reference Bucchianeri2021). While these accounts are built on assumptions about how voters respond to the distribution of overall and district-specific benefits, they do not provide direct evidence about the weight given to each or the exact nature of the mapping between local or aggregate policy outcomes and incumbent support.
We identify our theoretical expectations about the importance of breaking even and relative performance. First, past work suggests that incumbents will be hurt electorally by policies that yield negative returns for their district, and that voters are less sensitive to the magnitude of gains than losses. Specifically, voters who respond to credit-claiming activities do not reward incumbents who maximize district returns (Grimmer, Messing, and Westwood Reference Grimmer, Messing and Westwood2012; Grimmer, Westwood, and Messing Reference Grimmer, Westwood and Messing2015). For example, voters appear to respond much more to claims that a legislator brought something home to the district than the amount of those awards. This is broadly consistent with the prospect theory approach in explaining individual decision-making processes (Kahneman and Tversky Reference Kahneman and Tversky1979), as voters sharply penalize losses while discounting gains, which causes a discontinuity at around the break-even point as voters reward legislators for not bringing net negative returns. Together, this informs our prediction that incumbents (who support a policy that produces aggregate welfare) will experience a discontinuous increase in support near the local break-even point as voters shift from loss aversion to discounting gains after they receive net neutral returns. However, these accounts focus on reactions to costs and benefits in a single dimension only in isolation, leaving unexplored the question of whether similar patterns prevail when policies produce costs and benefits in multiple dimensions (at both the local and aggregate levels). Therefore, our work investigates the response of the electorate as a whole to district and societal returns rather than individual responses to individual gains and losses.
Second, performances may be benchmarked with other levels, such as the average district, rather than breaking even. Therefore, if one's district performs worse than the aggregate, voters may penalize the legislator because of concerns about relative fairness. When individuals receive much less than someone else in a transaction, they may be concerned that they are being taken advantage of or duped, even if they benefit from that transaction (Vohs, Baumeister, and Chin Reference Vohs, Baumeister and Chin2007). (Of course, one salient measure of being treated unfairly is losing so others benefit, which would predict a discontinuous jump in approval when one goes from losing to breaking even or coming out barely ahead.) For this reason, voters may punish incumbents who secure positive returns for their constituents if other districts do better than their own, implying their representative is less effective (this is also a form of benchmarking). Gerber, Patashnik, and Tucker (Reference Gerber, Patashnik and Tucker2022), using a survey experimental design similar to Grimmer, Westwood, and Messing (Reference Grimmer, Westwood and Messing2015), show that when voters are informed that their incumbent secured fewer funds than the average legislator, they provide much lower evaluations than when that same information is provided without a comparison to a better-performing district. But, confirming a pattern found in earlier work, they do not find that learning one's incumbent does better than the average legislator generates more support than being average.
This discussion highlights the potential tension for incumbents between producing a policy that enhances collective welfare and district service, as well as the uncertainty in extant work about how people trade-off between aggregate and particularistic returns in evaluating incumbent politicians. However, it is unclear if incumbent support increases merely by being brought to neutral (break even) or if a constituency needs to do better than break even to generate improved incumbent support. It is also unclear whether this discontinuity will be present when a second dimension, aggregate returns, is strictly positive or if voters evaluate policies as a weighted average of aggregate and local returns instead.
Our expectations about the importance of a local constituency breaking even (despite a policy producing substantial social benefit) and the potential importance of comparisons across districts (relative performance) are derived from the prior experiments mentioned above and general observations of policy making and incumbent behaviour in a potentially competitive campaign environment. However, direct evidence about how citizens react to changes in aggregate and district returns is not readily available, and obtaining unbiased estimates of these quantities from the observed correlation between distributive outcomes and incumbent evaluations is difficult because omitted factors may explain both (for example, legislator skill and effort, incumbent vulnerability, etc.). For this reason, we adopt an experimental approach in which we can manipulate the local and aggregate returns to a public policy.
While we have not discussed electoral challengers explicitly, the potential for them to publicize instances of incumbent malfeasance and poor performance may further strengthen the incentive against those behaviours (Gordon and Huber Reference Gordon and Huber2007). There is mixed evidence that, on average, negative campaigning helps incumbents (Ansolabehere and Iyengar Reference Ansolabehere and Iyengar1995; Lau et al. Reference Lau1999), although critiques of incumbent performance are more likely to be effective when they are germane; electorally-motivated incumbents may avoid behaviours that are vulnerable to such criticism in the first place. For this reason, a remaining question is whether campaign rhetoric criticizing incumbents for poor policies is necessary to make a district's absolute and relative performance salient and whether such criticisms are more effective when germane.
Data Collection and Analysis
We designed experiments to understand how the electorate responds to incumbent support for a policy that produces various combinations of collective- (aggregate) and district-specific (local) benefits. In Experiment 1, we investigate support for incumbents across policies that provide a range of city- and district-specific returns. This design allows us to examine the potential trade-offs between these two benchmarks, test whether there are discontinuities in incumbent support around a district breaking even, and fully map the function of voter responses to changes in district and overall societal outcomes. We then conducted two independent pre-registered replications of this experiment while varying some aspects of the hypothetical scenario in the second replication. Experiment 2 builds on the first, focusing on instances in which policies that promote overall social welfare are in tension with those that produce district-specific returns. Additionally, we introduce a challenger in Experiment 2, whose criticism of an incumbent may be generic, highlights that a district is doing poorly, or explicitly compares an incumbent's performance to how others are doing.
Experiment 1: Incumbent Support is Discontinuous to a District Breaking Even and Non-Linear in Gains
Our first experiment used Lucid to recruit 500 survey respondents online.Footnote 5 Respondents were exposed to three brief vignettes describing a road project that their own (hypothetical) city council member supported.Footnote 6 We experimentally manipulated the overall net return for the city of this public works project and the net return for the respondent's geographic district in each vignette. Net returns for the city and the district were independently and randomly assigned and ranged from the average citizen at each level of aggregation losing $50 on the project to the average citizen gaining $50.Footnote 7 In addition to reading a summary of the project for each scenario, which included both figures, respondents were also presented with a figure that made it straightforward to recognize any differences in the per capita return in their district relative to the average citizen in the city.Footnote 8 Because we were interested in possible discontinuities in support of returns at or above zero, we oversampled scenarios in which the district had net neutral returns (broken even) and those slightly more than or somewhat less than zero returns.Footnote 9
After each respondent read the assigned vignette (the survey was structured so that respondents had to spend at least twenty seconds on the vignette before proceeding to the next item), they were asked three questions about their support for the project and their councillor who had voted in favour of it. First, they approved the project on a five-point scale ranging from ‘strongly disapprove’ to ‘strongly approve’. Second, using the same scale, they were asked about their approval of the incumbent councillor who supported the project. Finally, they were told to suppose their councillor was being challenged in a re-election campaign and asked their likelihood of supporting the candidate on a five-point scale, ranging from ‘I would certainly vote for the challenger’ to ‘I would certainly vote for the incumbent’. Respondents repeated this evaluation task twice, and we randomly assigned new district- and city-level returns each time. For our analyses, we rescale each evaluation variable from −1 to 1.
In Fig. 1, we plot the incumbent's mean level of approval by the size of the net district and city per capita returns. The y-axis reflects the mean level of approval, while the x-axis represents the size of the district's net return. The three lines represent whether the net city return was above (plotted with ‘+’), below (plotted with ‘−’), or at zero (plotted with ‘0’). The size of the points on each line are scaled by the sample size at each combination of city and district net return. We expect a sharp discontinuity in response to the district's return, moving from just slightly negative to just breaking even, and perhaps a further jump just above that. To highlight this hypothesis, we shade the interval between the −$1 and $0 net district returns per capita, where we expect to observe a discontinuity in responsiveness. Within this interval, we find sharp increases in support when the project returns at least as much value to the city as it costs in taxes (the lines plotted with ‘+’ and ‘0’). Specifically, when the project is net positive overall for the city, a legislator who can ensure that their district at least improves to breaking even from a −$1 district per capita return can increase their mean level of support by 0.37 (p < 0.001) on the two-point scale.Footnote 10 This result suggests that legislators have substantial incentives to work to ensure that a legislative proposal that produces positive social value produces net zero returns for their district as a minimum. By comparison, under these same conditions, we find that a legislator who moves their district's per capita return from $0 to $25 only increases their level of support by 0.05 (p = 0.52) on the same scale (there is no further discontinuity above 0). Thus, we see a substantive discontinuity around zero when the city has a positive return. We find little evidence of a ‘jump’ in approval when the net district return reaches $0 if the project is a net negative return for the city overall.Footnote 11 That is, if a project is a net loss in the aggregate, voters do not reward politicians for breaking even in their district.Footnote 12
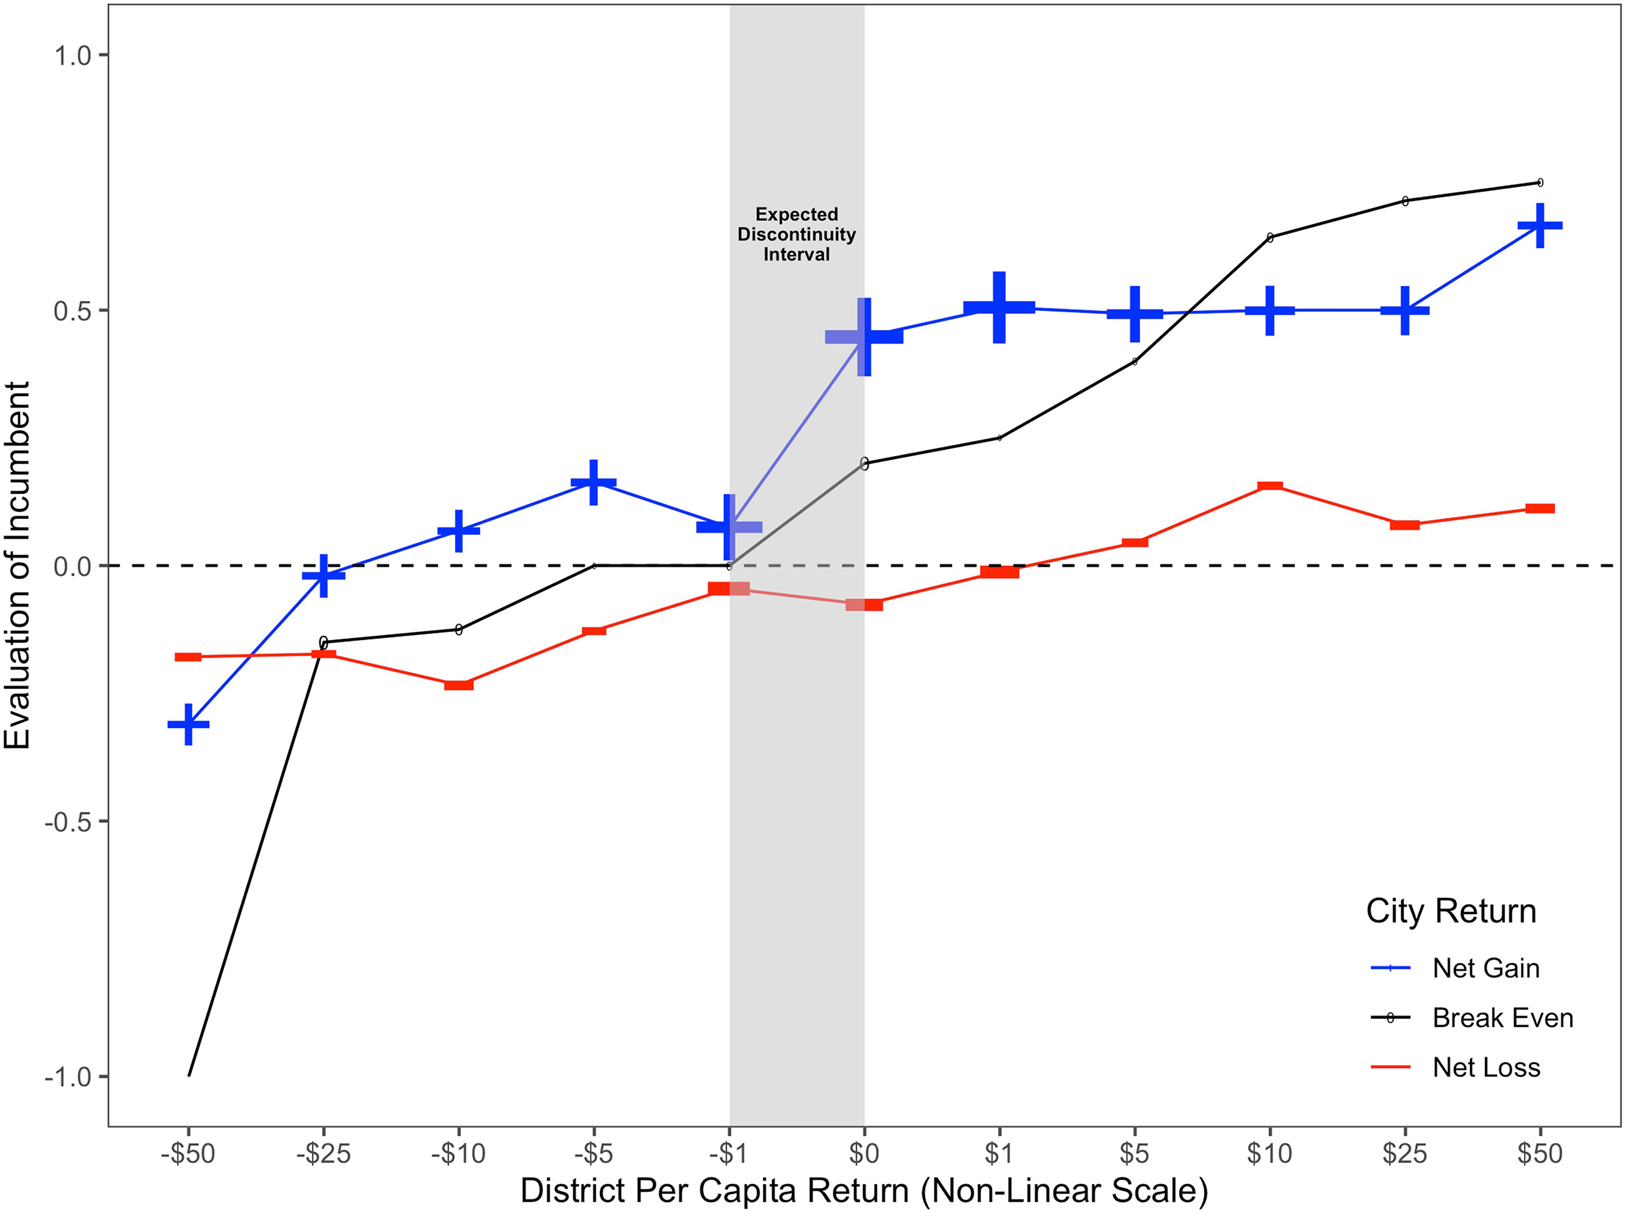
Figure 1. Mean incumbent evaluations by district per capita returns, binned by net city returns, Experiment 1.
Note: The grey shaded area is the expected discontinuity interval, which ranges from −$1 to $0 for the district per capita return. The size of the points at each coordinate reflects the sample size for the given city-district treatment pairing. District per capita returns of −$1, $0, and $1 were oversampled.
To formally characterize the nature of discontinuities in responsiveness to public policies, we analyze this data using OLS regression and predict each evaluation using measures of per capita net return for both the city and the district, along with an indicator for which vignette the respondent was evaluating (that is, the second vignette). We cluster standard errors at the respondent level to account for the fact that respondents evaluated multiple vignettes.Footnote 13 We collapse both the city and the district returns into three indicator variables: city/district loses money (return is less than 0), city/district at least breaks even (greater than or equal to 0), and city/district earns a positive return (greater than 0).Footnote 14 The negative net return category serves as the baseline category for both the city and the district. In this way, we test whether a non-negative return produces a significantly different evaluation from a positive return relative to a negative return. Additionally, we include measures of district per capita returns, city per capita returns, and an indicator for whether the district per capita return is smaller than the citywide return to test whether poor relative district performance also affects these outcomes.Footnote 15
The regression results displayed in Table 1 employ this specification. Confirming the graphical presentation, there is clear evidence that the district breaking even improves evaluations of the incumbent, willingness to vote for the incumbent, and the project evaluation – all coefficients are positive and statistically significant at p < 0.05. The effect of doing better than breaking even is also consistently positive, but it is smaller (between about 14 per cent and 56 per cent of the effect of breaking even) and not statistically significant. There are similar results for the citywide returns, but the willingness to vote for the incumbent is not statistically significant. Comparing the size of the two effects, we note that the city going from losing to breaking even is associated with an effect of 0.18 and 0.22 for the incumbent and project evaluations. On average, this is about equal to the effect of the district breaking even.
Table 1. Effect of district and citywide returns on evaluations, Experiment 1
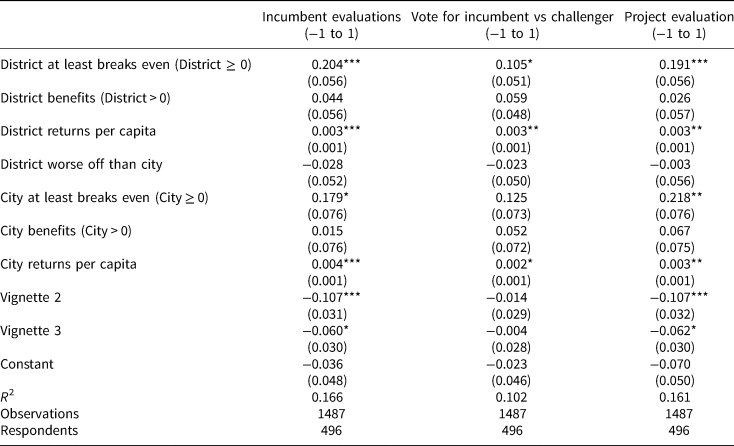
***p < 0.001; **p < 0.01; *p < 0.05.
Note: Dependent variables are listed in each column. Models were estimated using ordinary least squares regression, with standard errors clustered by the respondent.
In addition to this evidence about discontinuities around 0, the district doing worse per capita than the city has a small negative and insignificant effect on all outcomes. Finally, there is evidence of an average effect of both district and city returns – the per capita measures of both values are positively signed and statistically significant.
These results are robust to several alternative modelling choices. We added controls for party identification, education, household income, and race to the model found in Table 1, column 1, and found the main experimental results held. We also interacted each control variable with the two district cut points to identify potential heterogeneity in response to district returns. We could not find significant evidence of an interaction effect (see Table A5 in the Supplementary Materials).
We also extended this investigation in Table A7 to ascertain whether the non-linearity in the effect of district returns varied by overall returns to the city. We continued to find a significant and positive discontinuity when the district and city returns were at least zero. However, when the city experienced a negative return, we found no evidence of a discontinuity. That is, the return to a district of at least breaking even exists only for those policies that produce break even or better city returns. These results suggest that the main findings regarding district returns are conditional on a public policy design that is not a net loss for the aggregate population. We investigated whether responsiveness to city and district returns varied significantly when the district return was substantial (district per capita return greater than or equal to 10) and positive, as seen in Table A8. We found no evidence of such heterogeneity. In Table A9, we restricted our analysis to instances where the city does better than the district. Our results regarding the discontinuity at zero still hold for the district per capita returns. In Table A10, we conducted the regression in column 1 of Table 1 for each specific round of vignettes. The effect of the district's return being greater than or equal to zero was positive in all three rounds, but it was stronger in round 2 than in rounds 1 or 3 and only individually significant in round 2. Overall, the effects were consistent with those in the main analysis, suggesting that our results are not driven entirely by learning or contrast effects.
Implications of Experiment 1 for Politically Feasible Policies
So far, the results show clear discontinuities in incumbent support around a district breaking even but a much weaker relationship between further district returns and incumbent support. This pattern of results may have important implications for the strategies of legislators seeking to design politically feasible policies that promote social welfare. Empirically, legislators suffering losses are often compensated with ancillary benefits to secure their support for policies that improve overall social welfare (Lindvall Reference Lindvall2017). Our results suggest that it might be possible to increase the size of a supporting coalition through (potentially universal) side payments, in which some of the gains from a policy that enhances overall welfare, which might be concentrated in winning districts, are reallocated to losing districts to move them to break even. This, in turn, may allow legislators from those districts to switch from opposing the policy (for electoral reasons) to supporting the aggregate welfare-enhancing policy despite their district not sharing equally in the policy's benefits.
To investigate the feasibility of such side payments for building larger political coalitions, we re-analyzed our data, focusing on those cases in which overall city returns were positive. This is because we want to understand the possibility of building coalitions to support policies that enhance overall welfare and because side payments are only feasible when there is a social surplus to redistribute. To make this presentation more transparent, we collapsed the incumbent vote variable to a dichotomous indicator in which responses of ‘I will certainly vote for the incumbent’ and ‘I will probably vote for the incumbent’ are coded as ‘100’, and all other responses are coded as ‘0’. We then predicted this outcome using the same covariates from the Table 1 specification but restricted it to cases where city returns were strictly positive. Model results appear in Table A2 in the Supplementary Materials and are broadly similar to the results shown in Table 1. Of most importance, a district that at least breaks even is associated with a 24-point increase in electoral support for an incumbent who supports the policy, implying a large political return (to being brought to break even), while the coefficient on district returns per capita is only 0.13, implying a relatively minimal cost in winning districts to transferring some resources to losing districts.
We use the coefficients from this model to predict the level of support for an incumbent legislator who supports a project in the presence and absence of side payments. Side payments are a redistribution of returns from one or more winning districts (per capita returns greater than 0) to one or more losing districts (per capita returns less than 0 before side payments) that increase per capita returns in the receiving (formerly losing) districts to breaking even (per capita returns of 0). In this way, we can calculate whether the costs needed to convince a ‘losing district’ representative to support a project are politically and economically feasible for legislators from the winning districts. We want to know if there is a sufficient economic surplus that politically efficient side payments can allow electorally-minded incumbent legislators to vote for the project.
A summary of our simulation results appears in Table 2. As expected, the discontinuous increase in electoral support that an incumbent legislator receives when supporting a project that benefits the city but for which a district breaks even makes side payments a highly effective strategy for building larger political coalitions. In this hypothetical simulation, the benefit of the policy is initially concentrated solely in four districts where the per capita district return is $4 and in the remaining six districts where the per capita district return is −$1. Therefore, this policy produces, on average, a modest return of $1 per capita in the city as a whole (that is, the average of (4 × $4 + 6 × − $1)/10 = $1). The model predicts that legislators who vote for the policy will receive 65.79 per cent of the vote in the winning districts and 32.79 per cent of the vote in the losing districts (as seen in column 1 of Table 2), implying that it is politically infeasible for legislators in those losing districts to support the policy, thus likely defeating the project with only four legislators voting for it.
Table 2. Simulated electoral trade-offs from side payoffs when citywide per capita returns are $1, experiment 1
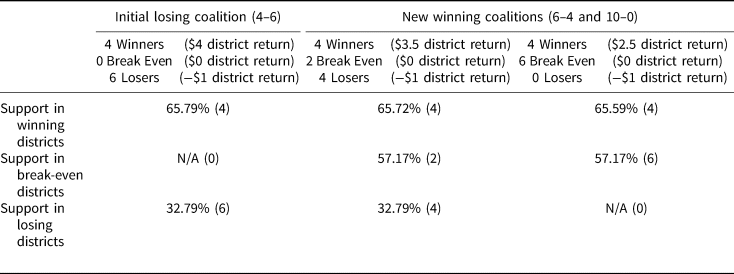
Note: This table presents the predicted electoral outcomes estimated from Table A2. We assume a 10-district city passes a policy that has a per capita net return of $1 to the city as a whole. By type (winning, break even, losing), all districts are assumed to have the same net return. Districts that come out behind have a per capita net return of −$1. In column 1, we present the vote share in which four districts come out ahead with a per capita net return of $4. In column 2, the four councillors from the winning districts provide payoffs to two losing districts so that they reach a per capita return of $0 to create a minimum winning coalition of six. In column 3, the councillors pay off six losing districts to create a universal coalition of ten.
What happens when the policy is amended through side payments or other means so that two of the formerly losing districts are brought to breaking even, creating a majority coalition of six (column 2 of Table 2)? Holding fixed the city per capita return at $1, bringing the two losing districts to break-even returns (from −$1 to $0 per capita net returns) increases the predicted support for those legislators when voting in favour of the policy from 32.79 per cent to 57.17 per cent, a 24-point increase in their support, which makes voting in favour of the policy politically tenable. For the legislators in the winning districts, this would mean that their district's per capita returns drop from $4 to $3.50 (the per capita social surplus is still $1, but now it is the average of (4 × $3.5 + 2 × $0 + 4 × − $1)/10 = $1). However, this ‘costs’ little politically; it is predicted to decrease their support by a minuscule 0.07 points. The winning districts could even share their gains with a larger number of legislators to create a universal coalition at a minimum cost. For example, if they brought all six of the formerly losing districts to even (column 3 of Table 2), the winning districts could each maintain per capita returns of $2.50 and a predicted vote share of 65.59 per cent (the per capita social surplus remains at $1, which is the average of (4 × $2.5 + 6 × $0)/10 = $1). In short, given the strong evidence of a discontinuous return to breaking even, side payments make constructing majority coalitions for policies that generate aggregate social welfare more feasible than may have previously been understood.
This simulation considers a case in which the policy's overall return is modest ($1 per capita). Given these results, it is immediately apparent that policies that generate larger social welfare returns make side payments even more feasible. For example, if a policy generated a $5 return per capita in the city, there would be ample surplus to distribute more widely and bring other districts to breaking even or better with very small losses for winning districts. Similarly, if an incumbent was concerned only about creating a majority coalition (in this case, getting the votes of six rather than ten legislators), they could concentrate their side payments on a smaller subset of legislators and keep more of the surplus for themselves.
At the same time, this simulation assumes that side payments are fully efficient, but this is an unreasonable assumption. For example, if a road generates a large average social surplus, this is because it produces a public value. A simple cash subsidy to other distributive programmes in a legislator's district might not generate as much social value. However, given the finding that the effect on a legislator's support for incremental district returns above 0 is small, even economically inefficient side payments may be politically efficient, particularly when programmes generate large social returns. For example, suppose that side payments are 50 per cent less efficient than the programme as a whole. This means that bringing ‘losing’ districts to break even costs twice as much, reducing the remaining social surplus for winning districts by a factor of two. In our simulation, even these economically inefficient transfers (which reduce the per capita return in the winning districts from $2.50 to $1.25) reduce the support for the winning district incumbent by only 0.2 points. Overall, this simulation exercise demonstrates that the penalty for doing worse than breaking even, coupled with the modest returns for doing incrementally better in a district that at least breaks even, gives legislators the possibility of reallocating social surpluses through side payments to build majority coalitions that make welfare-enhancing policies feasible.
Pre-Registered Replication of Experiment 1
In November 2020, we fielded a pre-registered replication (Experiment R1) of this study to confirm that our findings were not the result of sampling variability or respondent inattention. Lucid provided the sample; its larger size allowed us to identify treatment effects more precisely. In this fielding, we also included a pre-treatment attention check that required subjects to recall a salient detail from an unrelated short newspaper article and removed subjects who failed this attention check before the experiment (31.5 per cent of total entrants failed), reducing concerns that the results were due to inattentive subjects.Footnote 16
In the Supplementary Materials, we present our replicated analyses. The results from this replication largely confirmed our analyses in Tables 1 and 2 and Figure E1, with some modest differences (see Figures E2, E4, and Tables B1–B3).Footnote 17 First, as Figure E2 demonstrates, we find a jump in approval of the incumbent when district and city returns each reach a net neutral per capita return, but the effect of a district at least breaking even is only present graphically when the citywide return is positive. Our replication of Table 2's analysis in Table B1 finds a significant increase when the district at least breaks even, but this effect is smaller than the one estimated in Experiment 1. Finally, when we limit the model in Table B2 to those scenarios in which the project generates net positive returns for the city to estimate the potential for side payments to be used to bring districts to the ‘break even’ point, we find in Table B3 that getting losing legislators to zero still only costs incumbents a fraction of support, while providing sizable gains for initial losers.
Second Pre-Registered Replication of Experiment 1
In May of 2023, we conducted a second pre-registered replication (Experiment R2) of Experiment 1 using a different online convenience sample provided by Bovitz to confirm that our results are robust across samples and to differences in both type of policy and geographic scope.Footnote 18 While this replication had a similar design to the previous experiments, there were three important changes.Footnote 19 First, we change the hypothetical scenario from a road project to a different public works project that installs lead-free service pipes to reduce the risk of lead contamination from drinking water. While voters drive on roads outside of their home district, thus potentially affecting their evaluation of the aggregate net returns of a road project, the benefits of the water policy are more clearly localized because individuals are much less likely to personally benefit from using another resident's water supply. Second, we change the aggregate jurisdiction from a city to a county or a state (randomly assigned), which are much larger jurisdictions with more geographically distant residents that voters may have less affinity towards. Finally, unlike prior studies, the potential aggregate (county or state) returns were always positive, while we included a wider range of district net returns (from −$55 to $55 per capita).Footnote 20 In this experiment, respondents evaluated five vignettes rather than three, as in the prior two studies, to leverage a within-subjects design.
We find that our previous results hold for this replication. As Figure E5 demonstrates, we see a jump in incumbent evaluations when the district returns become net neutral at the county and state levels. Tables C1 and C2 confirm this graphical presentation, with the district at least breaking even and the district being greater than 0 are significant and positive for both the county and the state. When comparing the magnitude of the district at least breaking even for the county and the state, Table C3 shows that the discontinuity (district at least breaks even X state) is around 0.036 points larger when the aggregate jurisdiction is the state for the incumbent and project evaluation dependent variables, but this difference is not statistically significant.
Because of the similarity between the county and state treatment results, we pool the county and state conditions in the remainder of our robustness analyses. We conduct a fixed effects model with the individual as the unit for the fixed effect in Table C4 because each respondent sees five vignettes with district net returns: very bad, somewhat bad (around the discontinuity point), break even (net neutral), somewhat good (around the discontinuity point), and very good. This within-subjects model strongly replicates our previous findings for all three dependent variables, with all variables in the model being statistically significant. When the district at least breaks even or benefits, the respondents evaluate the legislator and the project positively and are more willing to vote for the incumbent versus the challenger. To address concerns that these results might be due to contrast effects that arise when evaluating multiple scenarios, we restricted our analysis to the first two vignettes the respondent viewed in Table C5. We still found strong evidence of a discontinuity at the net neutral point for district returns.
Experiment 2: Challenger Criticisms of Incumbent Performance
Experiment 1 and the two replication studies provide robust evidence that incumbents who fail to produce policy that is at least break even for their home district lose electoral support, particularly when the policy is good for the aggregate political unit (city, county, or state) as a whole. In the scenarios used in these experiments, the challenger was a passive actor who was presented as an alternative to the incumbent. In Experiment 2, we investigate whether a more active challenger who makes arguments about incumbent performance affects the relationship between district and overall policy returns and incumbent support. This extension allows us to investigate a potentially more generalizable scenario in which political candidates argue and provide information that makes citizens aware of important public policy details.
Experiment 2 follows the basic template of the first experiment, with one key alteration: to simulate the effect of campaign rhetoric, we included a randomized challenger critique.Footnote 21 In the control condition, the challenger is a passive actor, as in Experiment 1, and does not criticize the incumbent. In the other three conditions, the challenger offers (1) a generic criticism (‘Our councilor isn't doing a good job. We're not on the right track, and it's time for a change.’), (2) a district performance criticism (adding to the generic criticism, ‘This project is a bad deal for the district.’), or (3) a fairness criticism (adding to the generic criticism, ‘Our district puts in the same amount of money as other districts, but some other district is getting a lot more.’) After the respondent read their assigned treatment, including any criticism if assigned, they were asked to provide their likelihood of supporting the incumbent's re-election in the upcoming campaign on the same five-point scale used in Experiment 1, as well as their approval of the project on the same five-point scale. Respondents were also asked to provide their assessments of the favourability of the project and the incumbent on 0–100 thermometer scales. The order of these questions was randomized.Footnote 22
Experiment 2 was fielded in August 2020 using the online survey vendor YouGov. To analyze the data from this experiment, we adopt the same approach as used for the first experiment, predicting each outcome as a function of the city return, district return, and criticism treatment variables. We operationalized district and city returns in per capita terms and included indicators for whether the district return was at least neutral or greater than zero and whether the district return was less than the city return. Because this experiment was fielded in two separate waves, we also included an indicator for the wave to control for possible differences between the respondents in the two fieldings.
We also identified whether the criticism was germane to the district performance and fairness criticism. A criticism was germane when it corresponded to the situation described in the vignette (the generic criticism was always germane.) The district performance criticism was coded as germane when the district return was negative. The fairness criticism was coded as germane when the district per capita return was less than the citywide per capita (average) return. We separately estimate the effects of these two criticisms for when they were and when they were not germane.
Table 3 displays the results of this analysis.Footnote 23 Setting aside the various criticism treatments for the moment, we find evidence consistent with our previous experiment that respondents display discontinuities in responsiveness around zero. For all four outcome measures spanning evaluations of the policy and incumbent, outcomes are discontinuously and substantially more negative when the district return is negative compared to when it breaks even. There is also an effect of a district's per capita returns (the coefficients are consistently positive), but no evidence exists that doing better than breaking even provides additional positive returns. Unlike the first experiment, there is significant evidence that the evaluation of the policy and the incumbent suffers when a district does worse than the city. Reading across Table 3, the negative effect of a district doing worse than the city is comparable in size to the positive effect of a district at least breaking even. Finally, unlike in Experiment 1, the effect of city per capita returns is positive but not consistently significant, although we have a much more limited range of returns in this experiment.
Table 3. Effect of challenger criticisms on evaluations, Experiment 2
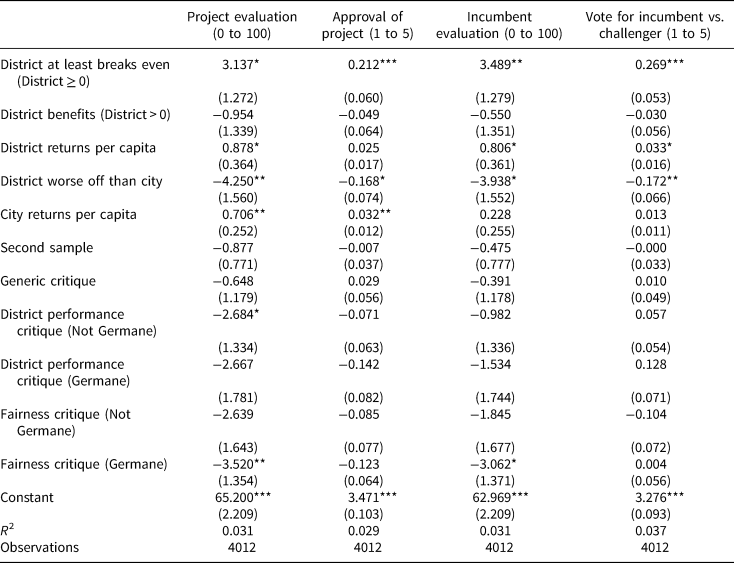
***p < 0.001; **p < 0.01; *p < 0.05.
Note: Dependent variables are listed in each column. Models were estimated using ordinary least squares regression, with standard errors clustered by respondent.
When considering the critiques from the challenger, we find evidence that some critiques appear more effective than others. For example, generic criticism is not more effective than no critique being offered. Across all four specifications shown in Table 3, the estimates are irregularly signed, and none is close to being negative and significant. Similarly, the district performance criticism is not consistently effective. While there is one case in which the non-germane district performance criticism is negatively signed and significant (the −2.68 coefficient for project evaluation in column 1), the effect is nearly the same size as the district performance criticism when it is germane (−2.67). In no case are the two effects distinguishable. Of course, both Experiment 1 and these results provide clear evidence that a district doing worse than breaking even directly affects evaluations. This implies that respondents do not generally need to be reminded about poor district performance, which is an ominous sign for a poorly performing incumbent, regardless of whether a challenger calls attention to this programme feature.
The one exception to this characterization is the effect of the fairness criticism, which highlights that other districts benefit disproportionately from the project. For evaluations of the project using either the 0–100 rating or the 5-category discrete response options item, as well as for the evaluation of the incumbent on the 0–100 scale, the effect of the germane fairness criticism is negative and significant or near significant. For example, per column 3, a germane fairness criticism reduces incumbent evaluations by 3 points (p < 0.05) on a 101-point scale. At the same time, a district at least breaking even increases it by 3.5 points. This means that 88 per cent of the politician's increased public support from at least breaking even is neutralized if a challenger accurately criticized the unfairness of the policy for the district. When we restrict our attention to scenarios where the district at least broke even in Table D2, a germane fairness criticism reduces support for incumbents by 4 points. These estimated effects are generally larger than those of the non-germane fairness criticism. However, the differences between the estimated coefficients are not significant at conventional levels (one-tailed p-values for tests of differences are 0.25 for incumbent evaluations in Table 3 and 0.10 in Table D2).
Besides highlighting the potential role of rhetoric in making inter-district comparisons salient in the project and incumbent evaluations (Gerber, Patashnik, and Tucker Reference Gerber, Patashnik and Tucker2022), the other implication of this pattern of results is the feasibility of constructing larger political coalitions using side payments. In our analysis of Experiment 1, we showed that there were outsized returns to a district breaking even, such that an incumbent might be able to find political cover in voting for a programme that generated positive social returns so long as her district also, at least, broke even. Per the results shown here, however, such a bargain leaves the incumbent vulnerable to fairness criticism (which is also the case when the district return is negative). If one seeks to promote good public policy, these results also provide hope. That is because the penalty for doing worse than average when criticized as such is offset somewhat by large social returns and merely breaking even. For example, per column 3, a legislator who votes for a project that gets her district to even but generates a social return of $4 per capita is evaluated at around 60 on the favourability scale. She generates about 0.9 units of additional support for the policy producing $4 in social value, and 3.5 points for at least breaking even. By contrast, she loses 3.9 points for doing worse than average and an additional 3.1 points for being criticized for doing worse than average. Assuming all else were held equal, a legislator who votes for this policy only decreases their support by 2.6 points.
Conclusion
The electoral pressure to promote constituents' interests is a potential hurdle to an individual legislator's willingness to support legislation that promotes the welfare of the population as a whole. Although scholars of representation have long recognized this tension, our experiments measure how citizens' preferences regarding distributive spending may help explain politically feasible policies for allocating resources. In particular, voters have a strong aversion to their district suffering a net loss from projects. Even a trivial loss for their district is enough to punish an incumbent for supporting the policy. Respondents provide significantly greater support to those incumbents who ensure their district at least breaks even in terms of the value it receives compared to the revenue it contributed to social spending. By contrast, the marginal returns measured in support for legislators who bring home more benefits to their districts are quite small.
The absence of large increases in support for those legislators who secure returns greater than breaking even presents incumbents with a previously unappreciated strategy for creating politically feasible policies. Scholars have recognized the importance of distributing side payments to create winning coalitions that can pass public reforms (Lindvall Reference Lindvall2017) rather than creating minimum winning coalitions in which the smallest number of legislators needed to pass a bill hoard the benefits among themselves. These results suggest that legislatures may have strategic political reasons to move towards norms of universalism when designing public policies. Incumbents who receive just enough benefits so that their districts break even receive enormous gains in electoral support. Furthermore, those incumbents who choose to provide side payments to their colleagues, which could come in the form of any number of particularistic benefits, hardly face any serious loss in electoral support for doing so. In this way, legislative coalition leaders are incentivized to strike bargains to adjust their policies to not leave out members who are close to breaking even.
At the same time, our experiments show that a competitive electoral environment may limit the set of politically feasible policies. Challengers who draw attention to incumbents who garner benefits that are less than what the average district in the city receives can damage those incumbents. This tactic is effective, even when an incumbent's district at least breaks even. Thus, incumbents may be less likely to be ‘bought off’ by side payments from legislators in a coalition if voters have an aversion to seeing other citizens receive more resources. This, in turn, may explain why legislators go to great lengths to promote their role in securing resources for their districts, even though that communication does little to communicate relative district performance (Grimmer, Westwood, and Messing Reference Grimmer, Westwood and Messing2015). Additionally, this incentive structure may explain why observing the total magnitude of government spending in different districts is so difficult because, perhaps, such information facilitates comparative benchmarking.
We use only survey-experimental methods in our studies. The key advantage of this approach is that it provides us with precise control of the district and aggregate returns to estimate the discontinuous return to a constituency breaking even without concerns about bias generated by omitted variables or unobserved heterogeneity. While the strength of this design is its internal validity, particularly given the consistent replication of our findings, we acknowledge that there may be limitations to its external validity. Other factors, apart from those that we manipulate, can affect elections, which would likely attenuate the treatment effects we estimate. Another concern might be that voters may not be well informed of the different local and aggregate returns to policy in actual elections, although strategic incumbents and challengers may publicize such information, as in Experiment 2. More generally, we believe these experiments complement and help understand patterns found in prior observational analyses without many of the threats of inference present in those works.
More broadly, these findings have implications for the study of distributive politics and representation. While citizens' preferences for distributive returns are discontinuous around the break-even point, citizens are also motivated to punish incumbents when they fall behind other citizens in their polity. These preferences could impose competing pressures on incumbents when designing public policy. A legislator must choose not only between what is good for their district and what is good for the polity as a whole but also consider whether their citizens get back as much as they contribute and whether other citizens are getting more than their constituents. Future work should consider how such information could be transmitted to voters. In our design, we use a hypothetical electoral campaign. But, as local news reporting resources continue to dwindle (Peterson Reference Peterson2021), the ability of citizens to learn the details of distributive spending will likely diminish. Finally, our results provide a potential campaign tactic for legislators with precarious re-election prospects. By focusing on relative local gains rather than total benefits, incumbents who bring superlative resources to their constituents may improve their chances of remaining in office.
Supplementary material
The supplementary material for this article can be found at https://doi.org/10.1017/S0007123423000522.
Data availability statement
Replication data for this article can be found in Harvard Dataverse at: https://doi.org/10.7910/DVN/VOAPGE.
Acknowledgements
The authors gratefully acknowledge the helpful comments and suggestions of the editor and reviewers. Previous versions of this paper were distributed with the title: ‘The Discontinuous Return to Simply Breaking Even: Experimental Evidence about Policy and Candidate Evaluations and Implications for Politically Feasible Welfare-Enhancing Policies.’
Financial support
This data was collected with the financial support of the Institution for Social and Policy Studies and the Center for the Study of American Politics at Yale University.
Competing interests
None.


 Open access