

Soft law regulatory devices like metrics have proliferated in the governance of corporate sustainability performance in recent decades (Déjean, Gond, & Leca, Reference Déjean, Gond and Leca2004; Mehrpouya & Samiolo, Reference Mehrpouya and Samiolo2016). Such proliferation is also noticeable in financial markets, in particular within responsible investment (RI) markets. Here numerous rankings, indices, and ratings have been developed to aid stock selection (Chatterji, Durand, Levine, & Touboul, Reference Chatterji, Durand, Levine and Touboul2016). These metricsFootnote 1 provide information to investors but also serve to incentivize rated companies to improve their sustainability performance (Rowley, Shipilov, & Greve, Reference Rowley, Shipilov and Greve2017). Such reactivity has been defined as changing organisational behaviour to better conform to the criteria of measurement (Espeland & Sauder, Reference Espeland and Sauder2007; Pollock, d’Adderio, Williams, & Leforestier, Reference Pollock, D’Adderio, Williams and Leforestier2018; Rowley et al., Reference Rowley, Shipilov and Greve2017), for example, by trying to increase sustainability transparency and/or performance.
Organisations react to metrics to obtain favorable outcomes in the process of being publicly measured and ranked (Espeland & Sauder, Reference Espeland and Sauder2007; Sauder & Espeland, Reference Sauder and Espeland2009). Chatterji and Toffel (Reference Chatterji and Toffel2010), for example, show that companies that initially receive a poor rating by a sustainability metric subsequently improve their environmental performance. Reactivity is driven by the motivation of the rated companies to reduce information asymmetries regarding sustainability performance (Chatterji & Toffel, Reference Chatterji and Toffel2010; Sharkey & Bromley, Reference Sharkey and Bromley2015) and seen as an opportunity to signal that the “standards of desirability” (Graffin & Ward, Reference Graffin and Ward2010; Thompson, Reference Thompson1967: 84) have been met. Many company managers believe that sustainability metrics are used by investors, consumers, and other stakeholder groups to judge their sustainability performance (Carlos & Lewis, Reference Carlos and Lewis2018), which increases their “allure” (Sauder & Espeland, Reference Sauder and Espeland2009). Nonetheless, not all firms are equally capable of responding to metric providers. Participation in sustainability metrics is time consuming (Carlos & Lewis, Reference Carlos and Lewis2018) and requires the development of specific sets of knowledge and expertise (Pollock et al., Reference Pollock, D’Adderio, Williams and Leforestier2018). Most metric providers engage in dialogue with rated companies, for instance, to request information on sustainability performance or to inform them about new criteria. This dialogue may further influence reactivity (Pollock et al., Reference Pollock, D’Adderio, Williams and Leforestier2018).
Whereas multiple studies consider either the motivation to react (Espeland & Sauder, Reference Espeland and Sauder2007; Sauder & Espeland, Reference Sauder and Espeland2009) or the capacity to react (Elsbach & Kramer, Reference Elsbach and Kramer1996), we don’t know if motivation is sufficient for reactivity to occur; whether capacity can substitute for a lack of motivation; or what the role of dialogue is in reactivity. In this article, we propose that motivation and capacity interact to influence reactivity in a nonlinear, configurational way (Misangyi, Greckhamer, Furnari, Fiss, Crilly, & Aguilera, Reference Misangyi, Greckhamer, Furnari, Fiss, Crilly and Aguilera2017) against the background of dialogue between a metric provider and target companies. We therefore pose the following research question: How do dialogue with a metric provider, target company motivation, and target company capacity combine to produce reactivity?
We employ a configurational method, fuzzy set qualitative comparative analysis (fsQCA), to study reactivity to a sustainability metric, the FTSE4Good Index. Our configurational approach allows us to disentangle the interaction between dialogue, motivation, and capacity and shows that four different configurations underlie the presence or absence of reactivity. Furthermore, we use the configurations obtained in our analysis to examine qualitative differences in the intra-organisational use of metrics. We find that each configuration corresponds to differences in the use of the metric as a performance feedback tool and in the way organisational capacity to measure and report sustainability is being developed.
Our research contributes to theory on the private governance of corporate sustainability through metrics (Mehrpouya & Samiolo, Reference Mehrpouya and Samiolo2016). We show that reactivity to sustainability metrics is configurational; that is, it is dependent on different combinations of factors leading to different types of (non)reactivity. A configurational perspective on reactivity allows us not only to empirically examine causal complexity but also to theorize its implications for the study and practice of private governance of corporate sustainability. Our focus on dialogue with the metric provider offers further insights into the communicative action perspective (Ferraro & Beunza, Reference Ferraro and Beunza2018; Scherer & Palazzo, Reference Scherer and Palazzo2007, Reference Scherer and Palazzo2011). We show how quantitative tools like metrics open up a space for deliberation not only between the metric provider and the rated company but also within the company. Last, we provide practical implications for “ranking entrepreneurs” (Rindova, Martins, Srinivas, & Chandler, Reference Rindova, Martins, Srinivas and Chandler2018) seeking to create new metrics and critically discuss the role of sustainability metrics in the normative orientation of companies toward sustainability (Schuler, Rasche, Etzion, & Newton, Reference Schuler, Rasche, Etzion and Newton2017).
THEORETICAL BACKGROUND
Despite enduring criticisms (Esposito & Stark, Reference Esposito and Stark2019), the regulation of multinational corporations through soft law instruments like metrics has continued unabated in recent decades (Mehrpouya & Samiolo, Reference Mehrpouya and Samiolo2016). In the RI market, multiple stock market indices, such as the Aspi Eurozone, Dow Jones Sustainability Index (DJSI), FTSE4Good Index, and MSCI ESG indices, have been developed to measure the sustainability performance of listed firms and to aid stock selection by responsible investors (Déjean et al., Reference Déjean, Gond and Leca2004). The distinguishing features of sustainability indices are their emphasis on measurement of sustainability performance based on preset, but often competing, measurement criteria (Chatterji et al., Reference Chatterji, Durand, Levine and Touboul2016) and their role in providing information to investors in the RI market (Hawn, Chatterji, & Mitchell, Reference Hawn, Chatterji and Mitchell2018). Another feature that has not received much attention owing to its private nature is the “behind the scenes” dialogue between metric providers and rated companies, which can range from information requests regarding company performance to explanation or contestation of measurement criteria and outcomes (Pollock et al., Reference Pollock, D’Adderio, Williams and Leforestier2018). Many, though not all, sustainability metrics feature such a process of engagement and dialogue, which has similar features to social shareholder engagement (Goodman & Arenas, Reference Goodman and Arenas2015; Logsdon & Van Buren, Reference Logsdon and Van Buren2009) and forms the background against which reactivity toward sustainability metrics unfolds.
The regulatory role of metrics stems from their ability to produce reactivity—the change in behaviour in conformance with measurement criteria that occurs as a result of being measured and ranked (Espeland & Sauder, Reference Espeland and Sauder2007; Rowley et al., Reference Rowley, Shipilov and Greve2017: 815). Most research on reactivity has focused on the motivation of targeted companies to participate in the measurement process and to change their behaviour as a result. Participation is driven by the motivation to reduce information asymmetries (Akerlof, Reference Akerlof1970; King, Lenox, & Terlaak, Reference King, Lenox and Terlaak2005) and by beliefs about the importance of sustainability performance to investors (Flammer, Reference Flammer2013). Metrics reduce uncertainty by providing simple information to stakeholders regarding aspects of performance that are difficult for them to assess (Rindova et al., Reference Rindova, Martins, Srinivas and Chandler2018). Sustainability metrics signal that sustainability performance meets “the standard of desirability” (Graffin & Ward, Reference Graffin and Ward2010: 331). Metrics can create status orderings (Rindova et al., Reference Rindova, Martins, Srinivas and Chandler2018), which affect even nonmeasured companies (Sharkey & Bromley, Reference Sharkey and Bromley2015). Inclusion in sustainability indices is often an explicit goal and may be signaled to investors and wider audiences by including the logos and names of the various sustainability indices in corporate reporting (Carlos & Lewis, Reference Carlos and Lewis2018; Slager, Gond, & Moon, Reference Slager, Gond and Moon2012).
There is conflicting evidence regarding the degree to which information provided by sustainability indices influences investor behaviour in practice. In one of the most comprehensive studies to date, Hawn et al. (Reference Hawn, Chatterji and Mitchell2018) show that inclusion or deletion from the DJSI has a limited effect on stock market reactions, even though benefits of inclusion have increased over time for non-US companies. A recent survey shows that investors do use the data provided by sustainability metrics in their investment decisions, because they believe that this information is financially material (Amel-Zadeh & Serafeim, Reference Amel-Zadeh and Serafeim2018). The materiality of specific issues (e.g., carbon emissions, human rights, board diversity) varies across companies and industries, and the financial consequences of good ratings depend on the materiality of the issue being rated (Khan, Serafeim, & Yoon, Reference Khan, Serafeim and Yoon2016).
Reactivity is particularly strong when organisations expect negative consequences from poor evaluations (Chatterji & Toffel, Reference Chatterji and Toffel2010) because they fear adverse impacts on consumer or investor behaviour (Mackenzie, Rees, & Rodionova, Reference Mackenzie, Rees and Rodionova2013; Sharkey & Bromley, Reference Sharkey and Bromley2015). Especially in the case of rankings in university education settings, where a single or limited number of rankings exists, reactivity is strong due to anxiety about their ability to influence student choice (Espeland & Sauder, Reference Espeland and Sauder2007; Sauder & Espeland, Reference Sauder and Espeland2009). Rowley et al. (Reference Rowley, Shipilov and Greve2017) further argue that external metrics can be used to set “aspiration levels,” where companies compare their performance against the performance of their peers. Performance feedback theory suggests that performance below the reference group is likely to draw attention from senior management (Greve, Reference Greve2003), thus increasing the “anxiety” produced by metrics (Espeland & Sauder, Reference Espeland and Sauder2016).
Furthermore, limited reactivity to external metrics occurs in situations of poor evaluation performance coupled with below average financial performance (Rowley et al., Reference Rowley, Shipilov and Greve2017). In such circumstances, companies struggle to devote the time and resources to react to metrics and have limited slack to do so. In light of these findings, recent studies have focused on the capacity of targeted companies to react to metrics. Participation in sustainability metrics is time consuming (Carlos & Lewis, Reference Carlos and Lewis2018). Companies require a certain amount of financial slack, human resources, administrative knowledge, and organisational capabilities to respond. In a study on the DJSI, Searcy and Elkhawas (Reference Searcy and Elkhawas2012) note that companies created specific committees, spend considerable time collecting and collating internal performance data, and undertook detailed reviews of performance evaluations related to the index. The availability of dedicated human resources—for example, corporate social responsibility (CSR) managers—plays a key role in the capacity to respond (Crilly, Zollo, & Hansen, Reference Crilly, Zollo and Hansen2012). Companies with slack resources will find it easier to develop such knowledge and expertise. Existing stakeholder management capacity will also help accommodate the process of responding to metric providers’ demands for data and information.
A Configurational Approach
Given our interest in the interplay between motivation and capacity, against the backdrop of dialogue, we adopt a configurational approach. Configurational perspectives highlight causal complexity, including the idea of conjunctural causation, where “multiple causal attributes combine into distinct configurations to produce an outcome of interest” (Misangyi et al., Reference Misangyi, Greckhamer, Furnari, Fiss, Crilly and Aguilera2017: 257). The configurational perspective builds on set theory and qualitative comparative analysis (QCA). Set theory is used to conceptualize organisations as configurations, or combinations, of theoretical attributes (Fiss, Reference Fiss2011; Ragin, Reference Ragin2000). The combined effect of these attributes on the outcome of interest is the main object of study. In our setting, companies may (not) be highly motivated to participate in sustainability metrics (they are [not] part of the set of highly motivated companies); they may (not) have developed capacity to respond to metric providers (they are [not] part of the set of high-capacity companies). We are interested in how different configurations of these attributes combine to produce reactivity.
QCA is designed to assess such conjunctural causation empirically (Fiss, Reference Fiss2011; Misangyi et al., Reference Misangyi, Greckhamer, Furnari, Fiss, Crilly and Aguilera2017). Using Boolean algebra, QCA can distinguish “causal recipes”: the different combinations of attributes that lead to the outcome of interest. In small-N approaches, familiarity with the cases forms the basis for theorizing about the differences between configurations. In particular, small-N QCA can be used to develop a richer account of comparative cases by using Boolean algebra to look for patterns, which can be explained based on in-depth case knowledge. In the following pages, we explain how we use a small-N, fuzzy set QCA approach to analyze how different configurations of dialogue, motivation, and capacity are associated with reactivity. In addition, we extend the QCA analysis by undertaking a further qualitative analysis of the differences between cases assigned to configurations, paying particular attention to the intraorganizational use of metrics.
METHODS, CONTEXT, AND DATA
Our focal case in this article, the FTSE4Good Index, provides investors with a list of companies with good sustainability performance according to a limited set of criteria, while at the same time the index team interacts with companies that do not meet the set criteria. We designed an in-depth case study of a limited number of companies that were, or had been, included in the index between 2003 and 2010, drawing on a wide range of data sources.
Case Context
The FTSE4Good Index was launched in 2001 by FTSE Group (now FTSE Russell). The index is used by investors to compare the performance of the selected companies against wider public equity markets. The index aims to identify companies with good sustainability practices for investors, while at the same time driving up its inclusion criteria in an effort to encourage companies to improve their sustainability performance (Slager et al., Reference Slager, Gond and Moon2012). For the period under study (2003–10), the performance categories cover environmental management, human and labor rights protection, countering bribery, climate change mitigation, and supply chain labor standards. All listed companies that meet a minimum scoring benchmark set by FTSE on criteria related to these categories are included in the index. It is updated twice a year to include new companies that meet the inclusion criteria and exclude those that no longer comply. In the period under study, the FTSE relied on research by social rating agency Eiris (now Vigeo Eiris) to determine whether eligible companies met the inclusion criteria.
The index criteria have been gradually updated since the inception of the index to reflect the changing nature of sustainability demands. This led to situations where companies previously included in the index failed to meet newly updated criteria. These companies were not automatically deleted but instead were entered into a so-called engagement program. They received communication from FTSE stating that if they did not work toward meeting the criteria, they would be deleted from the index. The metric provider thus seeks reactivity from target companies in an explicit way:
Each year we write to all the companies in the index—between 850 and 900—to all their Chief Executives or Chairmen and also to the practitioners that we deal with on a more direct basis, to say: “you are still in the index, that’s terrific”
(FTSE RI team member).We send the certificate [of inclusion] to companies once a year in March. So the CEO will get that but he will also get a letter that says “your company needs to meet certain criteria to remain in the index”
(FTSE RI team director).Data Collection and Analysis
The research integrates various data sources, including forty-three semistructured interviews, in situ observations, archival material, and collection of secondary data. Table 1 provides an overview of the data sources and their use in the analysis, and Table 2 provides further details on the thirty case companies.
Table 1: Data Sources and Use in Data Analysis
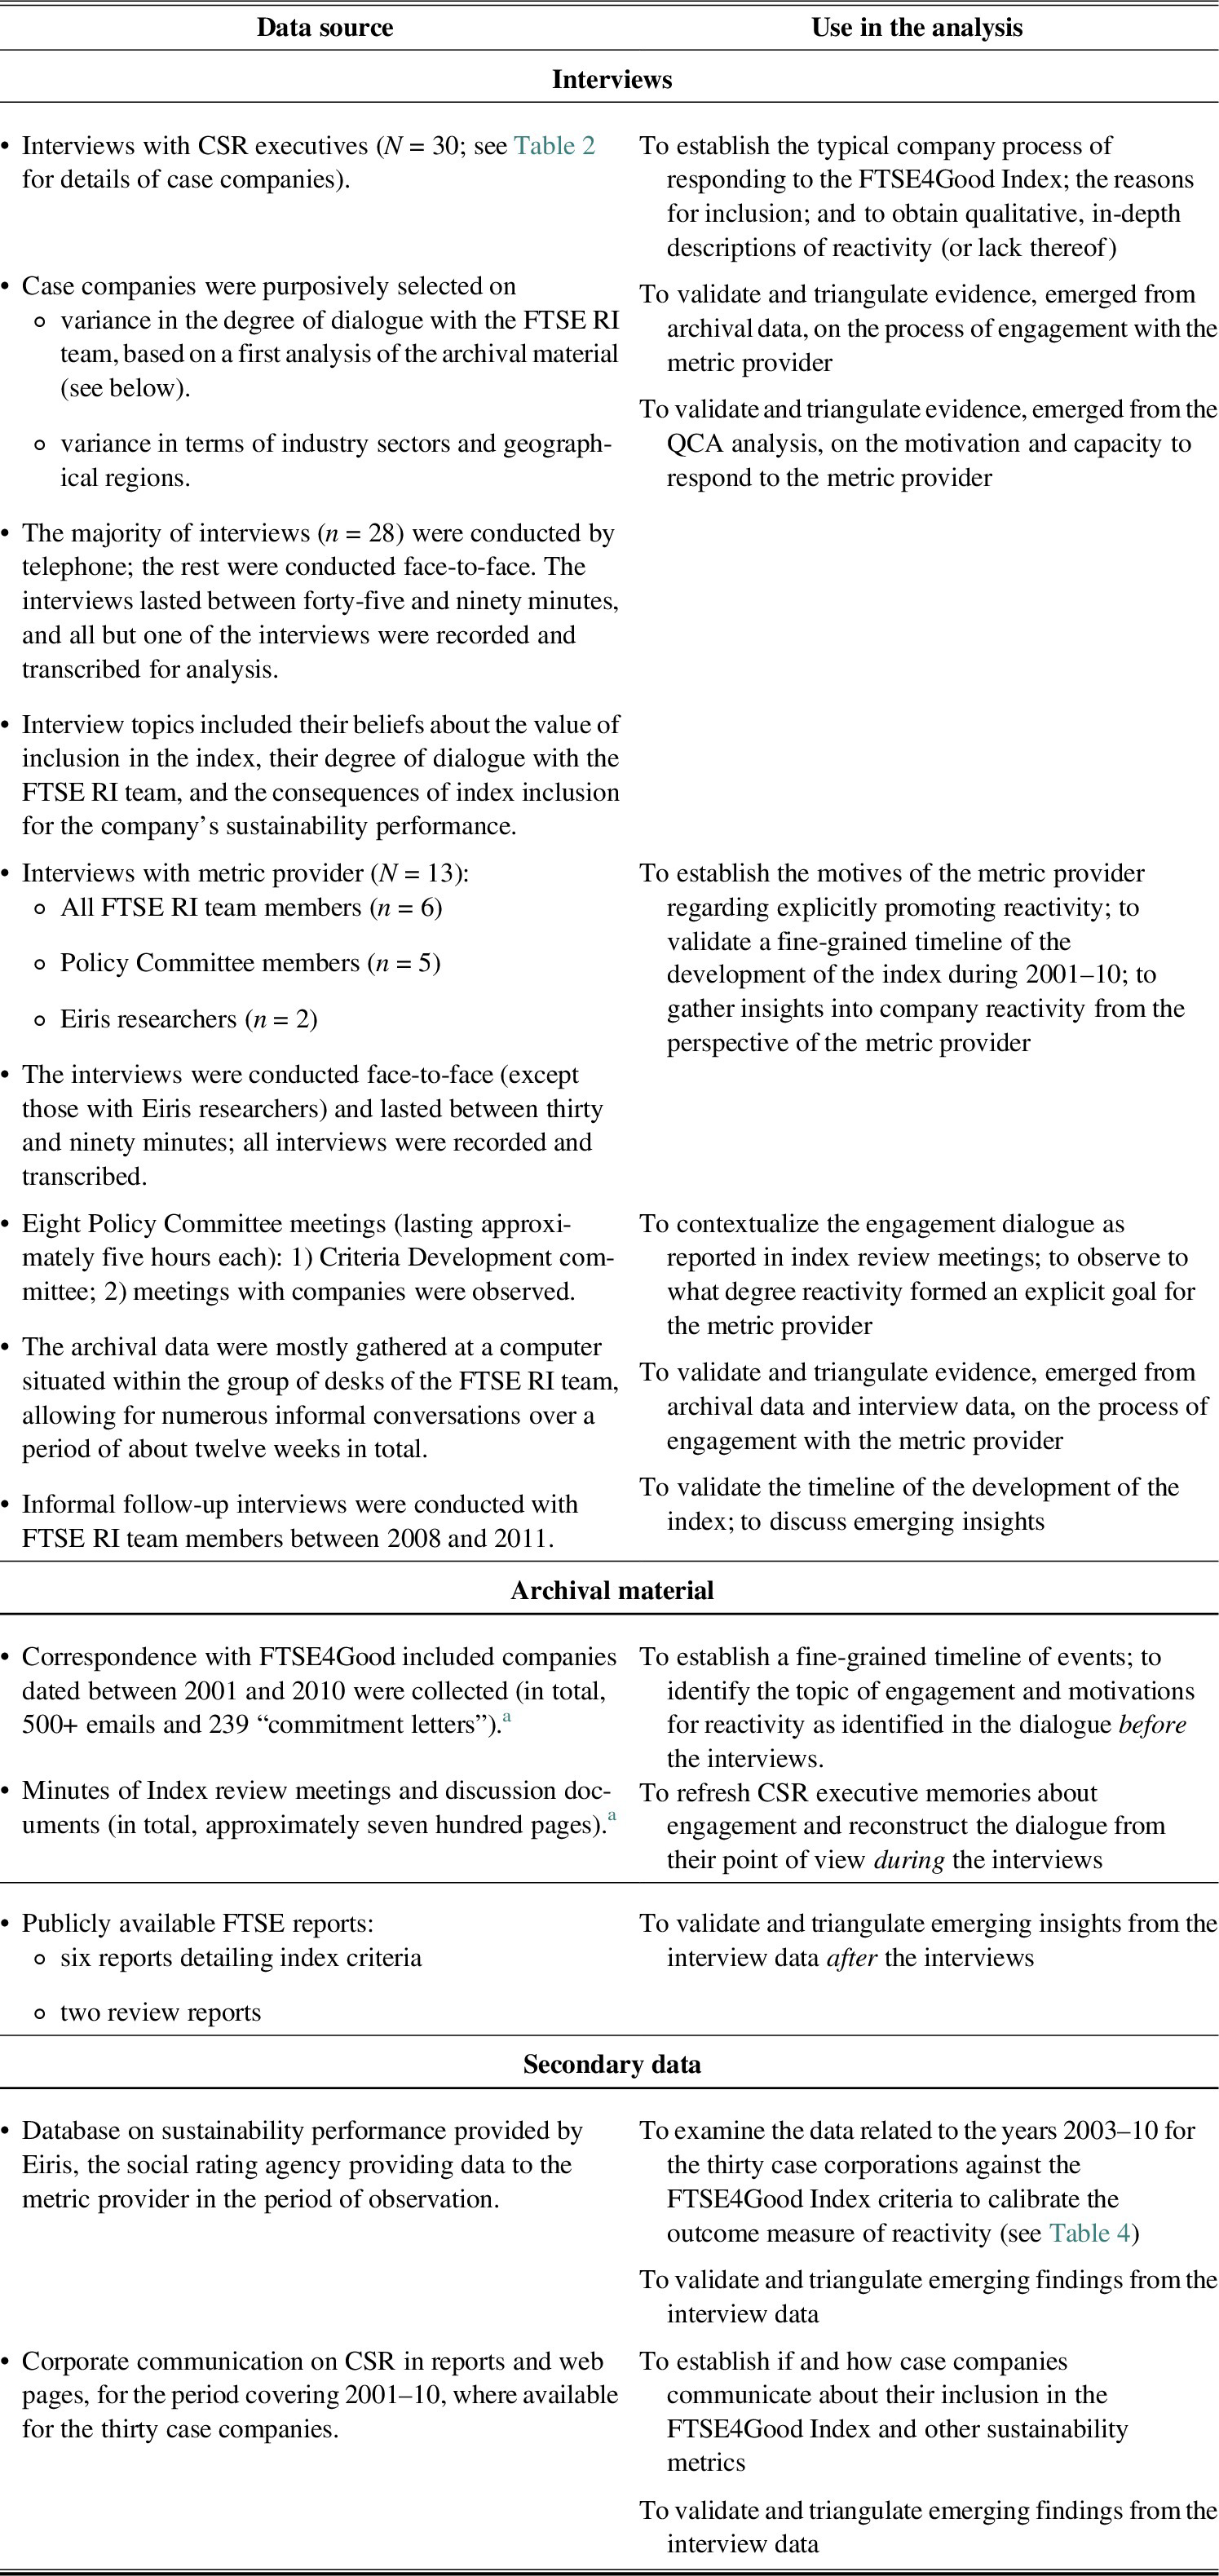
a The correspondence and meeting notes related to the thirty case companies were analysed in depth.
Table 2: Case Company Details

Case companies were purposively selected to represent variance in the degree of dialogue they had had regarding the index criteria, ranging from no engagement to extensive discussions. We initially sampled on the intensity of dialogue because we expected it to drive reactivity toward the index. We stopped sampling once we were satisfied that the sample exhibited a full range of variance in reactivity, based on interview and archival data. As a result of this sampling strategy, we selected “positive cases” that displayed reactivity and “negative cases” that we would expect to display the outcome but didn’t (see Greckhamer, Furnari, Fiss, & Aguilera, Reference Greckhamer, Furnari, Fiss and Aguilera2018). The selection of a cohort of thirty cases ensured that familiarity with the details of each individual case was retained, which is essential for small-N QCA (Crilly et al., Reference Crilly, Zollo and Hansen2012).
Case company contact details were identified from a database maintained by the FTSE RI team. The case company managers contacted for interview all held responsibility for sustainability performance or CSR within their firms, including responsibility for interaction with the FTSE RI team. Archival data were collected to enable triangulation and to counter potential retrospective bias in the interview data. We gathered extensive FTSE4Good archival data, had access to data provided by social rating agency Eiris, and collected company public reports (see Table 1).
Our analytical strategy followed a three-stage process. In the first stage, we focused on our qualitative interview and archival data. We tried to make sense of the dialogue between the metric provider and case companies (how the dialogue was structured, who was involved, how it evolved over time), as based on our interview and observation data, we intuited that the dialogue served to increase reactivity. We used NVivo software to code our data in raw first-order codes, such as “problems with measurement,” “benefits to index inclusion,” and “use of logo.” When we started to compare the first-order codes across cases, we noticed large differences in the motivation for inclusion in the index, in the reported capacity to measure sustainability, and in reactivity. We quickly realized that our data provided evidence of causal complexity (Misangyi et al., Reference Misangyi, Greckhamer, Furnari, Fiss, Crilly and Aguilera2017). For example, some firms that had not experienced dialogue with the FTSE RI team were still reactive, whereas others that had been in engagement were not. Equally, some companies were more reactive than others even when engaging in similar dialogue.
In the second stage of our analysis, we decided to use fsQCA as a method to explore causal complexity. QCA examines each case as a set of attributes, called conditions, and analyzes the extent to which configurations of these conditions lead to the outcome under study using Boolean algebra.Footnote 2 We relied on theoretical insights regarding reactivity, as well as in-depth case contextual knowledge, to derive a set of conditions reflecting interaction with the metric provider, motivation, and capacity (see calibration of the QCA below). We use QCA 2.5 software to undertake the configurational analysis (Ragin, Drass, & Davey, Reference Ragin, Drass and Davey2006). Company cases were assigned to the configuration to which they displayed partial or full membership (>0.5, as recommended in Ragin, Reference Ragin2008).
In the third stage of the analysis we returned to the qualitative case data to interpret the configurations from the QCA analysis. This final step is recommended as best practice in small-N QCA research (Greckhamer et al., Reference Greckhamer, Furnari, Fiss and Aguilera2018; see also Aversa, Furnari, & Haefliger, Reference Aversa, Furnari and Haefliger2015). In this third stage, we reexamined the full qualitative evidence related to the cases assigned to each configuration. We use our NVivo codes from stage 1 in a cross-case analysis, where we looked at patterns in the qualitative data across the cases assigned to the four configurations of stage 2 of the analysis. Specifically, we noticed that companies assigned to different configurations reported different intraorganizational uses of sustainability indices in general, and FTSE4Good in particular. The case companies assigned to the respective configurations differed in the ways they used sustainability metrics as performance feedback and to build calculative capacity, which we define as the company’s capacity to measure its own sustainability performance. In this stage, we circled back and forth between theory on reactivity and calculability (for a review, see Mennicken & Espeland, Reference Mennicken and Espeland2019) and the data to theorize this concept.
In what follows, we describe the steps we took to calibrate the conditions in the QCA analysis. In the findings section, we first present the outcome of the QCA analysis (stage 2 in our analysis), followed by the cross-case analysis based on the qualitative case data (stage 3 in our analysis).
Calibration of the QCA
Following QCA conventions, we treated each case as a member of multiple sets (e.g., the set of large companies). One outcome and a limited number of explanatory conditions can be calibrated.Footnote 3
Outcome
Our outcome of interest is reactivity to the FTSE4Good Index, which can range from making substantive changes to sustainability practices, which are in line with the index criteria, to making no or only superficial changes. The outcome measure represents the idea that firms will react to the FTSE4Good criteria by adjusting sustainability performance in a manner aligned with the index criteria. These adjustments can be evidenced by improvements in the evaluations from the rating agency Eiris. See Table 3 for the calibration of the data into the reactivity outcome. Table 4 provides further qualitative evidence to substantiate the calibration of the outcome.Footnote 4
Table 3: Calibration Table
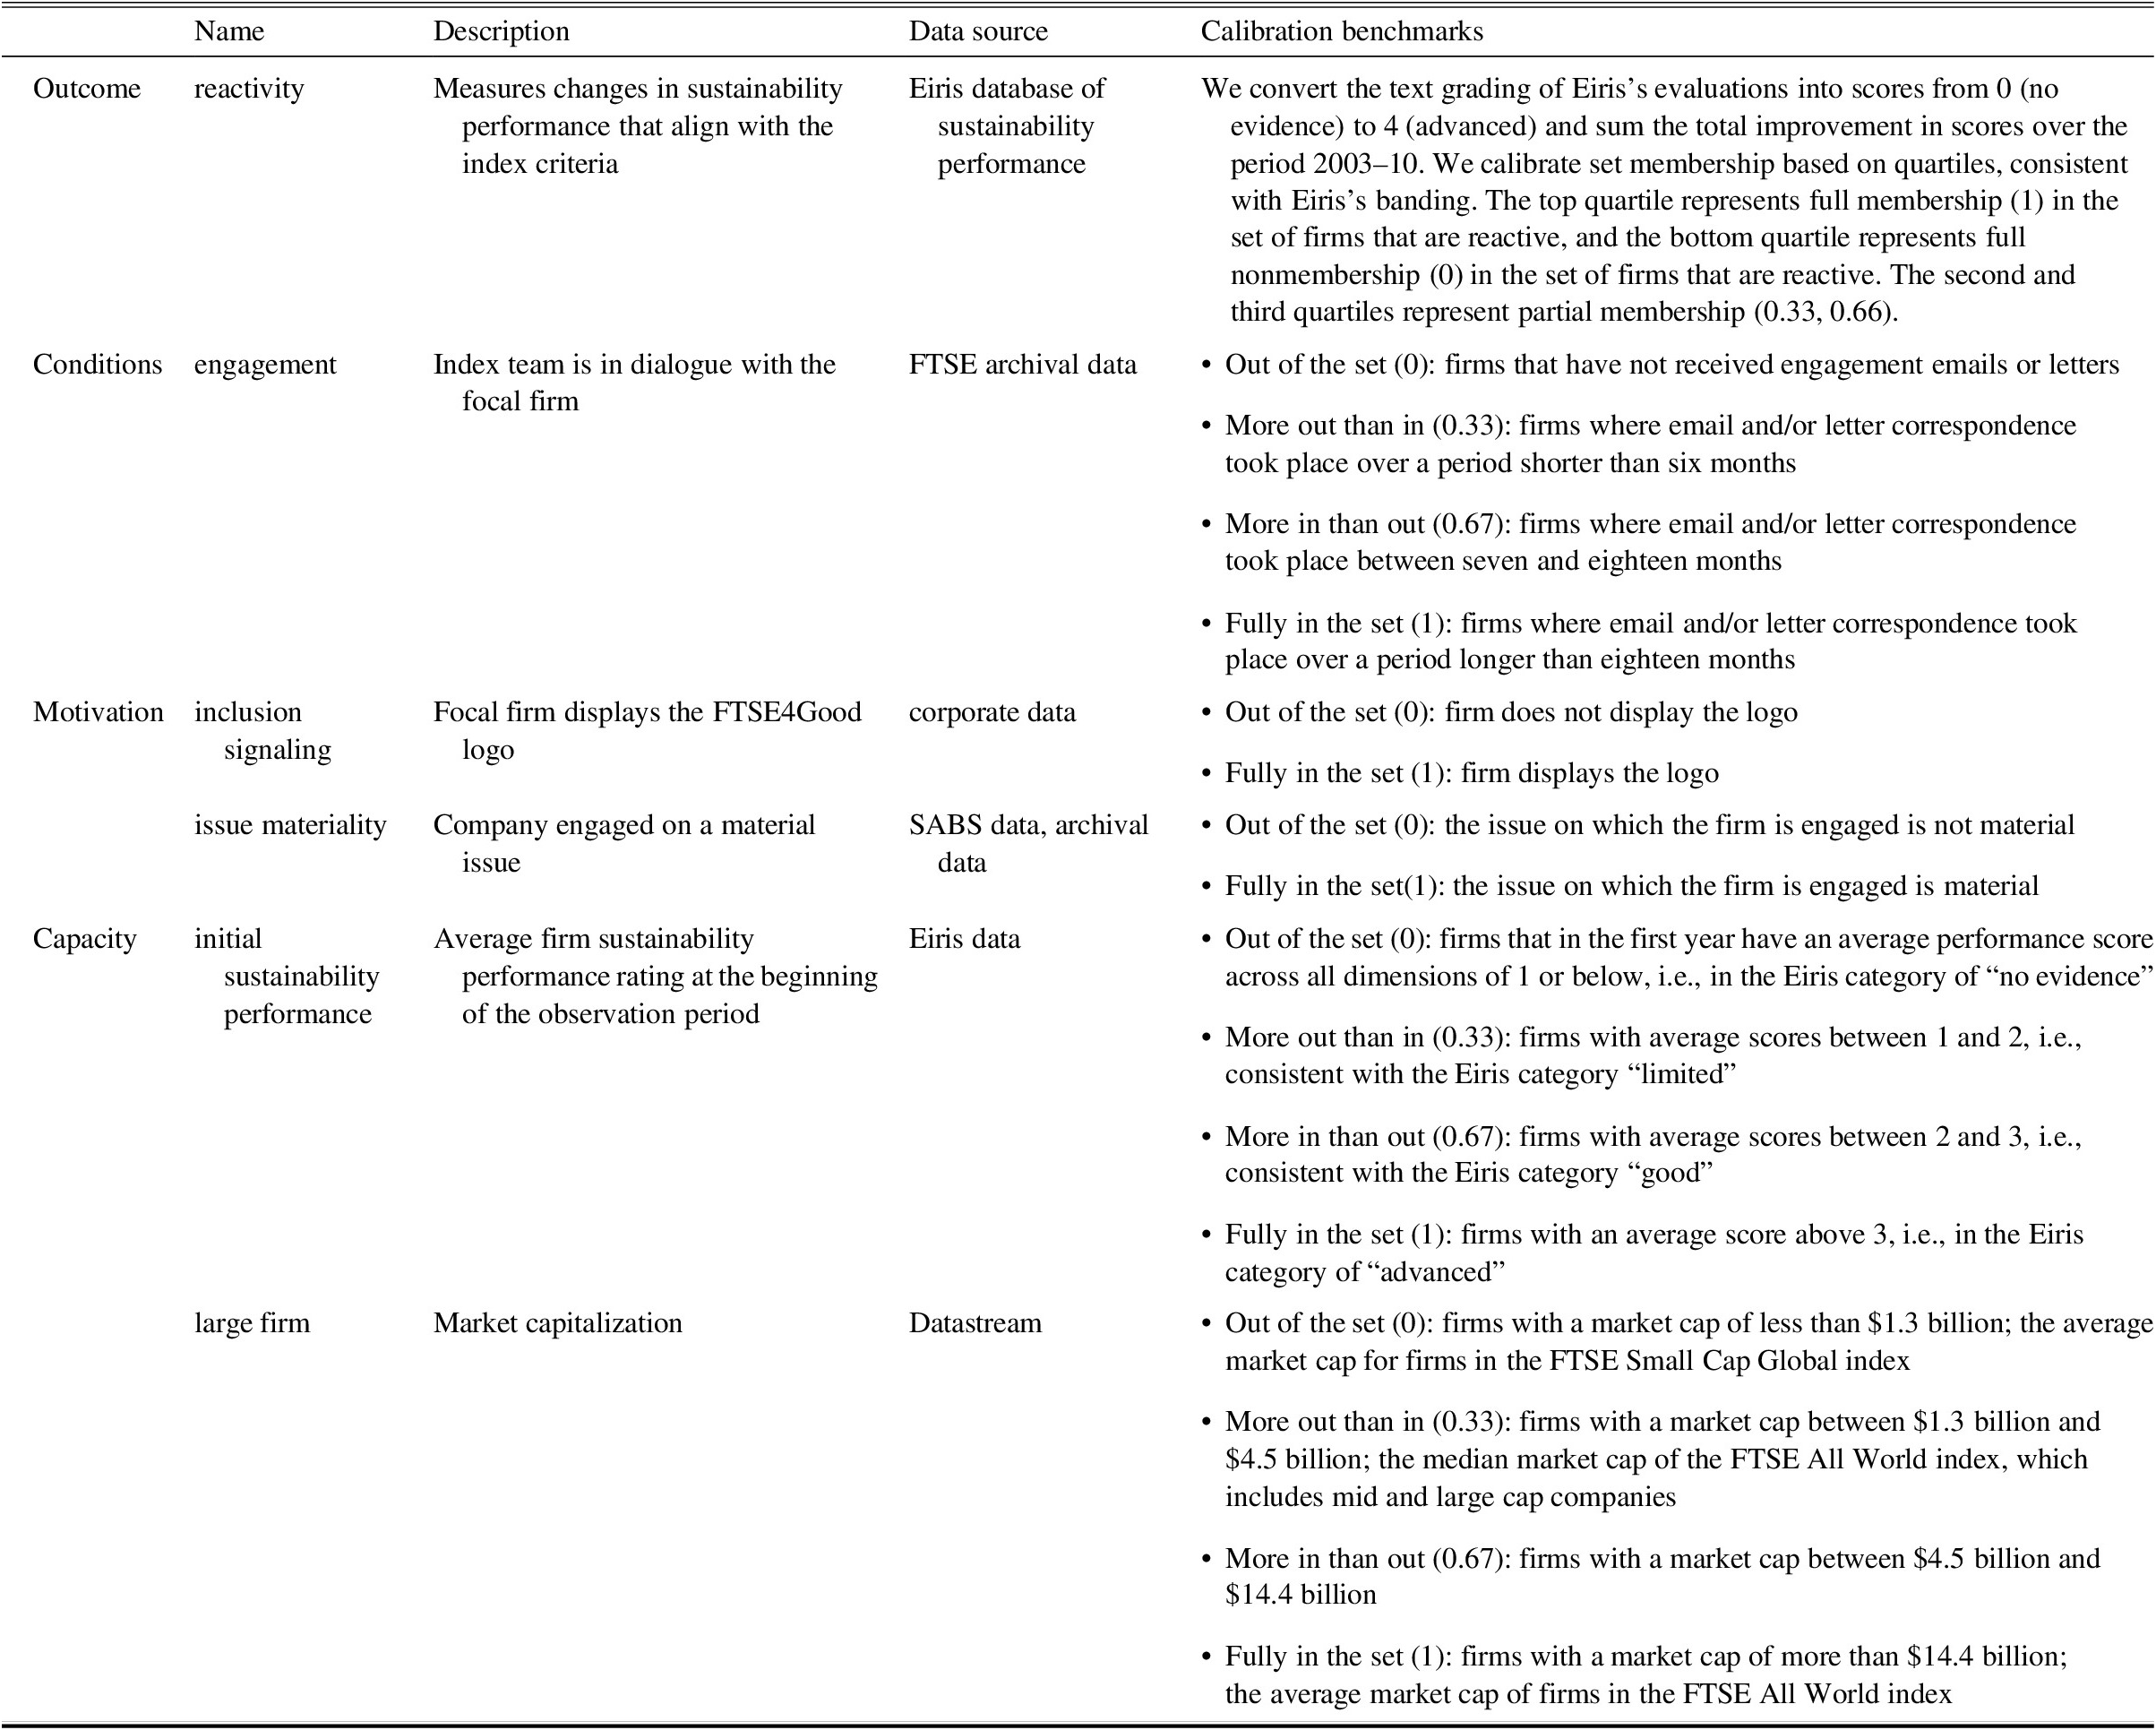
Table 4: Qualitative Evidence of the Calibration of the QCA Outcome Measure Reactivity

a From interview and archival data.
Explanatory Conditions
We include five conditions. The engagement condition captures the degree of dialogue between a case company and the metric provider. Two conditions capture motivation (inclusion signaling and issue salience). Two conditions capture capacity (initial sustainability performance and size).
Engagement. Engagement measures the degree to which the company has been in dialogue with the FTSE RI team regarding the index inclusion criteria. We included this condition because such engagement is common in the RI context (McNulty & Nordberg, Reference McNulty and Nordberg2016). The engagement process is conducted through various means of communication, including emails, formal correspondence (letters), and meetings. This condition was calibrated by examining the archived email and letter correspondence between corporate managers and the FTSE RI team. We calibrated the set using thresholds based on case knowledge (see Table 3): the index gets reviewed every six months, and these reviews serve as occasions to set deadlines for the engagement process. We also tracked the intensity of communication by counting the number of emails sent by the firm in response and found that longer engagement tended to be more intensive.
Inclusion signaling. Companies that are motivated to reduce information asymmetry about their sustainability performance want to report their inclusion in the index as a signal to stakeholders that their sustainability performance has met the “standards of desirability” (Graffin & Ward, Reference Graffin and Ward2010):
The undergraduates coming through are pretty fussy about who they work for and they want to look for companies that do have a decent performance. This recognition by independent credible parties like FTSE … is a lot more credible than anything we can say on our website
(CSR manager, C16).As many companies report their inclusion in RI indices, this reinforces its influence on external perceptions (Espeland & Sauder, Reference Espeland and Sauder2007). Companies are not required to report their inclusion and may at times choose not to because they do not perceive index inclusion as a viable signal to stakeholders or because they do not want to be accused of hypocrisy (Carlos & Lewis, Reference Carlos and Lewis2018). The calibration of the condition reflects whether companies report FTSE4Good Index inclusion through their annual and CSR reports (1), or not (0).
Issue materiality. Companies are also motivated to perform well in external metrics for instrumental reasons, such as impact on stock price movements (Flammer, Reference Flammer2013; Hawn et al., Reference Hawn, Chatterji and Mitchell2018). Such impacts on financial performance depend on the materiality of the environmental, social, or governance issues for specific industries (Khan et al., Reference Khan, Serafeim and Yoon2016). We use the Sustainability Accounting Standards Board (SABS) “materiality map,” which indicates sustainability issues that may “have material impacts on the financial condition or operating performance of companies in an industry.”Footnote 5 We identify from the FTSE archival data the specific issue(s) regarding which the company has been in dialogue and code this condition as 1 (in the set) if the issues are identified in the SABS map as material for the industry category of the company.Footnote 6 If the issues are not considered material according to the SABS map, the firm is coded as out of the set (0).
Initial sustainability performance. Initial sustainability performance is the first condition that captures firm capacity. Firms that have already built sustainability capacity find it easier to respond to stakeholder demands for increased performance (Hall, Millo, & Barman, Reference Hall, Millo and Barman2015; Rehbein, Logsdon, & Van Buren, Reference Rehbein, Logsdon and Van Buren2013). This condition also accounts for the fact that relative improvements in sustainability performance are more feasible when firms are initially performing poorly. We therefore include a measure of previous sustainability performance. Our calibration thresholds are based on case knowledge: we use the Eiris rating categories to determine set membership (see Table 3).
Large firm. This condition captures the resource element of capacity. Larger firms have more resources to respond to shareholder demands surrounding sustainability issues (Dimson, Karakaş, & Li, Reference Dimson, Karakaş and Li2015; Rehbein et al., Reference Rehbein, Logsdon and Van Buren2013). Larger companies are likely to have slack resources that can be invested into the knowledge and expertise required for reactivity. We took as our measure of size the average market capitalization of the firm during our observation period. Almost all of our firms are medium or large cap firms, which is a feature of our research context (see also Dimson et al., Reference Dimson, Karakaş and Li2015), so we established our calibration thresholds on relevant external benchmarks to distinguish small, medium, and large cap companies (see Table 3).
We analysed the calibrated data set using the truth table algorithm (Ragin, Reference Ragin2008) in the fsQCA 2.5 software (Ragin et al., Reference Ragin, Drass and Davey2006) to derive the configurations of conditions that are linked to the outcome. The analysis proceeds in four steps, which we describe in the appendix.
FINDINGS
We report our findings in two sections. In the first section, we detail the QCA results and use one exemplary case to explain configurations 1 and 2 for the presence of reactivity, followed by configurations 3 and 4 for the absence of reactivity.
In the second section, we provide evidence of our qualitative analysis of intraorganizational use of metrics, describing how the case companies assigned to the four configurations differ in terms of use of the index for their calculative capacity and as a performance benchmark tool.
QCA Results
Table 5 displays the configurations associated with reactivity (configurations 1 and 2) and the absence of reactivity (configurations 3 and 4). We also report measures of consistency and coverage for each individual configuration.Footnote 7
Table 5: Outcome of the QCA Analysis

Note. Large circles represent core conditions, small circles represent peripheral conditions. A filled-in circle means the condition is present; a circle with a line through it means the condition is absent.
Configuration 1: Incremental Reactivity
The first configuration represents cases that display reactivity: low initial sustainability performance and signaling inclusion are core conditions (see Table 5). Peripherally, companies are large (configuration 1a), are engaged on a material issue (configuration 1b), or have been in engagement with the metric provider for a considerable amount of time (configuration 1c). In this configuration, a high motivation is a substitute for lack of capacity: corresponding companies are low sustainability performers, but they use metrics as a tool to improve sustainability performance, in line with evidence that low performers are more reactive (Chatterji & Toffel, Reference Chatterji and Toffel2010).
We label this response “incremental” because our analysis of the qualitative evidence of this substitute effect reveals that the companies corresponding to configuration 1 change their behaviour in line with the index criteria in an incremental fashion. Such an incremental response is exemplified by case company 3 (C3), a financial services company that has recently been admitted to the index. It was motivated to develop sustainability policies, particularly with regard to environmental management, because of perceived increased expectations from stakeholders for addressing climate change impacts in the financial industry. As the company started developing its sustainability performance, it used the input from rating agency Eiris and the index criteria to develop its environmental management policies and systems:
We’ve been working at this for a number of years and getting guidance from them [Eiris] as to areas where we could improve. And obviously where we can improve, we’ve taken those views on board. Particularly in the environment side and we’ve made significant progress in that, which has enabled us then to become included [in the FTSE4Good Index]. I would say that they’re very, very helpful in that … they’ve given us direction as to what we did and where we could have gone and what we could have done. So you know, it’s been a very useful index for us to use and to become more aware of where we could improve and give direction
(CSR director, C3).Once the company was included, index inclusion was signaled by displaying the logo of the index in public reports and on web pages and used as an “internationally recognized endorsement of behaviours” (CSR director, C3). The company uses inclusion as a third-party signal to external audiences: “For us that’s very important because it’s not just self-auditing or self-promotion, it’s an external endorsement.” The process of developing sustainability performance was described by the CSR director as a “slow process” of learning how to improve performance; like “doing an exam—you get better over time” (CSR director, C3):
Anything that’s a quick fix is not going to be worthwhile because you know, otherwise everybody could be included. So it does take time to move that, to progress to that. You can’t just put something in and it automatically works overnight. So I think we’ve had a slow progress but it’s sustainable into the future.
This suggests that reactivity for companies in configuration 1 emerges in an incremental fashion, where high motivation to become included in the index substitutes for initial capacity and leads to gradual changes in sustainability performance, in line with the index criteria.
Configuration 2: Substantive Reactivity
The second configuration also displays reactivity: high motivation (signaling index inclusion) and engagement are the core conditions, and peripherally, the large size of corresponding companies suggests a degree of capacity. This configuration captures the way dialogue with the metric provider complements high motivation for index inclusion. We label such reactivity as “substantive,” as the combination of these core conditions leads to substantive changes in line with the index criteria (see also Table 4). Such substantive responsiveness includes developing new policies or management systems, increasing the coverage of existing practices, or adding additional activities to the responsibility of the sustainability managers. Case company 30, a chemical company, exemplifies such reactivity well. It is motivated to react to the index because it feels it is “expected to be in it” (CSR manager, C30). It uses index inclusion as an endorsement of its sustainability performance:
A company like [ours] would consider it should be in it and people shouldn’t really question that we cannot stay in it. So I think it’s a sort of recognized qualification for a company
(CSR manager, C30).As a chemical company, it communicated with the index team regarding its environmental management practices, providing additional information to the rating agency where needed, but the company manager did not perceive this as arduous. As the company had operations in countries deemed high risk for corruption and bribery according to the index criteria, it also interacted with the metric provider on this topic:
And we noticed that the criteria were strengthening and therefore, we would need to do something to remain in the index in that sort of area. I’ve never had a fear that we wouldn’t comply but whether we had the right governance in place to prove that we complied was what we needed to look at. So FTSE alerted us to say “there could be some areas of concern, unless you do something about providing us with some information on this, this and this.” So we took that very seriously and we looked at what we did and we drafted something
(CSR manager, C30).During a typical engagement process, such as the one described above, companies initially get direct communication from the FTSE RI team, warning them that they may no longer meet the index inclusion criteria. A process of dialogue ensues, during which the FTSE RI team provides more information regarding the inclusion criteria and what kind of evidence needs to be provided to meet the criteria. The engagement with the metric provider complements the motivation to be in the index as an endorsement of sustainability performance, to produce substantive reactivity.
Configuration 3: Indifferent Response
The third configuration leads to an absence of reactivity: low motivation as evidenced by not displaying the logo nor being engaged on a material issue are core conditions, and peripherally, low capacity in terms of initial sustainability performance but large size also features. Based on the lack of motivation, as well as reactivity, even in light of some capacity due to size, we have labeled this configuration “indifferent.” Only one case company could be assigned to this configuration based on our data, a US-based financial services company. The company is a low sustainability performer and perceives stakeholder pressure in the US financial services industry as low. A formalized environmental management policy is part of the index inclusion criteria, but the company sees little value in developing such policies:
We just don’t have a formal policy to enforce that stuff [environmental management] and there really hasn’t been a demand to do that .… So it’s definitely moved us down the road in thinking about it but it’s still not a high priority because we don’t see much demand on the shareholder side where people are really looking for that so much
(IR manager, C15).We’re a small team trying to do a lot of things. So we prioritize different activities and that wouldn’t be the top of the list
(IR manager, C15).In this exemplary case, the perceived lack of demand for sustainability performance from relevant stakeholders, coupled with the perception that environmental management is not a material issue, leads to low motivation. Capacity in the form of available resources cannot compensate for the absence of motivation and leads to limited reactivity.
Configuration 4: Selective Response
The fourth configuration also leads to an absence of reactivity: core conditions are an absence of engagement, lack of motivation due to limited materiality of the issues being measured, but high capacity, both in terms of initial sustainability performance and available resources due to size. This configuration represents large companies generally considered to be sustainability leaders, which are not highly motivated and show limited reactivity.Footnote 8 In this configuration, capacity cannot substitute for a lack of motivation. We labeled this configuration “selective,” as our evidence suggests that managers of companies that correspond to this configuration reflect on the differences between social rating agencies and sustainability indices and respond selectively only to certain metrics. They differ from the firm in configuration 3 in that they do not question stakeholder demands for sustainability altogether but examine which metric differentiates their high performance best. We take company 6, a telecommunications company, as our exemplary case. The company is a high sustainability performer that had no interaction with the index team on the index criteria. According to the CSR manager, the company’s capacity in this area means that metrics have a limited influence on performance improvements:
So it’s not crucial to us whether the FTSE4Good shows us as being excellent to very good, as long as we’re up there, that’s what … you know, as long as it’s a fair account of what we’re trying to do. So I wouldn’t say it’s a huge influence in terms of influencing our policy or what we do because we do it anyway
(CSR manager, C6).This combination of high capacity and low motivation can be partly explained by the objective of the FTSE4Good Index to set “challenging but achievable” index criteria (FTSE, 2006), which are arguably easy to meet for companies considered sustainability leaders. In these cases, managers seem to put more emphasis on the DJSI, which is considered to be “harder to get into” (CSR Manager, C6) and therefore a more prestigious index to express leading sustainability performance. In sum, in this configuration, a high level of capacity cannot substitute for a lack of motivation for reactivity.
Qualitative Analysis of Intraorganizational Use
In this section, we highlight differences in intraorganizational use of sustainability metrics across the configurations detailed in the previous section. Our insights are derived from the further qualitative analysis of evidence for all case companies that correspond to the configurations (see Table 6). Our analysis suggests that the companies use the index in two distinctive ways: to build up calculative capacity and as an absolute performance benchmark.
Table 6: Differences in Intraorganisational Metric Use between Configurations
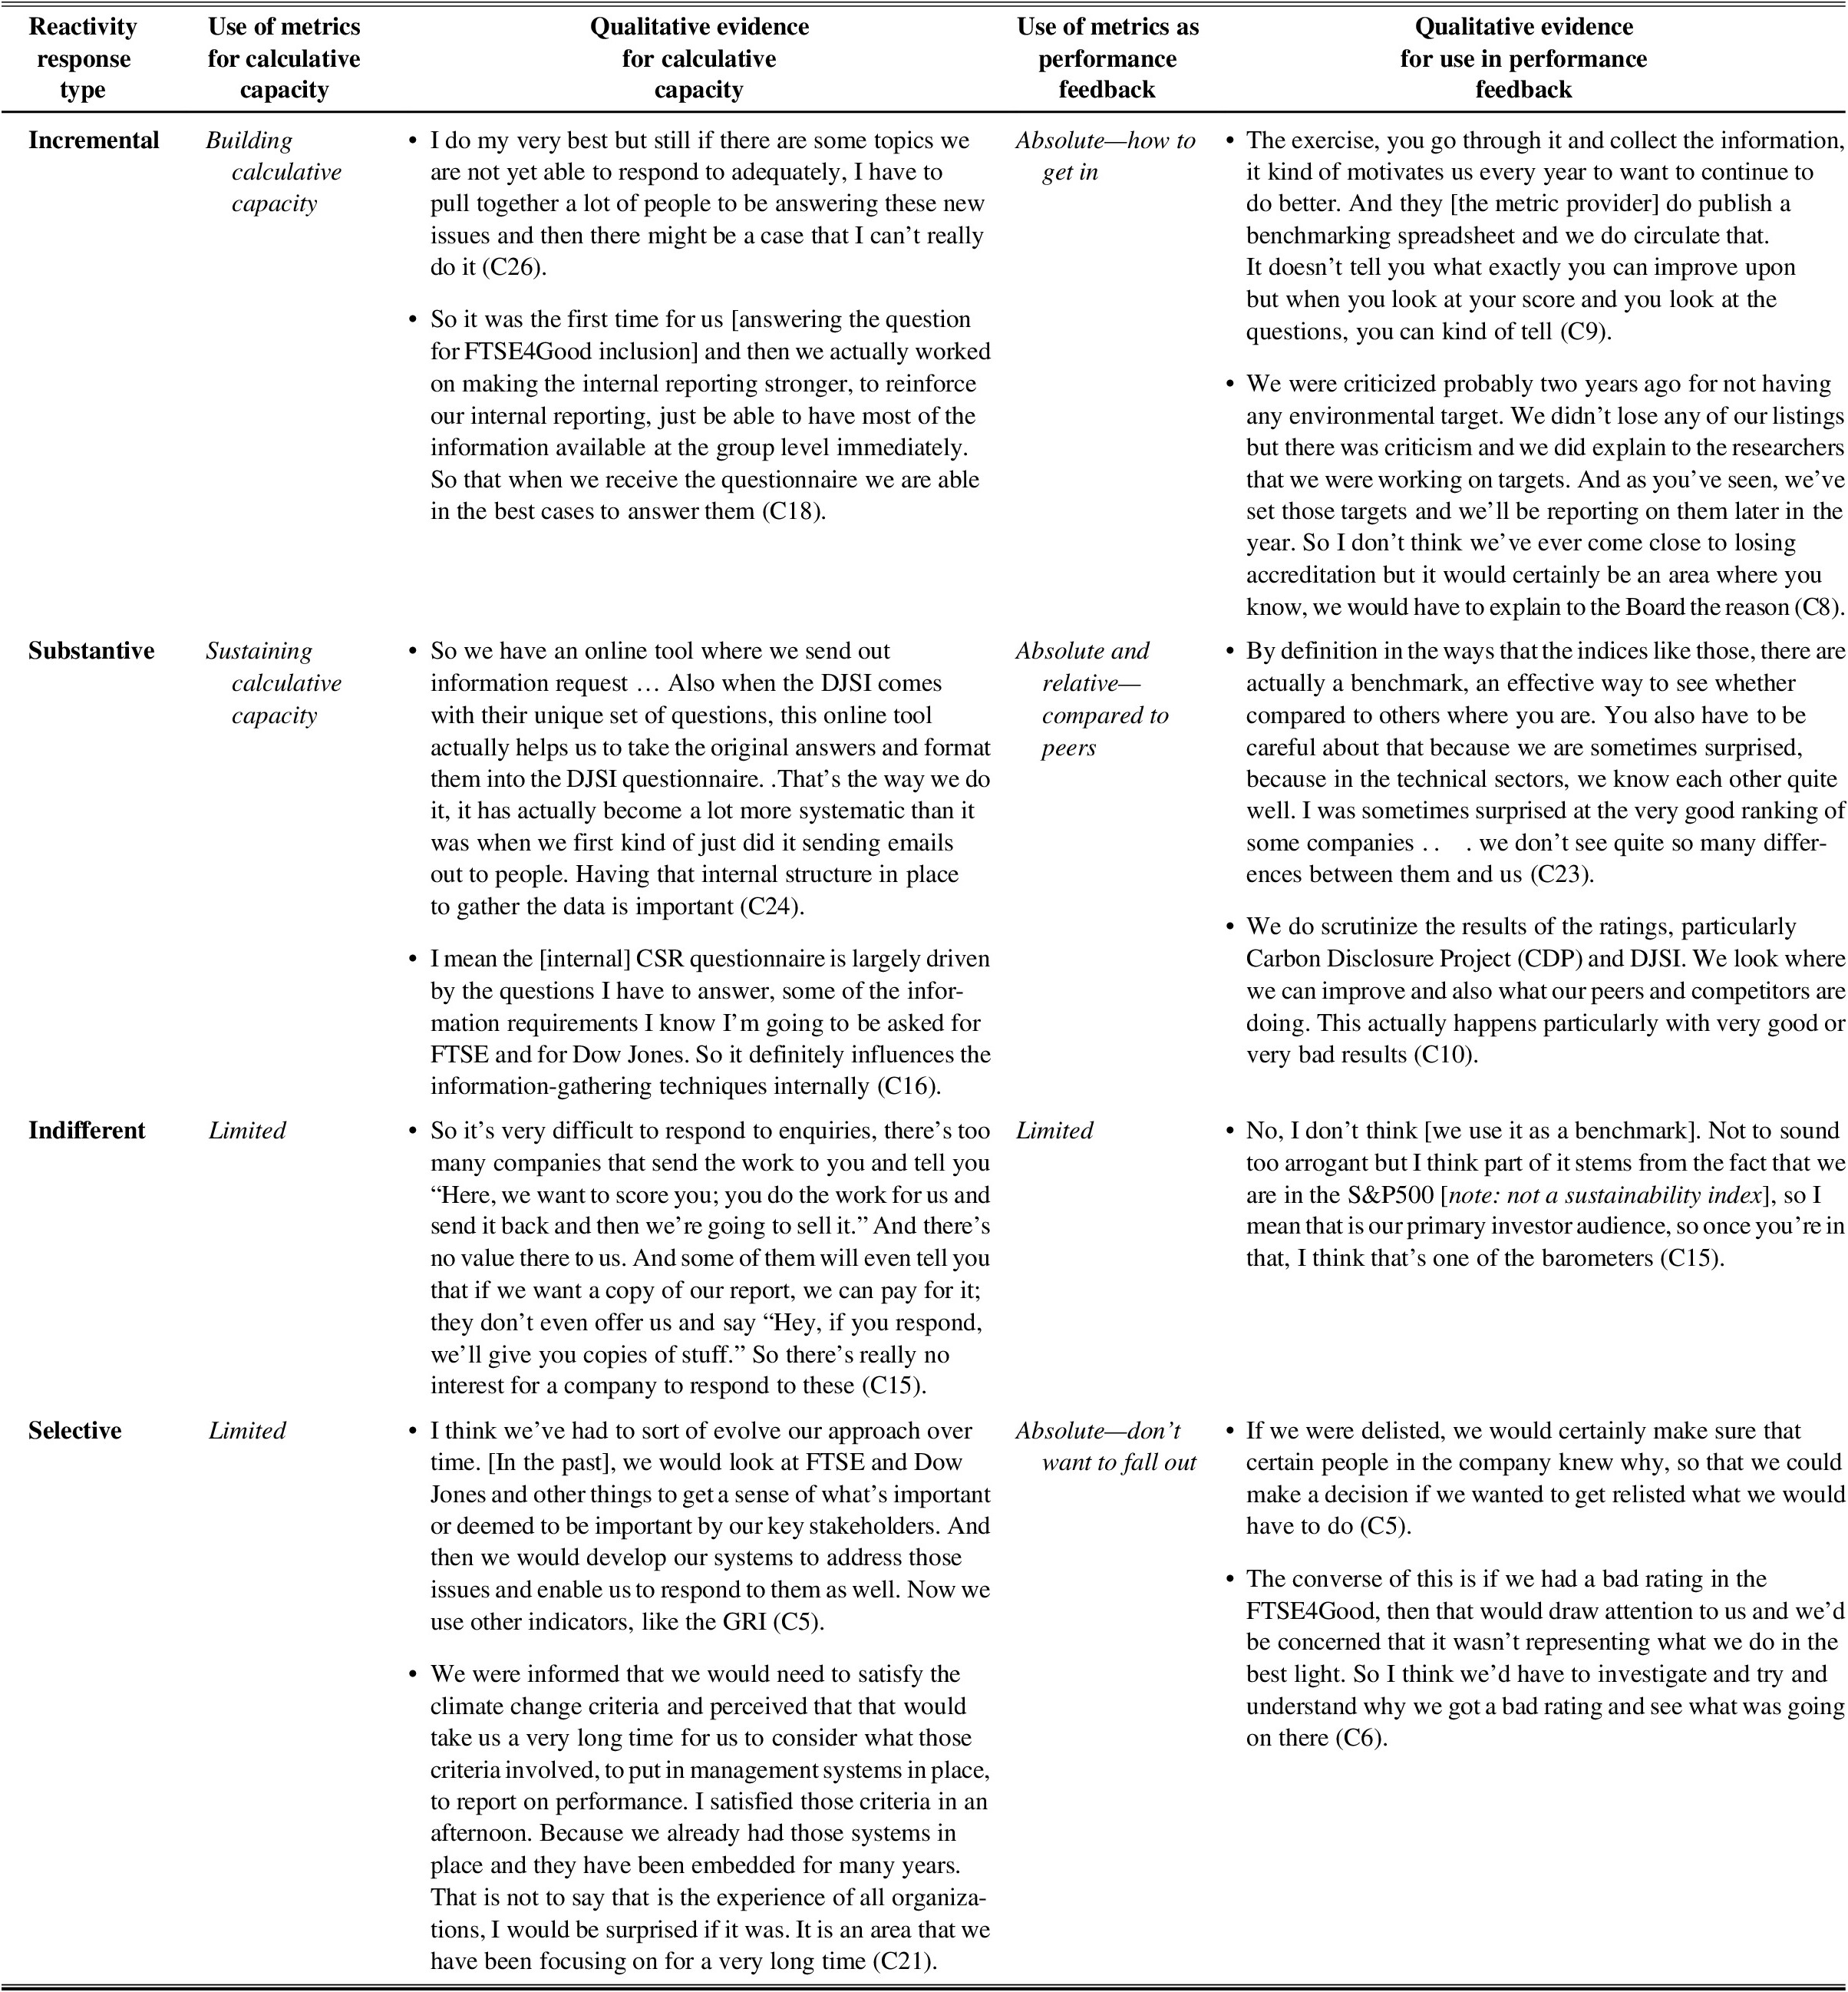
Note. Case company numbers are in parentheses.
Using Sustainability Indices for Calculative Capacity
The capacity to measure and account for sustainability performance using existing management control systems (Arjaliès & Mundy, Reference Arjaliès and Mundy2013) is a precursor to effectively managing stakeholder demands in the environmental, social, and governance domain (Freeman, Harrison, Wicks, Parmar, & de Colle, Reference Freeman, Harrison, Wicks, Parmar and de Colle2010). However, making sustainability “calculable” is fraught with difficulties and requires significant investment of time and resources (Hall et al., Reference Hall, Millo and Barman2015). To remain eligible for index inclusion, managers are requested annually to describe their sustainability policies and their reporting and management systems, as well as to provide evidence (e.g., training modules, policy documents). Companies differ in the extent to which they have developed data collection and management systems to capture the sustainability data required by the sustainability indices. For example, a number of case company managers made the analogy with financial reporting to compare the relative underdevelopment of such data systems for environmental and social performance:
If you think about the financial part, it has been developed over hundreds of years, but the sustainability reporting standards are recent. And it’s developing so quickly that it is a huge challenge for companies. And it’s pretty difficult to measure because it involves everything companies do
(CSR director, C29).One of the differences between the configurations is the degree of “calculative capacity” in place in the target company, which we define as the company’s capacity to measure its own sustainability performance. In particular, we see a marked difference between the incremental response, where metrics are used to build up such calculative capacity, and the substantive response, where metrics are used to maintain the existing calculative capacity. For example, one of the case companies was excluded from the index for not disclosing enough information on its water usage. The company did not disclose this information because data on the relevant indicators were not gathered and monitored internally. Its managers were not able to answer relevant questions from Eiris, and the company was eventually excluded from the index, despite efforts by the FTSE RI team to convince the company to monitor and disclose this information. Deletion from the FTSE4Good Index, however, became an “influencing driver” (IR Manager Case 17) to setting up a more comprehensive environmental management system that incorporated the FTSE4Good environmental management criteria. Companies that show substantive reactivity have previously developed their calculative capacity to meet the metric demands for information:
I started developing some questionnaires myself to gather the data that I was being asked for by FTSE. When I couldn’t find the answers, I suggested perhaps some new data we ought to be collecting to make sure that it would be easier for me in the future… . Doing the FTSE thing has developed some good disciplines that we’ve built into our business and now it’s much easier, because it is giving you the discipline to establish procedures
(communications manager, C30).These companies often report “doing a bit of a stocktake” to see what information is required to meet index inclusion and making a consistent effort to ensure that their calculative capacity continues to meet the requirements of the various metric providers (see Table 6).
Companies that show selective reactivity indicate that while they used the sustainability indices in the past to develop their calculative capacity, these metrics are now less useful for them in this sense (see also Table 6). The indifferent response to metrics also shows limited use of metrics to develop calculative capacity, due to the lack of motivation based on perceived absence of demands for accountability.
Using Sustainability Indices for Performance Feedback
Metrics have been described as inherently relative, as they are based on a measurement system that compares the performance of a company against its peers (Espeland & Sauder, Reference Espeland and Sauder2007; Rowley et al., Reference Rowley, Shipilov and Greve2017) or against the metric of measurement (Espeland & Stevens, Reference Espeland and Stevens1998). In this way, metrics can be used to set aspiration levels whereby metrics are used as benchmarks for company performance internally (Rowley et al., Reference Rowley, Shipilov and Greve2017); performance below the aspiration level is likely to spur remedial action (Greve, Reference Greve2003). We find subtle differences in the way sustainability indices are used as performance feedback between the different configurations. In the incremental response, being included or remaining included in the metric is used as an internal benchmark, but with limited reflection on how the metric can be used to compare company performance to peers:
And since it’s an important issue to be and always remain a constituent in this index, it’s very important for the group to show our performance as well. And the questionnaire does not become just a questionnaire to complete but it comes as sort of an evaluation and a self-assessment as well. And the performance of the previous year is discussed, plus the feedback that comes from the [metric provider] as well
(IR director, C20).In the incremental configuration, the metrics are used as benchmark in an absolute way: the goal is to become or remain included. In contrast, in the substantive configuration, the metrics are also used to explicitly compare performance against peers, by checking who is in or out of the indices:
By definition in the way that the indices are actually a benchmark, an effective way to see compared to others where you are [in terms of performance]
(HS&E manager, C23).Company managers here use the feedback from multiple indices not only to signal their own sustainability performance but also to signal that they are leading the pack:
Our board takes membership of the Dow Jones [Sustainability Index] particularly, but also FTSE[4Good] and the other ones pretty seriously. They like to be recognized, they put a lot of money into being a leader in sustainable development in our industry
(CSR manager, C16).While we find little evidence of internal use of metrics for setting aspiration levels for the indifferent configuration, in the selective configuration, metrics are used as an absolute minimum benchmark. The main focus for this configuration is not to be seen falling out of the index, as this would signal an incongruence with high sustainability performance: “we’d be concerned that it wasn’t representing what we do in the best light” (CSR Manager, C6). This suggests that the companies in this configuration are shielded from pressure for reactivity by their high levels of capacity and that they use metrics as minimum benchmarks for performance. Deletion from the indices would be an extreme case that would breach those minimum benchmarks and likely invite reflection on appropriate remedial action.
DISCUSSION
A configurational perspective on reactivity to sustainability metrics allows for the detection of nuance and diversity in corporate responses, which have hitherto been looked at mainly in a binary fashion (i.e., whether or not the organisation reacts) (Rowley et al., Reference Rowley, Shipilov and Greve2017). Our findings advance prior studies of metrics through our analysis of four configurations of reactivity—incremental, substantial, indifferent, and selective. These configurations relate to two underlying factors: 1) the target company’s motivation for responding, as well as 2) its capacity to respond. We find that motivation may substitute for capacity, but not the other way around. We also find complementary effects between engagement with the metric provider and motivation. Furthermore, we found that the four configurations of motivation and capacity also display differences in their intraorganizational use of metrics in relation to their calculative capacity and as performance feedback. Table 7 summarizes the results from the QCA analysis and the cross-case qualitative analysis into a typology of reactivity.
Table 7: A Typology of Reactivity to Sustainability Metrics

The configurational perspective on reactivity developed in this article has important implications for the study and use of metrics as regulatory devices (Mehrpouya & Samiolo, Reference Mehrpouya and Samiolo2016; Slager et al., Reference Slager, Gond and Moon2012). First, each of the four types of reactivity as summarized in Table 7 has distinct implications for the governance of corporate sustainability. Second, the possibility of metrics to open up conversations on the meaning of sustainability can provide further insights into the communicative action perspective on shareholder engagement (Ferraro & Beunza, Reference Ferraro and Beunza2018; Goodman & Arenas, Reference Goodman and Arenas2015). Last, debates about incommensurability (Espeland & Stevens, Reference Espeland and Stevens1998) that accompany newly designed metrics, such as the Corporate Human Rights Benchmark, may open up space for intrinsic value motivations for sustainability issues like human rights (Schuler et al., Reference Schuler, Rasche, Etzion and Newton2017). We discuss these theoretical contributions and practical implications of the research in the following paragraphs.
With regard to the regulatory effect of metrics, we find two distinct types of responses that entail companies improving their sustainability transparency and/or performance. The incremental configuration, where high motivation substitutes for low sustainability capacity, may be transitory (cf. Haack, Schoeneborn, & Wickert, Reference Haack, Schoeneborn and Wickert2012). We find that companies that show an incremental reactivity response typically focus in the first instance on setting up the internal structures for collecting the data on sustainability performance required by sustainability indices and social rating agencies. Using the sustainability index criteria as a guide, they build up their calculative capacity in an incremental fashion (Raaijmakers, Vermeulen, Meeus, & Zietsma, Reference Raaijmakers, Vermeulen, Meeus and Zietsma2015). However, companies that showcase such a response may also take inclusion in sustainability metrics as an absolute performance goal, showing little signs of reflexivity on the suitability of the measurement criteria (Pollock et al., Reference Pollock, D’Adderio, Williams and Leforestier2018) and the fit between measurement criteria and actual sustainability goals and outcomes during this period. Sustainability metrics suffer from a lack of “input legitimacy” (Mena & Palazzo, Reference Mena and Palazzo2012); for instance, the design of the measurement criteria is rarely based on truly inclusive stakeholder consultation, which makes the lack of reflexivity on the metric criteria in the incremental configuration problematic. In addition, when metrics are used as absolute goals, they are effectively reduced to compliance tools (Schuler et al., Reference Schuler, Rasche, Etzion and Newton2017), leaving little room for a “license to critique” approach, which emphasizes reflection on the meaning of and motivations for sustainability within organizations (Christensen, Morsing, & Thyssen, Reference Christensen, Morsing and Thyssen2017). Such a “license to critique” could materialize more easily in the substantive configuration, which depicts companies with high levels of motivation and capacity. Substantive reactivity is linked to the use of sustainability indices as relative performance feedback tools. Such relative or social comparison is inherent to external measures (Rowley et al., Reference Rowley, Shipilov and Greve2017). Sustainability indices commensurate by transforming qualitative information into a quantitative rating of sustainability performance, along a limited set of common denominators. Such transformed information is easier to circulate and can be used to compare performance of large groups of target organizations by various audiences (Espeland & Sauder, Reference Espeland and Sauder2007). The process of benchmarking against peers may engender the “inquiry and contestation” needed for a critical engagement with metrics (Christensen et al., Reference Christensen, Morsing and Thyssen2017).
We also find two types of configurations where the regulatory effects of metrics are seemingly absent, and these two types have distinct practical implications for using metrics to govern corporate sustainability. The indifferent configuration characterizes companies with low levels of motivation and capacity. While recognizing that sustainability metrics can be used as signaling devices, these companies nevertheless ignore them due to perceived lack of demand from stakeholders. Such disregarding of a metric undermines its central role as a reference point that is made valuable through use by intended audiences (Esposito & Stark, Reference Esposito and Stark2019). This suggests that intensified use of sustainability metrics by key stakeholders, such as investors (Amel-Zadeh & Serafeim, Reference Amel-Zadeh and Serafeim2018), may increase instrumental motivation and encourage companies to start making improvements in their sustainability transparency and/or performance.
In the selective configuration, a lack of motivation combines with an already high capacity for sustainability. Our evidence chimes with other studies that find leading sustainability performers may deliberately ignore certain metrics (Carlos & Lewis, Reference Carlos and Lewis2018). The fact that multiple sustainability metrics exist allows target companies to pick the metric that portrays them in the best light. A context of multiple, competing metrics also provides target companies the choice whether to aspire to a given performance level on a specific metric (Greve, Reference Greve2003; Rowley et al., Reference Rowley, Shipilov and Greve2017). When seeking regulatory effects, this configuration requires a different approach to the indifferent one. Metric providers should examine closely whether more demanding criteria akin to a “platinum standard” could incentivize these companies or if convergence across metrics would provide a solution to end cherry-picking behaviours.
While resistance to metrics in some fields seems futile (Espeland & Sauder, Reference Espeland and Sauder2016; Sauder & Espeland, Reference Sauder and Espeland2009), it is clear from our findings that passive and active resistance still takes place in the sustainability context. Further research could explore the drivers of resistance through comparative research designs, exploring, for example, the differences in reactivity to multiple sustainability metrics within the same field or across different fields. Further research could also examine the degree to which the more discerning approach of leading companies translates into increased resistance, for example, by contesting the accuracy of the data sources used for measurement, the measurement methodology itself, or the categories on which it is based (Espeland & Stevens, Reference Espeland and Stevens1998).
Our article contributes further insights into communicative action perspectives used to study, for example, the role of dialogue in shareholder engagement (Ferraro & Beunza, Reference Ferraro and Beunza2018; Goodman & Arenas, Reference Goodman and Arenas2015). A dimension that is less frequently studied, but which we find plays a core role in driving substantive reactivity to metrics, is direct engagement and dialogue with metric providers. Metric providers like FTSE Russell, the provider for the FTSE4Good Index, are ranking entrepreneurs (Rindova et al., Reference Rindova, Martins, Srinivas and Chandler2018) that seek to both objectively measure sustainability and provide incentives for targeted companies to improve their performance. The dialogue between such ranking entrepreneurs and target companies has received little attention in the study of reactivity yet is a common feature of most external metrics. For instance, both Pollock et al. (Reference Pollock, D’Adderio, Williams and Leforestier2018) and Rowley et al. (Reference Rowley, Shipilov and Greve2017) describe, for different contexts, how interactions between target companies and metric providers help negotiate reactivity toward specific metrics or even aim at manipulating the outcome of measurement itself (Daines, Gow, & Larcker, Reference Daines, Gow and Larcker2010; Rowley et al., Reference Rowley, Shipilov and Greve2017). In our context, interaction with the metric provider complements the motivation to be included in the sustainability index for target companies, while at the same time providing an opportunity to discuss the appropriate changes to sustainability policies, systems, and reporting that meet the index criteria. Such dialogue can be compared to the dialogue process in social shareholder engagement (Ferraro & Beunza, Reference Ferraro and Beunza2018; Goodman & Arenas, Reference Goodman and Arenas2015) and shows that the act of measurement opens a potential space for deliberation between the metric provider and the rated company. More attention should be paid to how metric engagement aims to strike a delicate balance between using metrics as objective signaling devices (Carlos & Lewis, Reference Carlos and Lewis2018) and as regulatory devices that seek to influence behaviour (Mehrpouya & Samiolo, Reference Mehrpouya and Samiolo2016; Slager et al., Reference Slager, Gond and Moon2012) though their deliberative capacity (Soundararajan, Brown, & Wicks, Reference Soundararajan, Brown and Wicks2019).
Our findings show that sustainability metrics have the potential to open a space for deliberation not just with the metric provider but also within companies through the intraorganizational use of metrics. We provide further insights into the unintended consequences of sustainability measurement and reporting systems for intraorganizational management processes (Vigneau, Humphreys, & Moon, Reference Vigneau, Humphreys and Moon2015). Future studies could elaborate on these insights by focusing on sustainability-related “tools-in-use” (Jarzabkowski & Kaplan, Reference Jarzabkowski and Kaplan2015: 538–41) within organizations as well as the presence of management control systems oriented toward sustainability (Gond, Grubnic, Herzig, & Moon, Reference Gond, Grubnic, Herzig and Moon2012) and evaluate the fit between such tools and the characteristics of metrics to explain reactivity. The communicative action perspective can also be used to pay more attention to the ways in which a “license to critique” (Christensen et al., Reference Christensen, Morsing and Thyssen2017) can be promoted through the intraorganizational use of metrics and the implications for metric design so that they can promote the normative ideals of sustainability rather than “box-ticking” forms of compliance.
Like other private governance tools, metrics might encourage an instrumental normative orientation to sustainability (de Bakker, Rasche, & Ponte, Reference de Bakker, Rasche and Ponte2019), where reactivity toward sustainability metrics is motivated by market motivations, such as increased access to responsible investors (Hawn et al., Reference Hawn, Chatterji and Mitchell2018). This instrumental orientation, which is dominant in the study of private governance tools, such as standards and metrics, risks the neglect of other types of motivation, such as deontological reasoning (de Bakker et al., Reference de Bakker, Rasche and Ponte2019: 345). At the same time, attempts at benchmarking sustainability issues like corporate human rights performance may engender questions of incommensurability (Espeland & Stevens, Reference Espeland and Stevens1998). To claim that something is incommensurable means to argue that “things [are] defined as socially unique in a specific way: They are not to be expressed in terms of some other category of value” (Espeland & Stevens, Reference Espeland and Stevens1998: 326). The design of metrics for corporate human rights performance, for instance, by the Corporate Human Rights Benchmark (CHRB), has been criticized on the basis of incommensurability: “From a human rights perspective, every adverse human rights impact is one too many; there is no need to count and measure” (de Felice, Reference de Felice2015: 537). Such debates on the incommensurability of sustainability issues may therefore engender an intrinsic value orientation, where sustainability is valued intrinsically and “for its own sake” (Schuler et al., Reference Schuler, Rasche, Etzion and Newton2017: 223) and where inclusion of all relevant stakeholder groups, including victims of corporate human rights abuse, are heard (Dhir, Reference Dhir2012; Goodman & Arenas, Reference Goodman and Arenas2015).
Our results have important managerial implications for metric providers in the sustainability domain, especially at a time when we witness increased coordination of efforts through initiatives such as the World Benchmarking Alliance,Footnote 9 which brings together multiple metric providers in domains related to reporting, engagement, certification, audit, and sustainability metrics. Increasingly, ranking entrepreneurs are developing metrics with the specific purpose of governing the sustainable behaviour of companies, for instance, the aforementioned CHRB. The implication of the diversity in reactivity that is uncovered through the configurational approach is that ranking entrepreneurs may need to deploy context-specific “recipes” in their work. In other words, careful attention needs to be paid to the type of reactivity and the different underlying reasons and motivations for these responses and to normative questions regarding the input legitimacy and incommensurability aspects of sustainability metrics.
CONCLUSION
We examine reactivity to a sustainability index using a configurational approach, by asking how the attributes of dialogue, motivation, and capacity combine to produce reactivity. We find that motivation may substitute for capacity, but not the other way around. We also find complementary effects between engagement with the metric provider and motivation. We find four types of reactivity responses that correspond to different intraorganizational uses of the metric. We show how sustainability indices can be used to build or maintain calculative capacity and serve as relative or absolute performance feedback tools. We develop a more nuanced theorization of reactivity and its underlying dimensions, which shows that metrics cannot be used straightforwardly as regulatory devices but that attention needs to be paid—both in research and practice—to the interaction effects between different conditions for reactivity. Future research and practice can build on the configurational perspective advanced here to develop deeper insights into the effectiveness of sustainability metrics for directing organisational change.
Supplementary Materials
To view supplementary material for this article, please visit http://dx.doi.org/10.1017/beq.2020.20.
Acknowledgements
The research published in this article is based on the first author’s PhD thesis. The authors are very grateful to the editor and the anonymous reviewers for their comments in developing this article. We would like to acknowledge the valuable feedback we received from participants during the International QCA Expert workshop, organized by ETH Zurich. We are also indebted to the (former) members of the FTSE Responsible Investment team for their invaluable support and insights. This project received funding through an ESRC PhD Case grant.
APPENDIX
The QCA analysis proceeds in four steps. The first step involves analyzing whether necessary conditions are present (in general, necessary conditions are those conditions that, whenever the outcome is present, are also present). We found no necessary conditions (results are available as an online supplement). The next step involves the construction of a truth table that includes each possible combination of conditions. We use the fsQCA algorithm to construct the truth table.
Next, the number of these combinations in the truth table is reduced using consistency and coverage thresholds. Consistency, which can range from 0 to 1, measures “the degree to which instances of an outcome agree in displaying the causal condition” (Ragin, Reference Ragin2008: 44). Coverage, also varying between 0 and 1, measures the extent to which the solutions explain all cases of the outcome. We set 1 as the frequency threshold, which is a suitable level for small-N studies, and use 0.8 as the consistency threshold, in line with recommended levels (Ragin, Reference Ragin2008).
The fourth step is to further reduce the truth table into simplified combinations (Fiss, Reference Fiss2011). The QCA algorithm derives solutions that differ in complexity. The parsimonious solution derives configurations that are strongly simplified using Boolean algebra, while the intermediate solution takes into account only the most plausible simplifying assumptions (Ragin, Reference Ragin2008). Based on the literature, we assume the presence of engagement, issue salience, and inclusion signaling to contribute to reactivity. We make no assumptions about the capacity conditions due to limited theoretical guidance. In line with QCA conventions, we use the parsimonious and intermediate solution to present core conditions (those present only in the parsimonious solution) and peripheral conditions (those present also in the intermediate solution).
Rieneke Slager is assistant professor at the Global Economics and Management department of the Faculty of Economics and Business at the University of Groningen. She holds a PhD from the International Centre for Corporate Social Responsibility at Nottingham University Business School. Her research interests include responsible investment and active ownership, private governance of corporate social responsibility, and sustainable management education. Her work on topics like shareholder engagement, sustainable stock indices, and sustainability centers has been published in journals such as Organization Studies, Business and Society, Journal of Management Inquiry, and Journal of Business Ethics.
Jean-Pascal Gond is a professor of corporate social responsibility (CSR) at Cass Business School, City, University of London, where he heads ETHOS–The Centre for Responsible Enterprise. His research mobilizes organisation theory, sociology, and psychology to investigate CSR and sustainable finance. He has extensively published in the fields of corporate responsibility, organisational behaviour, and organisation theory in leading academic journals such as Academy of Management Review, Business Ethics Quarterly, Business and Society, Human Relations, Journal of Management, Journal of Management Studies, Organization Science, and Organization Studies.
Donal Crilly is associate professor of strategy and entrepreneurship at the London Business School, where his research centers on the microfoundations of nonmarket strategy. He applies theories from psychology and linguistics to understand how corporate executives make sense of social and political issues as well as to understand how investors interpret, and reward, corporate social actions. He is especially interested in intertemporal choice as a driver of nonmarket strategy, and much of his current work focuses on how executives and investors construct perceptions of the future.


 Open access