CLINICIAN’S CAPSULE
What is known about the topic?
Little is available in Canadian literature regarding emergency department (ED) use by mental health patients.
What did this study ask?
Is the number of mental health visits to the ED increasing? Are there differences in ED length of stay between mental health and non-mental health visits?
What did this study find?
The number of mental health visits to the ED is increasing, and mental health patients experience longer wait times in the ED.
Why does this study matter to clinicians?
It informs clinicians who work with mental health patients of current ED demand trends and wait times for patients whom they see.
INTRODUCTION
It is estimated that 20% of Canadians, over 6.7 million people, experience a mental health or addiction problem.Reference Smetanin, Stiff and Briante 1 Projections show that, by the time Canadians reach 40 years old, 1 in 2 will have had or will have a mental illness. 2 Despite these numbers and the increased attention that mental health has received in the media 3 , Reference da Silva 4 and in political discourse in recent years, 3 , Reference Kirby and Keon 5 Canada still has an underfunded and fragmented mental health system. 6
Ideally, in the Canadian health system, diagnosis and treatment of mental health illnesses start in the community. Primary care providers (PCPs) should be the first professionals that people seek for help. 7 After consultation with PCPs, patients may be referred for therapy or additional diagnosis with a specialist (e.g., psychiatrist) or access a variety of community services, including home care, and help lines. 7 Emergency departments (EDs) should be used in crisis situations only. 7 However, the lack of access to outpatient mental health services, such as PCPs, psychotherapy, or community services, drives people to seek care directly from the ED. 6 , Reference Newton, Ali and Johnson 8 In Ontario, for example, 44.6% of children and youth who visited the ED in 2014 for a mental health visit had no prior contact with any physician for that issue. 9
Unlike in the United States where the medical literature has an extensive number of studies documenting trends in the use of EDs by mental health patients 10 – Reference Pittsenbarger and Mannix 15 and the disproportional waits experienced by this population in the ED,Reference Zhu, Singhal and Hsia 16 – Reference Nolan, Fee and Cooper 20 there are very few studies in Canada.Reference Newton, Ali and Johnson 8 , Reference Matsumoto, O’Driscoll and Lawrance 21 – Reference Atzema, Schull and Kurdyak 23 The Canadian studies are usually limited to a particular geographical areaReference Matsumoto, O’Driscoll and Lawrance 21 or population group, such as childrenReference Newton, Ali and Johnson 8 and/or young adults.Reference Gandhi, Chiu and Lam 22 Moreover, the only Canadian article measuring length of stay (LOS) for patients with mental health conditions in the ED was published in 2012, using outdated data from 2009.Reference Atzema, Schull and Kurdyak 23
This study quantifies the impact of mental health visits to the ED of a single academic hospital that offers psychiatric emergency services and is located in Toronto, ON. In particular, this pilot study quantifies the incidence of visits to the ED and determines differences in LOS for patients with mental health visits versus those with visits for other reasons. This study also defines which sections of the ED visit have the largest impact on the overall LOS for mental health visits in the ED.
METHODS
Toronto Western Hospital’s ED
The Toronto Western Hospital (TWH) is one of four academic hospitals comprising the University Health Network (UHN). 24 It is a 272-bed hospital, 24 and its 34-bed ED treats more than 60,000 patients annually. 24 TWH’s Psychiatric Emergency Service Unit (PESU), where many mental health patients are directed upon arrival to the ED, is located physically adjacent to the ED. Initially implemented in 2005, the PESU is a safe and secure environment where up to six patients can stay at a time, for a maximum of 72 hours. 25
Upon arrival to TWH’s ED, patients proceed to registration/triage, where a nurse evaluates their condition and assigns an acuity score from 1 to 5, with 1 being the most critical. Patients will then either be assigned to a bed where they wait to see a physician, or will remain in the waiting area until a bed becomes available. After a patient is seen by a physician, a lab or imaging tests may be ordered, and a consult with a specialist may be requested. Patients with tests or consults will wait for their results and then be reassessed by the ED physician. Patients are then discharged or transferred for admission. The process flow is depicted in Figure 1.
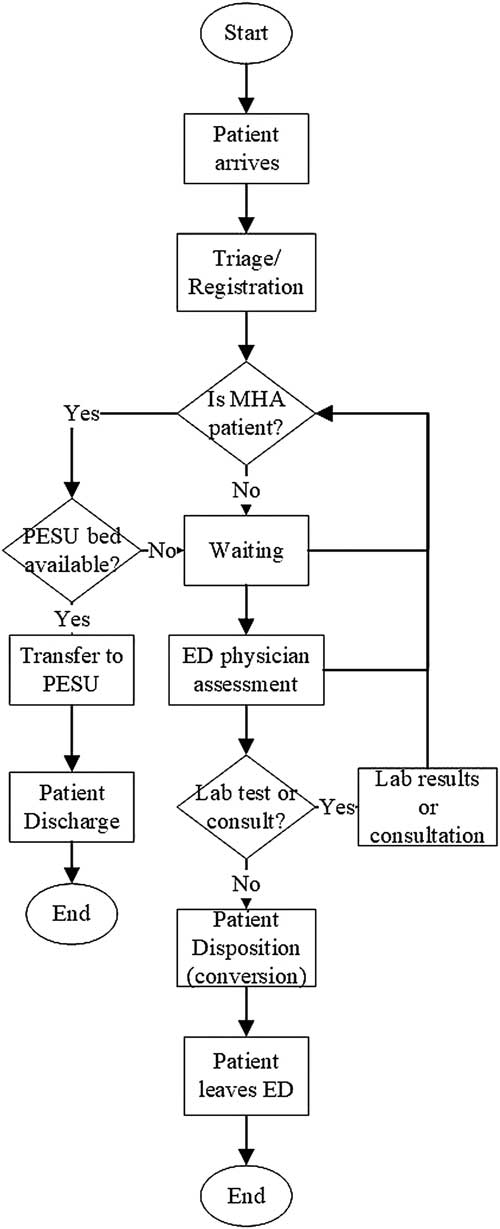
Figure 1 Process flow in the TWH ED.
If a patient presents to the ED with a mental health condition and there is a bed available in the PESU, he or she is automatically transferred there (i.e., internal transfer). Otherwise, the patient will occupy a regular bed in the ED until either a space in the PESU becomes available or until that patient is discharged from the ED (whichever one comes first).
Study design and data source
This retrospective study was conducted using data collected from the National Ambulatory Care Reporting System and the Electronic Patient Records (EPR) system from UHN. The study cohort includes all ED visits at TWH from April 2012 to March 2017, a total of five fiscal years (FY). Note that, a FY refers to the period from April 1 to March 31 of the following year.
The ED visits were grouped into two general categories (mental health and non-mental health), based on the International Statistical Classification of Diseases (ICD-10) associated with the Main Problem Code recorded for the visit. The mental health group included the following ICDs: Substance abuse (F55, F10-F19), Schizophrenia (F20 – excluding F20.4, F21, F22, F23, F24, F25, F28, F29), Mood and affective disorder (F30, F31, F32, F33, F34, F39), Anxiety/Stress (F40, F41, F42, F43, F44, F45, F48), Adult personality and behavior disorders (F60, F63, F64, F65, F66, F68, F69), and Intentional self-harm (X60-X84). The non-mental health group included all other ICDs.
This study received ethics approval from the UHN Research Ethics Board.
Measures of interest
The four measures of interest were 1) time to physician initial assessment (PIA), 2) conversion time, 3) boarding time, and 4) total LOS. PIA is the time from registration to first assessment by a physician. Conversion time represents the time elapsed between PIA and the decision to admit the patient to the hospital (i.e., when the patient’s status is changed to Admitted in the EPR). Time spent coordinating with consulting services (e.g., internal medicine, psychiatry) is counted in conversion time. Boarding time is the difference between the time when the admission happened (i.e., conversion time) and the time that the patient physically leaves the ED. Total LOS is the time from registration to the time when the patient physically leaves the ED.
To calculate these measures, visits were stratified into four mutually exclusive groups according to their discharge disposition: discharged, admitted, internal transfer, and external transfer.Reference Zhu, Singhal and Hsia 16 The discharged group comprised all visits that, after treatment in the ED, were discharged to the place of residence. The admitted group included all visits that resulted in an admission to a hospital ward, operating room, or critical care unit. Because TWH does not have inpatient psychiatric beds, whenever patients need to be admitted to a psychiatric unit, they are transferred within UHN to Toronto General Hospital (TGH), which is located 2.2 km from TWH. The internal transfer group comprised all visits that were transferred within the same hospital, usually to one of the clinics, day surgery, or within the ED (e.g., to the PESU). Finally, the external transfer group included all visits that were transferred to other acute or non-acute facilities (i.e., outside of UHN). PIA and total LOS were calculated for all four groups, whereas conversion time and boarding time were calculated for the admitted group only.
Although included in the computation of general descriptive statistics, visits with the discharge dispositions “left against medical advice” or “died upon arrival to ED” were excluded from the measures of interest. Moreover, because patients transferred to the PESU are described in the data as internal transfers, the time spent in the PESU does not count towards ED LOS reported in the results section.
Statistical analysis
Trends in the number of visits and general descriptive statistics were calculated for both mental health and non-mental health groups. The measures of interest are presented here as medians and 90th percentile values, and are stratified by mental health versus non-mental health visits and by discharge disposition (i.e., admitted, discharged, internal transfer, and external transfer).
Adjusted differences in wait times were evaluated using quantile regression, which is appropriate when distributions are right skewed and when there is an interest to assess differences in distributions quantiles (e.g., median or 90th percentile), rather than the usual differences in mean.Reference Ding, McCarthy and Desmond 26 , Reference Austin and Schull 27 Similar to the work presented,Reference Atzema, Schull and Kurdyak 23 model covariates used in the adjusted model include acuity level (high or low), sex, time of the day, day of the week, and whether the patient arrived by ambulance.
The covariate acuity level refers to the score 1 to 5 given by a registered nurse when a patient presents to the ED according to the Canadian Triage and Acuity Scale (CTAS).Reference Bullard, Musgrave and Warren 28 In this study, CTAS scores of 1-3 are regarded as high acuity and 4-5 are low, similar to the targets for time spent in emergency rooms defined by the Ontario Ministry of Health and Long-Term Care. 29
RESULTS
TWH received a total of 308,016 ED visits in 5 years, 24,972 (8.1%) due to mental health conditions, and 283,044 (91.9%) for any other non-mental health reason (Table 1). Mental health patients were more likely to be younger (6.8% being 65+ years old versus 27.9%), to be male (54.7% versus 49.0%), to arrive by ambulance (47.2% versus 23.3%), and to receive higher acuity scores (92.9% in the high acuity group versus 78.3%). Although mental health patients were more likely to be internally transferred (11.7% versus 2.3%), they were less frequently admitted (4.9% versus 14.0%).
Table 1 Baseline characteristics for mental health versus non-mental health visits

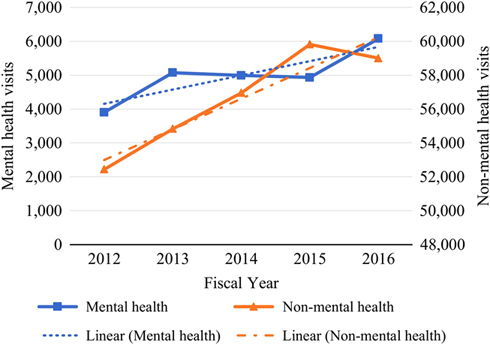
The total number of ED visits increased linearly by 15.5% in 5 years from 56,345 to 65,078. In the mental health group, the number of visits rose from 3,903 to 6,076 visits (55.7% increase), whereas, in the non-mental health group, visits increased from 52,422 to 59,002 (14.5% increase) (Figure 2). As of FY 2016, mental health related visits accounted for 9.3% of all ED visits at TWH. The slope for the mental health group linear trend was 420.3 with a mean squared error (MSE) of 120,959.3; the trend slope for the non-mental health group was 1,811.1 and MSE of 776,485.3. While the non-mental group demonstrated a consistent linear increase, the mental health group experienced some fluctuations, despite the overall increasing trend.
Figure 2 Trend in the number of mental and non-mental health visits to the ED.
Considering the 90th percentile adjusted difference for patients that were discharged from the ED, mental health patients had longer wait times for both PIA (0.1 hour) and total LOS (3.3 hours) when compared to the non-mental health group (Table 2). Median values of the adjusted difference showed that mental health patients had similar wait times to see a physician, but they waited a 0.4 hour longer in total LOS than the non-mental health group patients.
Table 2 Measures of interest, in hours, for discharged visits (N=242,243)

PIA=physician initial assessment; LOS=length of stay.
The 90th percentile adjusted difference for the admitted group showed that mental health patients waited longer than other patients in all four metrics of interest (Table 3): time to PIA was a 0.1 hour higher (non-significant, p>0.05), conversion time was 8.4 hours higher, boarding time was 22.0 hours higher, and total LOS was 24.5 hours higher. Median values of the adjusted difference showed that mental health patients waited longer in only two of the measures of interest: conversion time was 3.1 hours higher and total LOS was 5.9 hours higher. In contrast, mental health patients experienced similar median wait times for PIA and a 0.8 hour shorter boarding time when compared to non-mental health patients.
Table 3 Measures of interest, in hours, for admitted visits (N=40,965)

PIA=physician initial assessment; LOS=length of stay.
Among the internally transferred group, the 90th percentile adjusted differences displayed non-significant results for both PIA (0.2 hour, p>0.05) and total LOS (1.8 hours, p>0.05) (Table 4). Conversely, adjusted differences in median values showed that mental health patients waited a 0.3 hour less than other patients to be assessed by a physician and waited 2.9 hours less to physically leave the ED. Note that PIA and total LOS data were properly recorded for only a small portion of this specific group because most internal transfers happen upon arrival to the ED, before any information is recorded in the EPR.
Table 4 Measures of interest, in hours, for internal transfer visits (N=9,448)

PIA=physician initial assessment; LOS=length of stay.
For the externally transferred group, the 90th percentile adjusted difference showed that mental health patients had similar wait times for PIA when compared to the non-mental health group patients; however, they waited 12.7 hours longer before getting transferred to the external facility (Table 5). If median values of the adjusted difference are considered, then there is an increase in both PIA (0.4 hour) and total LOS (0.7 hour) for mental health visits.
Table 5 Measures of interest, in hours, for external transfer visits (N=1,944)

PIA=physician initial assessment; LOS=length of stay.
DISCUSSION
This study confirms that ED visits for mental health conditions at TWH have significantly longer wait times when compared to visits for non-mental health reasons. Except for patients that were internally transferred, the overall LOS for mental health visits was significantly longer than non-mental health visits regardless of the discharge disposition (i.e., discharged, admitted, or external transfer).
Similar to the results presented in this analysis, several other studies report that mental health patients experienced longer ED LOS when compared to the non-mental health cohort.Reference Zhu, Singhal and Hsia 16 , Reference Weiss, Chang and Rauch 30 – Reference Chang, Weiss and Orav 32 Among visits leading to discharge, for instance, the total LOS for mental health patients at TWH is 56% longer than the non-mental health cohort (90th percentile of 11.4 hours versus 7.3 hours). Supporting this finding, an older but nationwide study from the United States reported that discharged mental health patients waited 2.5 hours longer (90th percentile) before discharge in 2011.Reference Zhu, Singhal and Hsia 16
Although mental health patients discharged from the ED experience longer wait times before getting an initial assessment by a physician, this difference is not clinically significant, and it seems that the higher LOS is mostly driven by factors other than the PIA time. Though these factors were not investigated in this analysis because of data limitations (specifically, the lack of time stamps detailing what happens to patients after the initial workup), the literature suggests that prolonged LOS for discharged mental health visits may be associated with a shortage of outpatient facilities and resources where patients can be referred for complementary therapy once they leave the ED.Reference Newton, Ali and Johnson 8 , Reference Zhu, Singhal and Hsia 16 , Reference Gandhi, Chiu and Lam 22 , Reference Weiss, Chang and Rauch 30 , 33 , Reference Stone, Rogers, Kruckenberg and Lieser 34 This shortage leads to prolonged discharge planning for mental health patients, which involves establishing linkages with these critical services. This is generally not needed when discharge planning for non-mental health conditions.
The clinically significant differences in LOS become apparent when patients are admitted. The 90th percentile total LOS for mental health patients being admitted to the hospital is 79.5% longer than non-mental health patients to receive an inpatient bed (52.6 hours versus 29.3 hours). Similarly, a case study from an academic ED in the United StatesReference Nicks and Manthey 17 reports admitted mental health patients waiting, on average, more than three times longer than admitted non-mental health patients before being transferred to an inpatient ward (18.2 hours versus 5.7 hours). In contrast, in 2011, another studyReference Zhu, Singhal and Hsia 16 showed that admitted mental health patients waited only 8 minutes longer (90th percentile) than admitted non-mental health patients before leaving the ED.
Among admitted visits, both conversion and boarding times expressively impact the overall LOS. Not only are patients with mental health conditions waiting significantly longer for an admission decision (90th percentile of 19.1 hours versus 10.9 hours), which could be caused by either emergency physicians taking longer to decide on patient management or delays in consult with attending psychiatrists, but also once patients are admitted, mental health patients are disproportionally boarding in the ED, which could be partially attributed to their need to be transferred to another hospital within the UHN (i.e., TGH). For perspective, in a 2013 position statement given by the Canadian Association of Emergency Physicians, the target boarding time is 90th percentile within 8 hours.Reference Affleck, Parks and Drummond 35
Boarding time has been established as a major aggravating factor for delays in patient care.Reference Nicks and Manthey 17 – Reference Nolan, Fee and Cooper 20 , Reference Bender, Pande and Ludwig 36 , 37 Besides worsening ED crowding,Reference Nicks and Manthey 17 , Reference Pearlmutter, Dwyer and Burke 19 , Reference Nolan, Fee and Cooper 20 , Reference Affleck, Parks and Drummond 35 delaying treatment for other ED patients,Reference Pearlmutter, Dwyer and Burke 19 , Reference Nolan, Fee and Cooper 20 and deteriorating clinical outcomes,Reference Nicks and Manthey 17 , Reference Pearlmutter, Dwyer and Burke 19 , Reference Matsumoto, O’Driscoll and Lawrance 21 , 37 boarding also consumes scarce ED resources (e.g., beds, staff).Reference Nicks and Manthey 17 , Reference Pearlmutter, Dwyer and Burke 19 , Reference Nolan, Fee and Cooper 20 Among the four measures used by the Canadian Institute for Health Information to describe high quality care 38 (evidence-based, patient-centred, safe, and timely), at the very least, two dimensions (safety and timeliness of care) are impacted by prolonged LOS and boarding. Given that the overall number of mental health visits to TWH is increasing at a greater rate than the non-mental health visits, the longer boarding times and LOS in this patient population can be predicted to have an increasing impact on overall ED crowding.
When considering visits that lead to internal transfers, the PESU has yielded some positive results. Aside from diverting roughly 20% of the total mental health demand from the ED to a more appropriate and safe environment to care for patients experiencing a mental health crisis, the PESU also seems to shorten the median overall LOS for patients with mental health issues (median total LOS of a 0.5 hour as opposed to 3.5 hours in the non-mental health group). Although longer for the mental health population, the 90th percentile wait times for the internally transferred group show non-significant differences between the wait experienced by mental health and non-mental health visits.
Among external transfers, it can be concluded that even though mental health patients experienced similar waits to be assessed by a physician in comparison to non-mental health patients (90th percentile of 3.2 hours versus 3.1 hours), they wait considerably longer to be transferred to another facility (90th percentile of 21.9 hours versus 10.0 hours). Again, the increased waiting time for final discharge in this population contributes to ED crowding. In smaller scales, similar differences in wait time are also reported in the United States, where externally transferred mental health patients experienced 90th percentile LOS of 11.9 hours versus 7.4 hours in the non-mental health group.Reference Hakenewerth, Tintinalli and Waller 13 Although the use of psychiatric emergency services, such as the PESU, may help meet the needs of mental health patients who look for care in the emergency rooms, these services have yet to offset the current shortage of inpatient resources.Reference Zhu, Singhal and Hsia 16
Further, the number of mental health related ED visits at TWH has grown by 55.7% from FY 2012 to FY 2016, similar to other institutions.Reference Newton, Ali and Johnson 8 , 10 , Reference Gandhi, Chiu and Lam 22 Thus, if the number of mental health visits keeps growing, which is expected given the upward trend observed in the past few years, the wait times for mental health patients are expected to deteriorate even further. Table 6 in Online Appendix A shows that the gaps in LOS between mental health and non-mental health visits have accentuated over time (FY 2012-2016).
A system-wide potential solution to reduce wait times in the ED is to invest in services that prevent patients from coming to the ED in the first place: primary and community care.Reference Zhu, Singhal and Hsia 16 , 33 , Reference Bender, Pande and Ludwig 36 , 37 The collaborative care model, a model initially developed for chronic disease management, has been applied in mental health care in several European countries. 39 The model brings together primary care physicians, case managers, and mental health specialists, to develop care plans 39 and diverts the attention from treating acute symptoms to primary care and prevention. The Schizophrenia Society of Ontario has also suggested the need to strengthen primary care by expanding the Family Health Care Team program to reduce ED wait times. 33
Within the hospital, solutions to reduce long ED wait times could include adding more inpatient beds to facilitate the outflow of patients from the ED.Reference Zhu, Singhal and Hsia 16 , 33 The use of dedicated emergency psychiatric services is another alternative to alleviate some of the ED workload.Reference Zhu, Singhal and Hsia 16 , 33 Because TWH already has the PESU, the hospital could likely benefit from increasing the number of PESU beds available. The use of mathematical tools, such as discrete event-based simulation, could assist in evaluating these changes and their impacts on the ED LOS.
Limitations of this study include the use of data from one ED only, potentially limiting the generalizability of the findings. However, it is important to note that several other urban hospitals in the Greater Toronto Area have a similar model of care, including St. Michael’s hospital, 40 St. Joseph’s Health Centre in Toronto, 41 and St. Joseph’s Healthcare Hamilton in Hamilton. 42 Moreover, the majority of mental health patients seen at TWH’s ED are not diverted to the PESU, so they follow the same process flow as they would in any other ED.
In retrospective studies like this (i.e., with large sample sizes), differences between clinical and statistical significance should also be addressed. It may be true that some of the wait times presented in this analysis may not be clinically relevant, despite showing statistical significance. However, as wait times increase, it becomes more likely that patient management and clinical outcomes will be negatively affected. Several authors describe the ED as a non-therapeutic environment for patients in mental distress 43 – Reference Clarke, Dusome and Hughes 45 ; especially for people feeling paranoid, psychotic, and suicidal, the noisy and frenetic environment in the ED can potentially escalate symptoms. 43 Hence, not only long wait times may be detrimental to the safety of mental health patients, but also it may compromise the safety of those around them (e.g., staff and other patients).
CONCLUSION
Using FY 2012-2016 data from a large academic hospital in Toronto, we evaluated the trends in ED visits for mental health conditions, as well as the differences in LOS for mental health-related visits versus other non-mental health conditions. The number of mental health visits to the ED is increasing over time, with a 55.7% increase in the last 5 years. The ED lengths of stay were significantly longer for mental health visits that were discharged, admitted, or externally transferred to another facility. Among admitted patients, boarding time constitutes the longest portion of the overall LOS for mental health patients. The disproportionate waits experienced by mental health patients highlight the lack of ED capacity to care for this vulnerable population. Thus, both system-wide and organizational changes are needed to improve the ability to provide care for the growing mental health population.
Uncited reference
Competing interests: None declared.