


CLINICIAN'S CAPSULE
What is known about the topic?
Supportive care is the mainstay of treatment for most infants with bronchiolitis, yet many still receive low-value care.
What did this study ask?
What is the impact of providing individual practice data on improving bronchiolitis care management?
What did this study find?
Individual practice and peer-comparator data, in addition to group-facilitated audit and feedback, reduced the use of low-value bronchiolitis care.
Why does this study matter to clinicians?
Audit and feedback and group-facilitated feedback sessions can be an effective method to reduce low-value interventions.
INTRODUCTION
Bronchiolitis is a viral respiratory tract infection and the most common cause for hospitalization in infants under 12 months of age in CanadaReference Friedman, Rieder and Walton1 and the United States.Reference Ralston, Lieberthal and Meissner2 Despite the commonality of bronchiolitis and the availability of clinical practice guidelines,Reference Friedman, Rieder and Walton1, Reference Ralston, Lieberthal and Meissner2 prior studies have shown that the management and treatment of bronchiolitis are variable and often inconsistent with best evidence.Reference Florin, Byczkowski and Ruddy3 This gap between best evidence and current practice provides an opportunity for quality improvement and reducing low-value care.
Due to the self-limited nature of bronchiolitis, supportive care is the mainstay of treatment for most patients. The Canadian Pediatric Society recommends supplemental oxygen and hydration for the treatment of bronchiolitis.Reference Friedman, Rieder and Walton1 Some studies suggest that epinephrine nebulization may be effective in the first 24 hours of care.Reference Hartling, Bialy and Vandermeer4 However, the American Academy of Pediatrics guidelines recommend against routine epinephrine use.Reference Ralston, Lieberthal and Meissner2 Pharmacotherapy, such as corticosteroids,Reference Corneli, Zorc and Mahajan5 bronchodilators,Reference Gadomski and Scribani6 antibiotics,Reference Farley, Spurling, Eriksson and Del Mar7 and antivirals, is not recommended because reductions in hospital admission rates or length of stay have not been observed. While chest radiographs and nasopharyngeal swabs do not improve diagnostic decisions or lead to changes in the management of most cases, they may be warranted in certain clinical scenarios.Reference Friedman, Rieder and Walton1
Due to existing evidence, rather than recommending specific interventions, bronchiolitis guidelines focus on reducing the overuse of low-value therapies.Reference Ralston, Comick, Nichols, Parker and Lanter8 Several projects have used quality improvement methodologies to reduce low-value therapies for bronchiolitis. Providing practice data, in addition to pledges of commitment from healthcare workers, has proven effective in reducing the use of bronchodilators, chest radiographs, and respiratory viral testing.Reference Tyler, Krack and Bakel9 Tailored comparisons along with personal explicit targets can increase the effectiveness of audit and feedback interventions,Reference Gude, Brown and Van Der Veer10 and contribute to actionable responses by staff.Reference Gould, Lorencatto and During11 Factors that influence the effectiveness of audit and feedback draw upon implementation science, motivational and behaviour change theory, and educational feedback.Reference Colquhoun, Carroll and Eva12 When healthcare professionals are provided with peer data and opportunities to self-reflect on their disease management decisions, stronger adherence to bronchiolitis guidelines can occur.Reference Sprecher, Chi and Ozonoff13 These studies suggest that practice variation and the gap between evidence and care in bronchiolitis can be identified and addressed using quality improvement methods. The primary aim of this project was to reduce low-value care by providing physicians with their practice and peer comparator data by hosting group-facilitated audit and feedback sessions.
METHODS
Population
We identified patients ≤ 12 months old, diagnosed with bronchiolitis, and seen at any of the 7 emergency departments (ED) in Calgary, Alberta, by a pediatric emergency physician (hereinafter physician) between April 1, 2013, and April 30, 2018. More than 99% of patients were from two EDs, the Alberta Children's Hospital (ACH) (89.9%), and South Health Campus (SHC) (9.8%), which has pediatric ED coverage. For the 2017-2018 fiscal year, there were 77,274 pediatric ED visits to ACH and 14,378 to SHC. ED visit information was extracted from data in the electronic medical record system used at all sites and the National Ambulatory Care Reporting System database. The patient population included cases with a first-time ED discharge diagnosis of viral pneumonia (ICD-10-CA J12*), acute bronchitis (ICD-10-CA J20*), acute bronchiolitis (ICD-10-CA J21*), unspecified acute lower respiratory infection (ICD-10-CA J22*), respiratory syncytial virus (ICD-10-CA B97.4*), wheezing (ICD-10-CA R06.2), or asthma (ICD-10-CA J45*). Ethics for this study was obtained from the Conjoint Health Research Ethics Board at the University of Calgary (REB17-0247). The reporting of this study followed the revised Standards for Quality Improvement Reporting Excellence (SQUIRE 2.0) guidelines.Reference Ogrinc, Davies and Goodman14
We excluded cases occurring in the out-of-season period (May 1–October 31) in this report for several reasons. Firstly, we only had in-season data for the intervention period. Secondly, the number of cases occurring out of season is low (16.6%). Thirdly, statistical process control charts data points representing a small number of cases will have considerably wider control limits.
Intervention
A study timeline including collection periods and interventions is summarized in Figure 1. Forty-one consenting physicians (of the 60 eligible) received an individual data report characterizing their bronchiolitis management between April 1, 2013, and March 31, 2017. Data reports outlined patient characteristics and initial presentation, investigations performed in the ED, medications administered, length of stay measures, admissions, ED revisit within 72 hours of index visit, and admitted to the hospital or pediatric intensive care unit (ICU) at return visit. Data reports compared individual practice to peer comparators at the 10th and 50th percentiles. Included in the data report was a summary of the Canadian Pediatric Society clinical guidelines for bronchiolitis.Reference Friedman, Rieder and Walton1
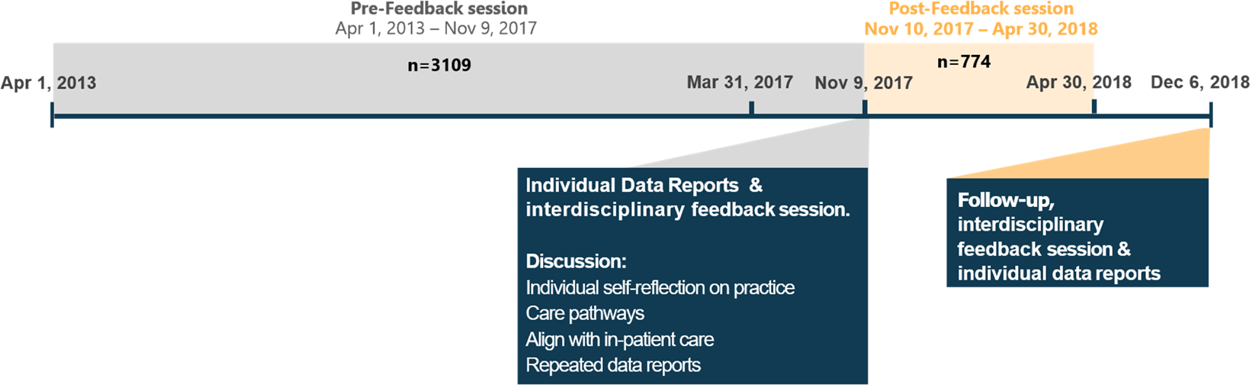
Figure 1. Timeline showing study periods and group-facilitated feedback sessions.
Physicians, respiratory therapists, nurses, hospitalists, and learners attended a multidisciplinary, group-facilitated feedback session on November 9, 2017. Two peer physicians facilitated the discussion using the Calgary Audit and Feedback Framework.Reference Cooke, Duncan and Rivera15 This framework fosters a socially constructed learning environment to aid recipients in moving from receiving and reacting to their data to action planning, which is based on theories from behaviour and performance change.Reference Sargeant, Lockyer and Mann16 Mediating factors used to make group-facilitated feedback sessions more effective include relationship building between the facilitator and physician group, addressing questions that are actionable by physicians, providing easily interpretable data visualization, and reflective questioning. At the end of the discussion, participating physicians were encouraged to complete a Commitment to Change Form (Supplementary Figure 1), where they identified three concrete, measurable changes to improve their bronchiolitis management.
To assess the effect of the intervention, we collected data for 6 months following the group-facilitated feedback session. Forty-seven consenting physicians received a second individual data report and attended a second group-facilitated feedback session on December 6, 2018. This session summarized their bronchiolitis management practice before the intervention (“baseline period,” April 1, 2013, to November 9, 2017) and 6 months following the intervention (“intervention period,” November 10, 2017, to April 30, 2018). This study reports on the bronchiolitis management practices of all physicians (consenting and non-consenting) in these two periods (up to April 30, 2018).
Outcome measures
The primary outcome was the proportion of patients who received at least one of the following low-value bronchiolitis management practices in the ED: salbutamol, respiratory viral test, or chest radiograph. The secondary outcomes included usage of the previously mentioned practices individually, and the administration of steroids or epinephrine. Balancing measures included admission to hospital, admission to pediatric ICU, ED, length of stay, and ED revisit within 72 hours. There were no missing values for the outcome or balancing measures.
Statistical analysis
We compared patient characteristics, outcomes, and balancing measures before and after the individual physician report distribution and the first group-facilitated feedback session on November 9, 2017, stratified by hospital admission status. For outcomes and balancing measures, we calculated differences and confidence intervals (CI) using two-sample independent proportion tests or two-sample independent t-tests (assuming common variance).
We described biweekly percentages of patients receiving the primary and secondary outcomes using statistical process control charts. The baseline period before the intervention was used to calculate the centre line (mean) and the control limits, ±3 SDs of the mean, were calculated using the formula for p-charts.Reference Mohammed, Worthington and Woodall17 To identify possible underdispersion or overdispersion in our data, we examined the difference between the p-chart and Laney P’ chart control limits.Reference Mohammed, Panesar, Laney and Wilson18 The control limits were similar so p-chart control limits were used for the rest of the analysis. Points outside of the control limits indicated special cause variation based on the Institute for Healthcare Improvement rules.Reference Macros19
We estimated the effect of the feedback session on the primary outcome using an interrupted time series design with segmented regression models.Reference Wagner, Soumerai, Zhang and Ross-Degnan20 Due to the relatively short intervention period, we did not have enough data to reliably estimate a slope. Therefore, we estimated a common slope in the baseline and intervention periods and a level change at the time of the intervention. Crude estimates were adjusted for hospital admission status.
All analyses were conducted using R version 3.5.0 (The R Foundation), and a two-sided p value < 0.05 was considered statistically significant. P values and CIs comparing secondary outcomes and balancing measures were not adjusted for multiple comparisons.
RESULTS
A total of 3,883 patients with bronchiolitis were treated in the ED during the five seasons (four in the baseline period and one in the intervention period). Table 1 shows patient characteristics in the baseline and intervention periods stratified by admission status. Admitted patients tended to have lower Canadian Triage and Acuity Scale (CTAS) scores and oxygen saturation levels compared to non-admitted patients. Patients had similar characteristics in the baseline and intervention periods.
Table 1. Patient characteristics by hospital admission status in the baseline and intervention periods
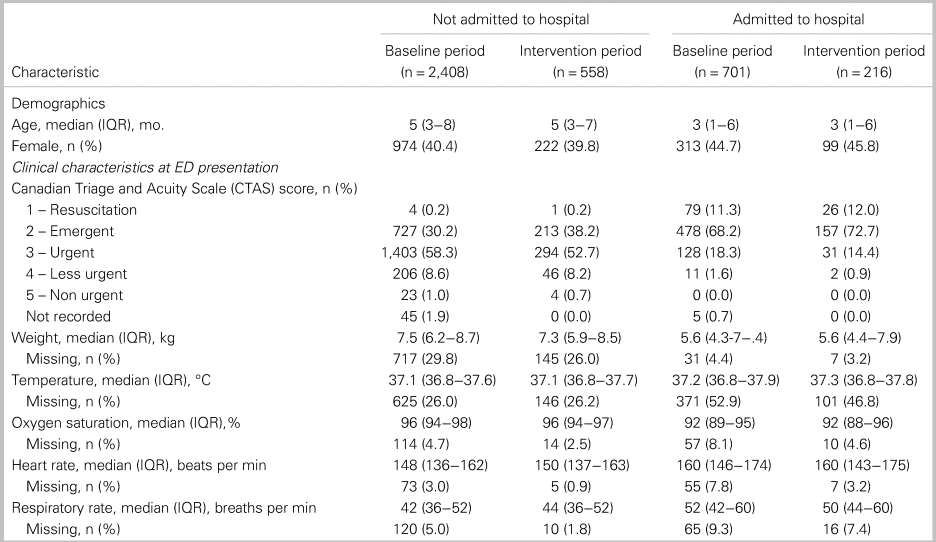
IQR = interquartile range.
For the primary outcome, a composite of three low-value bronchiolitis treatments and tests, the proportion of patients who received any of these three treatments or tests, decreased from 42.6% to 27.1% (absolute difference: −15.5%; 95% CI: −19.8% to −11.2%) and 78.9% to 64.4% (absolute difference: −14.5%; 95% CI: −21.9% to −7.2%) in patients who were not admitted and admitted to hospital, respectively (Table 2). In terms of the secondary outcomes, respiratory viral tests were ordered significantly less often in the intervention period in both groups, whereas salbutamol rates were significantly lower only for patients not admitted. There was no statistically significant change in the use of chest radiographs. ED length of stay decreased significantly for admitted patients, with no other interventions occurring that might have impacted patient flow during the time period. Regarding balancing measures, no statistically significant changes in admission to ICU (admitted patients only) or ED revisits within 72 hours of discharge were observed (see Table 2).
Table 2. Outcomes and balancing measures by hospital admission status and intervention periods
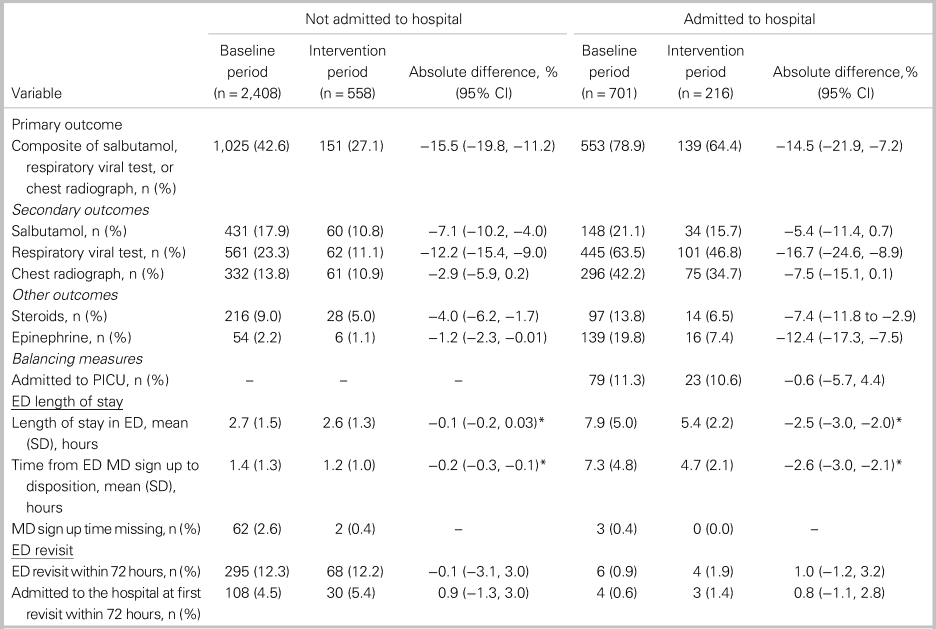
*Difference in mean.
IQR = interquartile range.
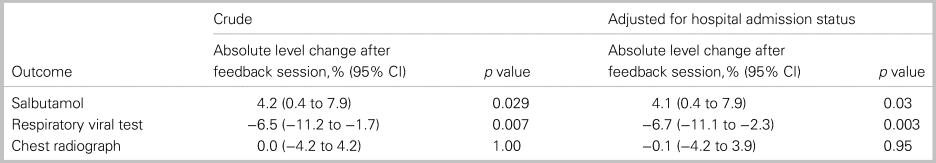
Process control charts for the percentage of patients receiving a low-value treatment or test are shown in Figure 2. Special cause variation indicated improvement for the composite outcome as well as the administration of salbutamol and respiratory viral test ordering (see Figure 2A-C). In the post-intervention bronchiolitis season, a run of 8 consecutive points below the centre line was observed for each of these measures. No special cause variation was observed for chest radiographs (see Figure 2D). Interrupted time series analysis supports the findings from control charts, where respiratory viral testing had an absolute decrease and no change was observed in chest radiographs (Table 3).
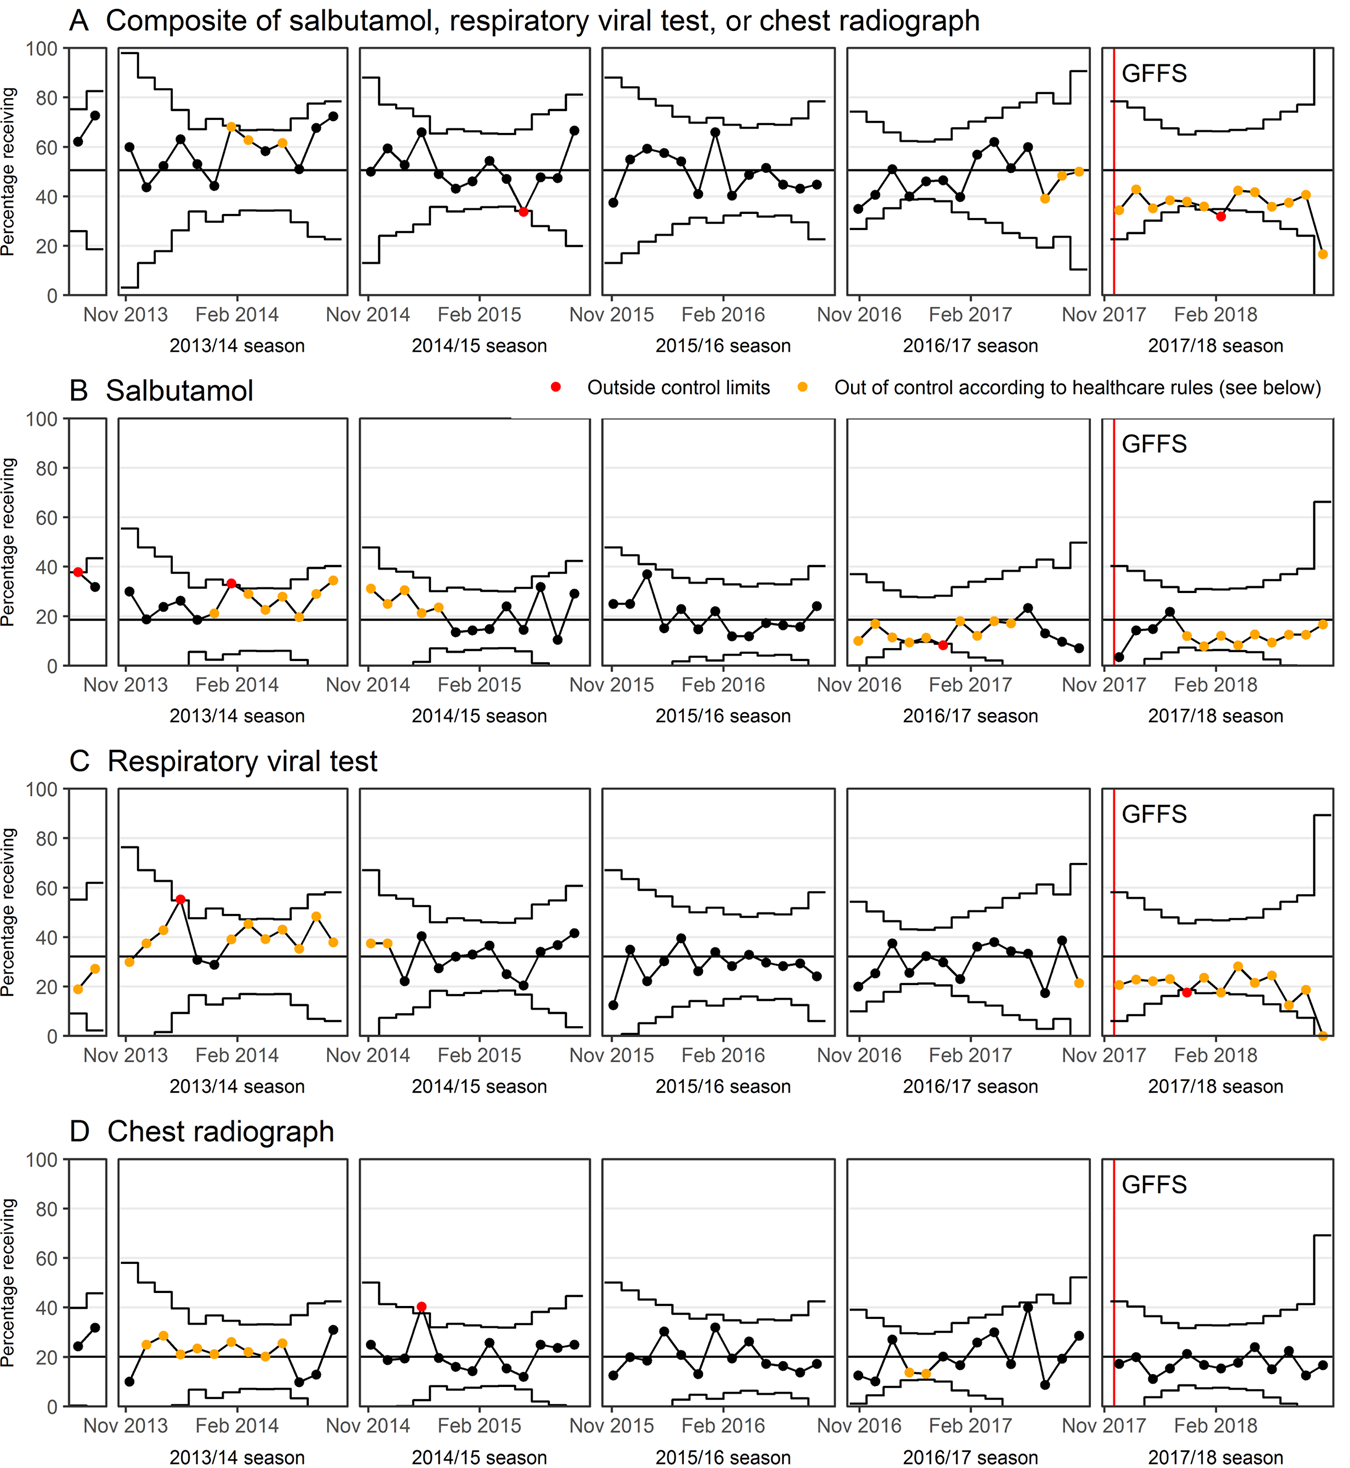
Figure 2. Statistical process control charts showing biweekly percentages of patients receiving several tests and treatments not recommended for the diagnosis and treatment of bronchiolitis before and after the GFFS (group-facilitated feedback session).
Table 3. Interrupted time series analysis results
Observations (from session recordings) from the two group-facilitated feedback sessions provided important perspectives on what physicians identified as current gaps in care (first session) and how the group-facilitated feedback sessions may lead to sustainable practice change (second session). In the first session, physicians identified strategies to reduce low-value interventions, including self-reflection on practice, following a care pathway, aligning ED management with in-patient care, and receiving repeated data reports. Themes emerging from the second group-facilitated feedback session included the group's reduction of low-value tests and medications, continuing to align practice with nurses and in-hospital physicians, and following the newly released practice order set.
DISCUSSION
Providing physicians with individual practice data, along with a group-facilitated feedback session, helped reduce low-value care for bronchiolitis patients in the ED. A composite of three tests (salbutamol, any respiratory viral test, and chest radiography) decreased by 14.5 and 15.5 percentage points for patients admitted and not admitted to hospital, respectively. Balancing measures, such as ED revisit within 72 hours, did not change.
Previous studies have shown similar findings that address bronchiolitis care management. In a quality improvement project for adherence to UK guidelines, there was a 38% relative reduction in salbutamol use,Reference Breakell, Thorndyke, Clennett and Harkensee21 while we observed a 35% relative reduction. In contrast, chest radiography use decreased 80% in the UK study, while we observed a modest 18% relative reduction for admitted cases. Some studies have shown that test use decreases depending on the patient group. In a tertiary children's hospital, the relative decrease in viral testing was 57% in ED patients and 11% for inpatients.Reference Hester, Lang, Madsen, Tambyraja and Zenker22 Use of bronchodilators in EDs had a relative decrease of 33%,Reference Hester, Lang, Madsen, Tambyraja and Zenker22 while we observed a 39% relative decrease in any bronchodilator use in ED patients (from 23.4% to 14.3%). In a multi-site collaborative project at 35 hospitals, site teams demonstrated absolute improvements of 12.6% and 17.2% for ED bronchodilator and viral testing use, respectively.Reference Mussman, Lossius and Wasif23 Quality improvement projects can be useful to advance patient outcomes and avoid unnecessary harm that can arise due to practice variation in the management of bronchiolitis.
Hospital readmission is a healthcare quality indicator and highlights areas where potentially preventable readmissions can be minimized in efforts to curtail rising healthcare costs. Bronchiolitis is one of the top five potentially preventable readmissions to a hospital within 30 days with an estimated cost of USD 14 million.Reference Gay, Agrawal and Auger24 A retrospective analysis of 267 patients suggested that higher adherence to clinical pathway recommendations were associated with shorter length of stay for both ED and inpatients.Reference Bryan, Desai, Wilson, Wright and Mangione-Smith25 Additionally, costs were lower for patients in the highest tertile of adherence.Reference Bryan, Desai, Wilson, Wright and Mangione-Smith25 We observed that ED length of stay decreased post-intervention for admitted patients, which suggests our bronchiolitis intervention may have contributed to improved healthcare efficiency.
Limitations
A higher proportion of cases admitted in the intervention (28%) compared with baseline (23%) periods could have influenced our intervention to reduce low-value bronchiolitis testing. It is possible that the bronchiolitis season in the intervention period was more “severe” relative to the seasons in the baseline period and patients in this cohort presented with more substantial symptoms in the ED. Choosing Wisely Canada recommendations could have influenced physicians prescribing antibiotics,Reference Cheng, Campbell and Chartier26 yet that was not a primary focus of the intervention. We were also limited to one bronchiolitis season post-intervention. However, previous studies have only measured an intervention effect for one season.Reference Cheng, Campbell and Chartier26,Reference Reiter, Breuer and Breuer27 The majority of physicians (78%) consented for individual data, yet the possibility of bias due to consent and the impact of the intervention on low-value care is currently unknown. Further research is needed to understand the influence of receiving individual data reports compared to not participating in feedback sessions. Although U.S.-based studies have clearly shown a cost-benefit for reducing low-value bronchiolitis interventions, the price differences between the two healthcare systems warrant a separate analysis to determine the cost reductions in a Canadian healthcare system.
The strengths of our project include the participation rate of physicians, engagement of a multidisciplinary team, the use of administrative data which is replicable rather than data-based on chart review, and our analysis plan which used statistical process control charts. A final strength is our use of audit and feedback to address low-value care in the ED. The audit and feedback process has strong evidence to support its use in multiple clinical areas.Reference Ivers, Jamtvedt and Flottorp28 Our approach to audit and feedback provides clinical performance data that are actionable to change, in both written and verbal formats and presented by a respected, credible colleague to help optimize interventions.Reference Brehaut, Colquhoun and Eva29 Further, The Calgary Audit and Feedback Framework fosters socially constructed learning and helps plan for change by focusing on relationships, question choice, data visualization, and facilitation.Reference Cooke, Duncan and Rivera15 Given the relative low cost of the intervention, and how common bronchiolitis is, this project has the potential for broad scale and spread.
CONCLUSIONS
Providing individualized practice data reports to physicians and hosting a group-facilitated feedback session led to a reduction in low-value care for infants with bronchiolitis. Exploring opportunities to spread and scale similar initiatives will provide additional support that low-value care can be identified and reduced, while longer follow-up with multiple bronchiolitis seasons will provide data on sustainability of practice changes. Use of audit and feedback and group-facilitated feedback session should be considered as a quality improvement strategy to reduce low-value care.
Competing interests
None declared.
Supplementary material
The supplemental material for this article can be found at https://doi.org/10.1017/cem.2020.374.
Acknowledgements
We would sincerely like to thank Charlene Feuffel, Brock Setchell, and Najla Samardzic from Alberta Health Services for their data and analytical support for this project.
Financial support
This research received no specific grant from any funding agency, commercial, or not-for-profit sectors.


