


Impact Statement
The process for obtaining a required dataset from these asset owners can be challenging, even when undertaking approved industry-academic projects. Approval processes differ between organizations. Often the decision is left to individual managers whose attitude to, and motivations for, releasing data for research work vary widely. When data are provided to the researcher, unilateral restrictions on subsequent publication of results and/or data are often imposed, irrespective of the data contents. In the past, these issues have delayed research commencement, limited the pool of academics willing to work on these projects and degraded research outcomes. The DRAT offers an alternative, transparent decision-making process that has been made publicly available under a Creative Commons Attribution 4.0 International License. The tool ensures that (a) recommended restrictions and controls are based on the actual risk posed by a dataset (rather than a one size fits all approach), (b) the data owner’s needs for confidentiality are appropriately managed, and (c) the potential for research value is maximized.
1. Introduction
Engineering asset management (EAM) encompasses the processes, systems and human factors involved in managing the life cycle of engineering assets and the systems within which these assets operate. To demonstrate the impact of EAM research it is necessary to change the way asset management is conducted in asset owning organizations. This necessitates interaction with asset owners, and in the case of data-centric engineering research work, access to an organization’s data. This is often undertaken through formal University–Industry Collaborations.
EAM data are held in enterprise resource planning systems, manufacturing execution systems, computerized maintenance management systems, condition monitoring databases, asset registers and supervisory control and data acquisition systems, to name just a few. Access to this data is necessary to build and validate a wide range of models including those developed by reliability engineers, the prognostic health management community and maintenance optimization researchers. To achieve robust validation, data from at least one (preferably more than one) industry partner are required. However, a recent review of process system failure and reliability literature reports that “collaborative works between industry and academia are observed to be rare” (Amin et al., Reference Amin, Khan and Zuo2019) and we have shown elsewhere that few published models in this field are validated using industry data (Webb et al., Reference Webb, Sikorska, Khan and Hodkiewicz2020). We suggest that data-sharing in the field of EAM is sufficiently problematic as to be reducing the progress of the field by restricting researchers’ access to data required to develop effective models for asset life prediction and to improve maintenance management practice.
Over the past 10 years, academia has been seeing an increasing push toward open science; this paradigm is reliant on “open data,” with increasing encouragement from publishers and funding government institutions for authors to release the data from which their research conclusions are derived (Sikorska et al., Reference Sikorska, Hodkiewicz, De Cruz, Astfalck and Keating2016; European Commission, 2020; ODI, 2020). In some industries, such as genomics, astrophysics, epidemiology, and geospatial research, this move has been embraced because it has enabled research that could not have been performed otherwise; the effort and costs to acquire such large datasets are simply too prohibitive for any one institution. A number of initiatives have arisen, such as FAIRsharing.org (FAIRsharing.org, 2020), EU Support Center for Data Sharing (SCDS, 2020), ISO/IEC JTC 1/SC 4, W3.org, Platform Industrie 4.0 and the European Data Strategy, to guide data producers and consumers on how to enable data sharing. However, most of the available documents prepared by these organizations pertain to the micro-details of how to structure data to enable its collation and use, rather than guides for what and how to share between independent organizations. The challenge of how to assess and manage the risks of sharing data pertaining to asset performance, specifically for EAM researchers, is the focus of this paper.
2 Background
2.1. Data-sharing practice in the engineering sector
All asset owning organizations have formal risk assessment processes and risk management is integrated into everyday practice in most corporate processes. There are six stages in the risk management process presented in ISO 31000 as shown in Figure 1 (Australia, 2018a): (a) scope, context, criteria, (b) risk assessment, (c) risk treatment, (d) monitoring and review, (e) communication and consultation and (f) recoding and reporting . However, there is no specific international standard or widely accepted guidance note on how to apply the processes described in ISO 31000 to sharing data. Information technology standards, such as the AS ISO/IEC 27000 series (Australia, 2018b) tend to focus on the safety of their information while it is under the data owner’s control. A recent report by the European Commission claims that “currently there is not enough data available for innovative re-use, including for the development of artificial intelligence…[and]… data sharing between companies has not taken off at sufficient scale” (European Commission, 2020). Similar findings, published by the Open-Data-Initiative suggest that very few industrial companies are willing to share their data (ODI, 2020). Of 2060 industry workers surveyed, only 27% of their employing businesses shared data. Furthermore, the readiness of businesses to share data by having a data strategy which encompassed “a vision for how the company will collect store, manage, share and use data” varied significantly across sectors; the best performers were in the finance and accounting sector, where up to 82% of businesses had a formal strategy (either specific or built into other systems), while engineering design or architecture businesses were the worst performers, with only 36% having any type of strategy. 67% and 60% of manufacturing and construction businesses respectively had some form of strategy. However, having a strategy is not sufficient to enact data sharing, as the survey reported that only 59% of British businesses with a strategy shared data with third parties. This is a problem for researchers, as rich and complete datasets with well-documented meta-data are a necessity for analytical modeling and decision-making. The Open-Data-Initiative survey suggests that engineering focussed businesses are less prepared to share data in other sectors (ODI, 2020). The impact of this is that there are very few examples of EAM data based on real industry data from operating sites publicly available to researchers (Sikorska et al., Reference Sikorska, Hodkiewicz, De Cruz, Astfalck and Keating2016).
ISO31000 risk management process (ISO, 2018a).

2.2. Data sharing roles in university industry collaborations
Figure 2 considers the roles involved in the process of data release for EAM related data to a University-Industry (UI) research project. These are the academic collaborator (data scientist), and their assigned industry contact (industry collaborator). Often the industry collaborator is a research project manager and not an EAM subject matter expert (SME). The industry collaborator needs to locate an appropriate SME, identify the data that meets the needs of the academic collaborator and then make contact with the data custodians. Once the data sets have been located and retrieved, they need to be risk assessed and a decision made about their release. This decision requires a review by the corporate legal group who will then look for a manager to take accountability for, and sign off on, the data release. The SME, data custodian, manager and legal group will often have little knowledge of the UI collaboration and, depending on their maintenance and engineering experience, little direct understanding of the raw data. Yet by virtue of their roles in the organizational hierarchy, they all play a role in the decision to approve or reject release of the data.
Team roles in university and asset-owning industry collaborations.

2.3. Security risks from shared data
Risk is commonly defined as a function of the probability of an adverse event (or threat) occurring and the consequences of that event. When sharing data, the data owner (industry partner) is vulnerable from their data: (a) being maliciously used by the researcher or a member of his/her institution who has access to the data; (b) being lost by the researcher and finding its way into the hands of a malicious third party who understands how to exploit the data; or (c) being stolen by a malicious third party intentionally accessing the information without the researcher’s knowledge. In cases (b) and (c), the likely consequences will be less than if the data were accessed from the data owner’s facilities, as the third party would have to know where the information originated and the volume of accessible information would usually be much less. The consequences of any of these events are also affected by the type of data, or what it contains. As discussed earlier, EAM research predominantly relates to information about equipment performance and maintenance history. Personal private data are rarely used and thus should be assessed on a case by case basis. For obvious reasons, there is no agreed list on what business drivers are important to all organizations as the potential economic impact of an information security incident must ultimately be speculative (Cashell et al., Reference Cashell2004).
There is no published research into the relative importance of potential threats to an organization from lost asset-related data. Instead, we propose that information relating to health, safety and environmental variables, which are often collected for regulatory compliance purposes, are deemed the most sensitive because they could pose the most serious consequences to the data owner; should they be found to be in breach of any health, safety, and environment (HSE) operating requirements, the company could be fined, suffer from bad publicity and lose customer confidence, or even potentially lose their license to operate. The next most damaging type of data would be information that pertains to current operational capabilities or financially sensitive data that may jeopardize a company’s competitive advantage or its relationship with third parties. Older operational or financial data, that is, no longer current is of less importance, with maintenance data pertaining to common and nonoperationally critical assets being of least value to third parties. Information that can easily identify the company increases the consequences to the data owner, especially when coupled with other higher risk categories (HSE, current operational data) and hence increases the risk. Unfortunately, actual risks are not the only factor in decision-making.
2.4. Concerns in data sharing
Reasons for reticence in data sharing between organizations, organization-to-organization and organization–researcher groups include: (a) inadequate economic incentives, (b) lack of trust, (c) fear of data misappropriation by third parties (d) loss of privacy, particularly the risk of re-identification, (e) lost or reduced intellectual property value of their data, (f) negative consumer/customer/user reaction and (g) risks to regulatory compliance associated with how researchers use their data (Bruneel et al., Reference Bruneel, D’este and Salter2010; Harris and Sharma, Reference Harris and Sharma2017; European Commission, 2020).
Data associated with personal data are of specific concern to management as organizations operating in Europe collect and manage personal data in accordance with The General Data Protection Regulations (GDPR) (GDPR, 2018). Similar legislation exists in non-EU countries, most of which impose heavy fines for data breaches (Ponemon Institute, 2019). Consequently, the bulk of published literature pertains to security management to prevent loss of employee or customer private data. In this paper, however, we are explicitly concentrating on physical asset data and therefore considerations of GDPR are not considered.
Another cause for reticence in sharing data occurs at a more practical level. Costs associated with the time and effort required by company employees to locate and extract the data, often from disparate systems, as well as supply and document associated meta-data, can be considerable. Thus, industries in which data are mostly highly automated, well-structured and easily understood are more likely to share data (Couture et al., Reference Couture2018; ODI, 2020). Similarly, individuals are less likely to want to share data if it is labor-intensive to do prepare (Borgman, Reference Borgman2012). As noted earlier EAM data come from numerous data sources and is often very difficult to aggregate and assimilate (Webb et al., Reference Webb, Sikorska, Khan and Hodkiewicz2020). Some of it can even be kept in proprietary systems and thus not possible to extract in an appropriate form.
ISO 31000:2018 is a risk management framework widely used across all industries (ISO, 2018a). Its main process is shown in Figure 3. The ISO/IEC 27000:2018 (ISO/IEC, 2018b) is a set of more than five standards dealing with Information security management and is based on the principles of ISO 31000. The appendix of ISO 27005 helps users scope their assessments in terms of assets, threats and best practice, and is seen as best practice in information security risk management (Wangen, Reference Wangen2017). NIST Special Publication 800-30 Revision 1 is often used in conjunction with ISO27005 to guide risk assessments (Stoneburner et al., Reference Stoneburner, Goguen and Feringa2002). Other approaches are also available and have been reviewed extensively in (Gritzalis et al., Reference Gritzalis2018). Most of these describe general principles and do not specify how the risk assessment should be performed (Sendi et al., Reference Sendi2010). Engineering techniques, such as Hazard and Operability Analysis (HAZOP), Failure Modes and Effects Analysis (FMEA) and quantitative risk assessment (Cameron et al., Reference Cameron and Raman2005; Smith, Reference Smith2017), are also sometimes used by IT professionals for assessing information associated risk within their organizations and are incorporated into some of the processes listed. However, in such cases, the process for assessing risks is based on a detailed desktop study by experts that takes into account all the possible ways that the data could be accessed and used nefariously, perform probability assessments on each, and then predict the consequences of each event occurring. This is a lengthy and hence costly process, so is not normally performed on an individual piece of data. It is too complex and onerous a process for approving research data requests that must be done quickly with the limited imposition on the industry partner.
Influences on the accountable manager’s decision-making for the release of EAM data to researchers.

2.5. Establishing accountability for data release
The concept of responsibility is central to the notion of collective agency and organizations. If something goes wrong, individuals are identified as being responsible for the bad event; they can then be held “accountable” and “blamed” (Grossi et al., Reference Grossi, Royakkers and Dignum2007). Releasing data to research partners requires one individual to take responsibility and be held accountable for approval. In the absence of a formal organizational process for this, an individual manager has to perform their own risk assessment. When unguided and without support, the accountable manager’s decision will be determined by factors such as agency, expertise, risk profile, personality, prior experience working with academia, and level of trust in both the project and its academic collaborators (Dirks and Ferrin, Reference Dirks and Ferrin2001; Bruneel et al., Reference Bruneel, D’este and Salter2010; Dingler and Enkel, Reference Dingler and Enkel2016; Tan, Reference Tan2016; European Commission, 2018). Figure 3 shows the accountable manager’s perception of benefit and perception of risk as two separate constructs. These perceptions are driven by the individual factors mentioned and moderated by organizational factors such as intra-organizational trust and the performance management structure; a rigid performance management structure and low levels of intra-organizational trust will drive the individual manager to perceive that approving the data’s release carries a higher level of risk (than in organizations with high trust and flexible performance structures).
2.6. Trust and control in university–industry collaboration
In collaborative projects, it is important that entities have a high degree of perceived certainty that their partners will cooperate satisfactorily and not behave opportunistically. This is known as “partner cooperation” and is comprised of two elements: inter-organizational trust and control (Das and Teng, Reference Das and Teng1998). In an alliance, control is the “regulatory process by which the partner’s pursuit of mutually compatible interests is made more predictable” (Das and Teng, Reference Das and Teng1998). Contracts and legal agreements are an important part of this landscape. In UI projects, these agreements describe how IP is to be shared as well as the level of editorial input required prior to publication and whether data used therein can be released. Although time consuming to negotiate, these agreements provide some certainty for both parties and establish expectations.
Trust (be it inter-organizational, intra-organizational or inter-personal) is defined as the “the willingness of a party to be vulnerable to the actions of another party based on the expectation that the other will perform a particular action important to the trustor, irrespective of the ability to monitor or control that other party” (Mayer et al., Reference Mayer, Davis and Schoorman1995, p. 712) and is critical in enabling cooperating behavior (Gambetta, Reference Gambetta and Gambetta1988). It involves both choice and an element of risk (Vlaar et al., Reference Vlaar, Van den Bosch and Volberda2007). Trust is also highly reciprocal: trust evokes trust, distrust evokes distrust and as the level of trust reduces it is replaced with mistrust (Fox, Reference Fox1976). Research has shown that higher levels of intra-organizational and inter-personal trust are associated with greater knowledge sharing, greater willingness to collaborate and more pertinently, reduced barriers to releasing datasets and supporting information (Dirks and Ferrin, Reference Dirks and Ferrin2001; Gopalakrishnan and Santoro, Reference Gopalakrishnan and Santoro2004; Bruneel et al., Reference Bruneel, D’este and Salter2010; Dingler and Enkel, Reference Dingler and Enkel2016; Tan, Reference Tan2016; European Commission, 2020). Organizations, and the individuals within them, are more likely to share data with researchers and institutions they have worked with previously, or whose reputation is well known (Bruneel et al., Reference Bruneel, D’este and Salter2010). Methods to increase trust include regular communication, team building activities and shared tasks so that the team can develop a shared culture as well as and an understanding of each other’s abilities.
Whether trust and control are contradictory or complementary factors (Das and Teng, Reference Das and Teng1998; Cristina Costa and Bijlsma-Frankema, Reference Cristina Costa and Bijlsma-Frankema2007) is a matter of some controversy among academics. Some researchers argue that high levels of control can be perceived as an indication of mistrust (Argyris, Reference Argyris1952; Sitkin and Roth, Reference Sitkin and Roth1993), while others argue that control mechanisms if used properly, can help build mutual trust (Goold and Cambell, Reference Goold and Cambell1987; Sitkin, Reference Sitkin, Bies, Lewicki and Sheppard1995; Edelenbos and Eshuis, Reference Edelenbos and Eshuis2012). Others suggest that this is because there are different types of control measures, and controls only erode trust if the method is not appropriate for the situation (Kirsch, Reference Kirsch1996; Sitkin and Stickel, Reference Sitkin, Stickel, Kramer and Tyler1996; Evans, Reference Evans2010). While output controls (prescribing specific performance goals) can negatively affect trust, process controls (rules, goals, procedures, and regulations that specify desirable patterns of behavior) and social controls (utilizing organizational values, norms, and cultures to encourage desirable behavior) improve trust levels (Aulakh et al., Reference Aulakh, Sahay and Kotabe1996). The latter (social control) seems to be the most effective at improving trust because these “soft” behavior guidelines, associated with terms such as “recommended” or “informal,” require an element of personal judgement on behalf of the trustee; these controls do not stipulate what must be done but rather what should be done based on shared goals, values and norms. However, like trust, social controls can only be implemented slowly as it takes time to nurture a sense of shared responsibility, culture and community. It is thus likely that process controls can be particularly beneficial in the early stages of a relationship before social controls are possible and higher levels of trust have been developed.
The propensity of companies to enter UI collaborations has been shown to differ across sectors (Bekkers and Freitas, Reference Bekkers and Freitas2008). Companies belonging to sectors that do not change rapidly, such as mechanical and civil engineering, are in fact much less likely to collaborate with universities (Meyer-Krahmer and Schmoch, Reference Meyer-Krahmer and Schmoch1998; Schartinger et al., Reference Schartinger2002), when compared to more R&D intensive manufacturing industries such as pharmaceuticals, biotechnical and aerospace. Companies in rapidly changing industries are much more likely to perceive a benefit from collaborating with universities and transferring up to date knowledge as they rely that on academic knowledge and basic scientific research for developing their next products or services (Bekkers and Freitas, Reference Bekkers and Freitas2008). Thus, it is expected that such companies would enter a new collaboration with higher levels of initial trust than those working in industries where the short-term benefits are more ambiguous.
Another reason for low levels of trust in a new UI collaboration may be due to the different motivations and environmental drivers of the collaborating parties. Universities (and government-funded research institutions) are primarily driven by the need to create new knowledge and share the results as widely as possible for the greater scientific good; or in the words of the UK Research Institute: “to ensure everyone in society benefits from world-leading research and innovation” (UKRI, 2020). As international university ratings are strongly affected by citation rates and research impact (QS World University Rankings, 2020). Regularly reducing a university’s capacity to publish in high-quality journals will eventually impact its financial performance as it has been shown that the lucrative international student market is affected by a university’s ranking (Griffith and Rask, Reference Griffith and Rask2007; Horstschräer, Reference Horstschräer2012; Broecke, Reference Broecke2015; Gibbons et al., Reference Gibbons, Neumayer and Perkins2015).
This is also true for individual researchers. University academics must publish prolifically in reputable journals in order to increase their personal reputation and standing within the scientific community, obtain promotion within their research institution and to obtain research funds for future projects (Piwowar et al., Reference Piwowar, Day and Fridsma2007; Evans, Reference Evans2010; Kim and Zhang, Reference Kim and Zhang2015). Recent evidence also suggests that publishing supporting datasets increases academic citation rates (Piwowar and Chapman, Reference Piwowar and Chapman2010; Henneken and Accomazzi, Reference Henneken and Accomazzi2011). Therefore, undertaking projects with publication restrictions can limit an academic’s future career opportunities. Increasingly, journal publishers are requesting that supporting datasets be made available so research can be verified or replicated, although this is still not widely practised because individual reward mechanisms considerations for academics associated with keeping data for private use and selective distribution are stronger than the drive to open-science (Fecher et al., Reference Fecher2017). Data sharing requirements by publishers are also much less prevalent in engineering than in other sectors (Naughton and Kernohan, Reference Naughton and Kernohan2016; Wiley, Reference Wiley2018; Wiley, Reference Wiley2020). It should also be mentioned that even when journals require that data be shared and the authors do so, research has found that much of the data are not subsequently available (Nelson, Reference Nelson2009; Fecher et al., Reference Fecher, Friesike and Hebing2015; Fecher et al., Reference Fecher2017).
Businesses, on the other hand, need to maintain a competitive advantage, which necessitates that pertinent knowledge remains private long enough for it to be leveraged (Evans, Reference Evans2010). Thus, by necessity, companies are usually reticent to publish results, or wish to do so in a way that maximizes the advantage to themselves as the funding (or provisioning) organization, while minimizing the benefit to competitors. They also need to obtain results much more quickly (Alexander et al., Reference Alexander2018). Industry researchers, unsurprisingly, publish much less frequently in journals and are more likely instead to publish their ideas as patents (Anthony et al., Reference Anthony, Enno and Steven2004), for which supporting data is never required. They are also less likely to share information with one another than their academic colleagues (Haeussler, Reference Haeussler2011). This is not necessarily because of any inherent differences in the personalities of the researchers but because they are exposed to different constraints and competitive interest considerations (Anthony et al., Reference Anthony, Enno and Steven2004; Haeussler, Reference Haeussler2011).
The attitudinal misalignment between industry and academic partners can result in some degree of mistrust between collaborating parties, especially when the collaborative team is newly established and the organizations have not worked together before (Bruneel et al., Reference Bruneel, D’este and Salter2010). This naturally limits knowledge sharing and full disclosure until parties are assured their interests will be adequately satisfied by the partnership. We propose that process controls can be beneficial in establishing expected behavior early in the collaboration.
3 DRAT tool development
3.1. Requirements
Taking into account the issues described above and in Table 1, we propose the following requirements. These requirements are linked to the factors identified above. Specifically, the need for a process that provides a decision tree for managers based on a set of questions, a process, that is, familiar (in this case, ISO 31000), is independent of personalities and prior working relationships with industry researchers and provides an established and approved process for the manager to follow.
Requirements for a process to support data sharing for EAM data between universities and industry.
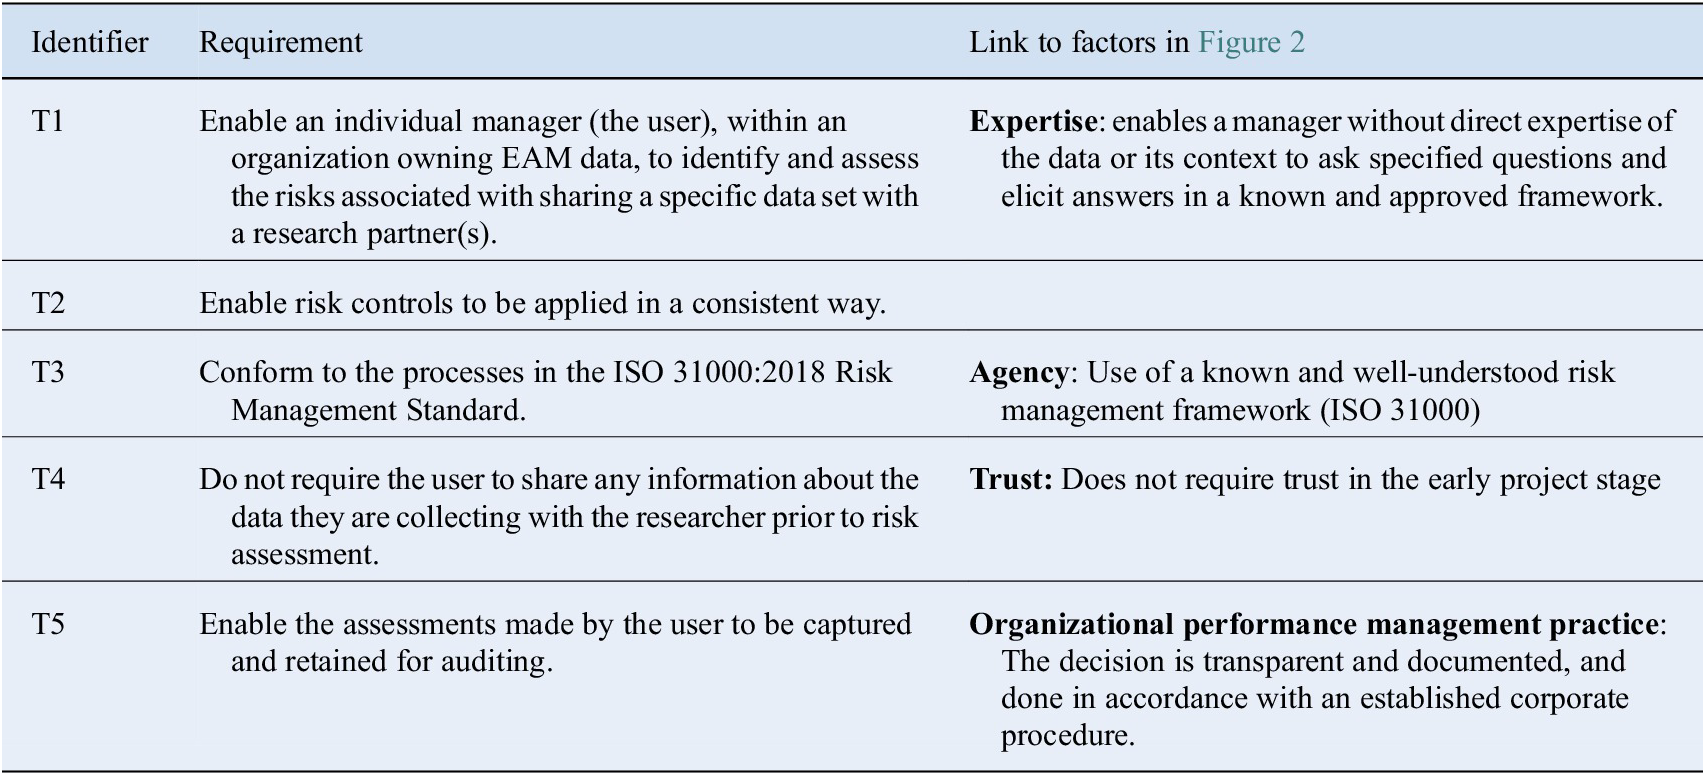
Abbreviation: EAM, engineering asset management.
3.2. Process
We propose a tool to guide the manager and others involved in the data release process shown in Figure 3. The data risk assessment process is conceived as a flowchart that asks a series of yes/no questions. Flowcharts are widely used in business processes to guide decision-making. The DRAT tool follows the steps in the ISO 31000:2018 standard starting with risk identification, moving onto assessment treatment and recording, and envisages feedback loops for communication and consultation and monitoring and review.
3.3. Risk identification and assessment
Firstly, questions are asked about the type of data that has been requested.
(a) Does the dataset in the rawest available form (RAF) contain personal data about people? (This is to clearly exclude personal data from the analysis and highlight to the reviewer that this must be analyzed separately).
(b) (If no) Does, the RAF dataset contain data about equipment, people or processes required to ensure HSE or regulatory compliance?
(c) (If no) Does the RAF dataset contain highly sensitive cost or operations data?
Depending on the type of data, other questions are asked about the importance of the data to the project and/or the ability to anonymize the data without affecting the usefulness of the research work. If the data do contain sensitive information, the user is asked whether the data contain potentially less sensitive data as well (i.e., safety and cost data). Finally, questions are posed regarding the desire and ability to anonymize the specific data attributes. The final risk ranking is based on the cumulative residual risk. We have taken the approach that anonymization should be performed as late in the process as feasible, to maximize research analysis options.
This DRAT process classifies company dataset risk into five grades from Highly Safe (with no perceived risk of adverse events from data release) Corporate data, to Unsafe (very high risk of adverse events from data release) Corporate Data. An additional level is also identified for Potentially Unsafe Personal that should be analysed separately. The resulting classifications are summarised in Table 2.
Summary of risk rankings acronyms used.

Abbreviations: HSE, health, safety, and environment; O&M, operation and maintenance.
The next stage is to establish risk treatment, also called controls. To do this we considered a number of approaches (such as NIST SP 800-53:Appendix D (Stoneburner et al., Reference Stoneburner, Goguen and Feringa2002), CRAMM (CRAMM, 1987), OCTAVE (OCTAVE, Reference Alberts, Behrens, Pethia and Wilson2006), and settled on the Five Safes framework as it was the only one specifically designed for sharing data, and did not require a quantitative evaluation of risk factors. The Five-Safes framework is a well established system-based approach developed by the UK Office for National Statistics in 2003 (Desai et al., Reference Desai, Felix and Welpton2016; Ritchie, Reference Ritchie2017) and is specifically designed for sharing personal data. Initially, it was used mostly by statistical agencies (e.g., the ABS) and social science academics but has since been more widely adopted by government, health and private sector bodies to share inter-agency data. For example, the approach was recently used by the Data Taskforce, led by the Australian Computer Society and the NSW Data Analytics Center (with input from various Australian government agencies and Corporations) as the basis for its white paper describing a framework to support automated data sharing between governments and institutions in an Australian privacy context (ACS, 2017). The Five Safe’s framework is made up of five “safe” dimensions, each of which describes an independent but related aspect of disclosure risk as follows.
Safe data—Has appropriate and sufficient protection been applied to the data to prevent the identification of an individual company?
Increasing the safety (reducing the risk of identification) can be undertaken by ensuring that the minimum cohort size (number of individuals with the same features) is greater than one, aggregating the data so that attributes as less diverse (e.g., grouping attribute values into broader categories so that the minimum cohort size is increased) or anonymizing the data. This can be considered when working with multiple organizations within one research consortium or when undertaking private projects. However, often a company can be identified by association with a government grant that must be acknowledged; in this, it must be assumed that identification will occur. As safety decreases (risk of identification increases), other “safes” need to be increased to manage the overall risk.
Safe projects—Is the data to be used for an appropriate purpose?
The less safe the data (i.e., more likely identification can occur), the more scrutiny needs to be undertaken in order to ensure that data is only used for pre-approved projects. Conversely, for data, that is, deemed completely safe (i.e., re-identification is not possible or is permitted and/or desired) then there is no risk of making data publically available and projects do not need to be preapproved (nor can they be once the data is public).
Safe people—Is the researcher appropriately authorized to access and use the data?
This element relates to the level of trust that the data owner places in a researcher to ensure that the dataset is managed in accordance with the agreed processes and procedures, both during the research and once it has been concluded. For projects and datasets deemed less safe, additional requirements or restrictions may be placed on who can access the dataset. This may include additional training, the signing of specific confidentiality agreements, or even government-approved checks (e.g., security clearances).
Safe settings—Does the access environment prevent unauthorized use?
This element refers to how the data can be obtained and the practical controls to ensure the data are not inadvertently or purposefully released. Data shared on publicly available internet sharing sites will have a very low safe setting level, while at the other extreme, data, that is, only available on a single computer in a locked room with no internet access and with armed guards at the door to check that mobile devices are not taken into the room, will have a very high safe settings level. The appropriate level will depend on the levels of the aforementioned elements.
Safe outcomes—Are the results nondisclosive?
This element considers the residual risk that the company owning the data are, and does not want to be, specifically identified as the source of the research outcomes. It is predominantly dependant on the safe data level. When less safe data are being analyzed, outcomes will most likely require aggregation, anonymization and obfuscation before they can be published; this may also require confirmation by expert statisticians or the data owner to verify the company cannot be recognized.
Table 3 describes for each level of data classification, minimum controls that should be considered against each of the Five Safe’s dimensions. It is important to recognize that these suggested controls are the minimum standards proposed to manage the risk appropriately. If contracts between the research parties contain specific requirements that exceed these levels (e.g., that all outputs are approved prior to publication), then the more stringent control must of course be applied.
Minimum controls for each data risk classification against the Five Safe’s dimensions.

Abbreviation: DRAT, data risk assessment tool.
To facilitate easier use, as well as ensure traceability and repeatability, a web-based tool was developed to enact this process. It presents the questions as requiring YES or NO answers, and offers guidance in cases where the user is not sure of which answer to select. The results and recommendations are saved in a pdf format, which can then be submitted for final approval as per the company’s usual risk management processes. This is available at https://drat-process.com.au/home.
4 Case study
The case describes a research project on the potential to set regionally specific asset planning performance targets for waste water blockages (Green et al., Reference Green2016). Current practice is to have one corporation-wide target but there are widely different situations in the regions with some regions always well below the target and others well above. The overall performance of the corporation in wastewater blockages per 100 km is reported to their economic regulator. Data considered necessary for the project included pipe age, type, network length, population, rainfall, capital spend, renewals program plans, blockage events, work orders to identify work planned and work executed and maintenance activity type/cost, failure causes on eight geographically dispersed business units.
We demonstrate the DRAT tool in this case, showing the results of the assessment in Table 4. This resulted in an assessment at the Unsafe Corporate Data level. The DRAT suggested controls are virtually identical to those imposed at the time of the research. In this case study, the primary risk had been due to the presence of town names in the original dataset; these were replaced with identification letters A–H very early in the project as there was no analytical disadvantage in doing so. Another source of risk had been cost data in the original dataset, however, as this was not used in the analysis, it was removed and permission was then provided to publish the results and share the dataset among other researchers at the university.
Case study demonstrating the DRAT process.

Abbreviations: DRAT, data risk assessment tool; RAF, rawest available form.
5 Testing
Testing involved an assessment of the risks and controls involved in a number of prior industry-funded collaborative projects, involving the release of data, undertaken by the authors in the last decade. The range of resulting risk rankings are shown in Table 5.. In all cases, the suggested controls were very similar to those that were agreed with the respective company partner through significant discussion and negotiation with the industry partner as the project progressed. In each case, there was already an established relationship (and trust) between the academic supervisor, industry collaborator and SME (roles shown in Figure 2) and each had a good knowledge of the data and subject matter. It is worth noting that the actual actions (shown below) were not decided a priori at the start of the project as they would be under the use of the DRAT tool. The aim of showing these projects is to say that the DRAT recommended actions broadly map onto actions taken in mature, consenting university industry collaborations. For obvious reasons, we are not permitted to talk about data and publication requests which have been denied by industry collaborators.
Application of the DRAT tool to prior research projects.
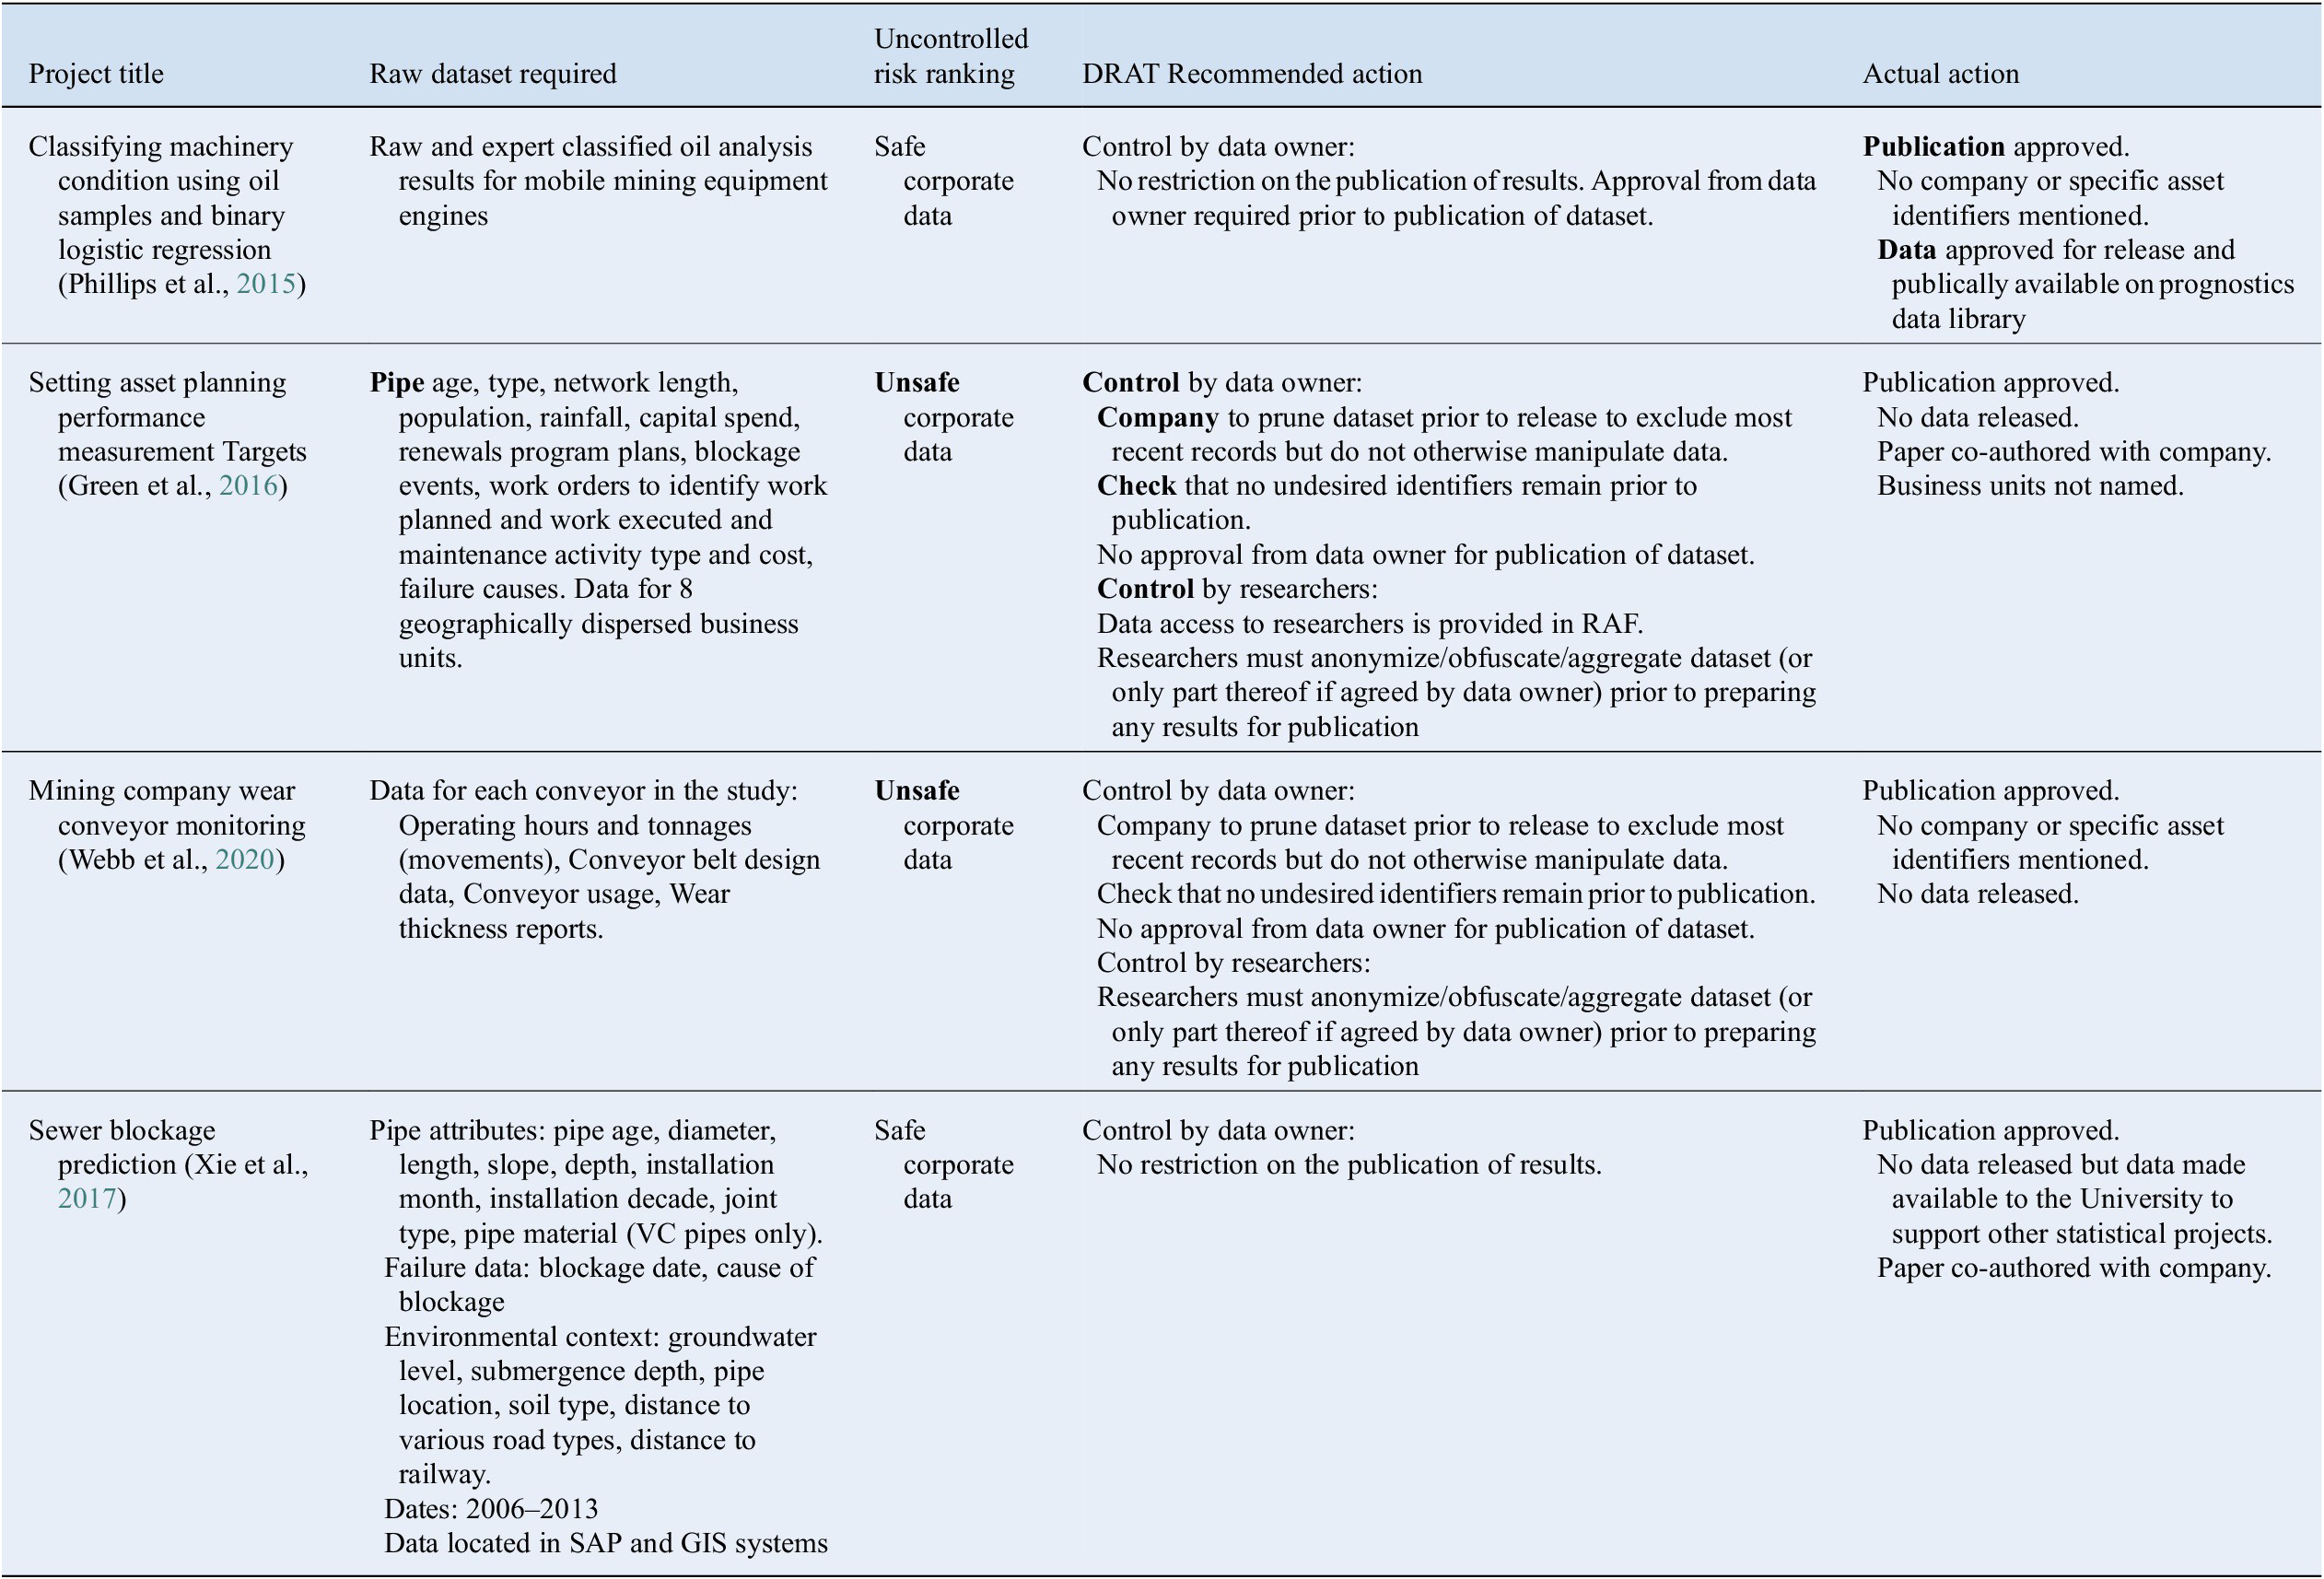
Abbreviation: DRAT, data risk assessment tool.
The second stage of testing involved introducing the DRAT tool to industry partners of the recently formed Australian Research Council Industrial Research Training Center (ITTC) for Transforming Maintenance Through Data Science. The industry partners are BHP, Alcoa and Roy Hill. BHP and Alcoa are global mining companies with revenue (2019) of USD 44.3 billion and USD 11.6, respectively. Roy Hill is owned by a consortia of private and publicly listed companies. The industry partners circulated the process within their organizations for comment, including to their legal departments. The tool is now in use within this ARC ITTC and is being used regularly to assess data sets for release to the research partners in the Center.
In practice, the DRAT tool has brought the following benefits to the industry and university partners in the ITTC.
• The web tool is easy and quick to use by industry employees without any training.
• Feedback from industry partners indicates that the DRAT process provides more consistent assessments and the summary information facilitates quicker approval by management.
• The datasets that have been are provided have not been significantly manipulated improving their value to researchers.
• The process facilitates transparent communication between all parties regarding the control measures that must be implemented to manage the risk appropriately.
Here is a quote from one of the partners involved:
“We have evaluated DRAT on data sets we had previously agreed to release and the risk mitigations suggested by the tool are coherent with our prior assessment. We suggest the tool has use wider applicability than just assessing data for use in university collaborations, such as for data released as part of contractual and consulting work as well.”
6 Conclusions
This paper describes a process, called DRAT, that enables industry partners to assess and control the risks associated with releasing EAM datasets to university research partners. Existing risk management processes used by the sector do not specifically cover the sharing of data with universities. The tool is designed to enable a manager without direct expertise in the details of the data or the EAM process or familiarity with the university collaborator to use a well-known and risk management framework (ISO 31000) and an organisationally approved decision tree to decide on the risk posed by the release of the data and suggest controls based on the Five Safes approach. This process is transparent and documented, relieving the manager of risks that he/she will have been seen to have made an ad-hoc decision which cannot subsequently be justified. The DRAT is enacted using a web-tool, that is, freely available. It is tested on a number of data sets used for university-industry research work and publications.
Acknowledgements
The authors would like to thank industry members and academic partners in the Australian Research Council Center for Transforming Maintenance through Data Science (Industrial Transformation Research Program Grant No.IC180100030) who commented on the model and paper. This work would also have not been possible without funding from the BHP Fellowship for Engineering for Remote Operations—supporting community projects in areas in which BHP operates.
Authorship Contributions
J.S.: Conceptualization (Lead), Data curation (Lead), Formal analysis (Equal), Funding acquisition (Lead), Investigation (Equal), Methodology (Lead), Software (Supporting), Validation (Supporting), Visualization (Lead), Writing-original draft (Lead); S.B.: Software (Lead), Visualization (Supporting), Writing-original draft (Supporting), Writing-review & editing (Equal); M.R.H.: Conceptualization (Lead), Formal analysis (Equal), Funding acquisition (Lead), Investigation (Equal), Methodology (Supporting), Project administration (Lead), Supervision (Lead), Validation (Lead). Writing-original draft (Supporting), Writing-review & editing (Equal); R.F.: Funding acquisition (Lead), Project administration (Lead), Supervision (Supporting). Writing-original draft (Supporting), Writing-review & editing (Equal).
Data Availability Statement
DRAT is licensed under a Creative Commons Attribution 4.0 International License and is available via www.drat-process.com.


 Open access
Comments
No Comments have been published for this article.