


Impact Statement
Countries must make significant changes to their infrastructure and energy systems to meet their obligations under the 2016 Paris Agreement, which requires a comprehensive, interdisciplinary approach. Digitalization forms an important part of the response to this challenge. Digital twins composed of distributed collaborative entities that share data and combine to answer complex questions have been identified as a key aspect of digitalization. In this work, we demonstrate how a comprehensive digital twin can be implemented as a dynamic knowledge graph using technologies from the Semantic Web. Preliminary evidence from case studies in Singapore is presented to demonstrate how such a concept might be used to support, for example, the planning of cities and the design of future energy systems.
1. Introduction
In the 2016 Paris Agreement, 196 nations committed to reduce their greenhouse gas emissions in a legally binding treaty on climate change. The obligations under the agreement are projected to require significant changes in infrastructure, ranging from a move to large-scale energy distribution (Tröndle et al., Reference Tröndle, Lilliestam, Marelli and Pfenninger2020; Brown and Botterud, Reference Brown and Botterud2021) to the adoption of distributed energy resources (Jain et al., Reference Jain, Qin and Rajagopal2017) and the development of intelligent infrastructure (Ziar et al., Reference Ziar, Manganiello, Isabella and Zeman2021).
The development of solutions to these challenges that are inherently interdisciplinary requires the consideration of economic, engineering, environmental, and social factors (Debnath and Mourshed, Reference Debnath and Mourshed2018; Levi et al., Reference Levi, Kurland, Carbajales-Dale, Weyant, Brandt and Benson2019; Spyrou et al., Reference Spyrou, Hobbs, Bazilian and Chattopadhyay2019) over a range of geographic scales (Yalew et al., Reference Yalew, van Vliet, Gernaat, Ludwig, Miara, Park, Byers, De Cian, Piontek, Iyer, Mouratiadou, Glynn, Hejazi, Dessens, Rochedo, Pietzcker, Schaeffer, Fujimori, Dasgupta, Mima, da Silva, Chaturvedi, Vautard and van Vuuren2020). It may also require the development of new concepts, for example to facilitate the consideration of societal practices and patterns of consumption in the analysis of different solutions (Shove, Reference Shove2021). These factors are strongly interconnected and it is widely appreciated that interoperable (Capellán-Pérez et al., Reference Capellán-Pérez, de Blas, Nieto, de Castro, Miguel, Carpintero, Mediavilla, Lobejón, Ferreras-Alonso, Rodrigo, Frechoso and Álvarez-Antelo2020), collaborative (DeCarolis et al., Reference DeCarolis, Jaramillo, Johnson, McCollum, Trutnevyte, Daniels, Akın-Olçum, Bergerson, Cho, Choi, Craig, de Queiroz, Eshraghi, Galik, Gutowski, Haapala, Hodge, Hoque, Jenkins, Jenn, Johansson, Kaufman, Kiviluoma, Lin, MacLean, Masanet, Masnadi, McMillan, Nock, Patankar, Patino-Echeverri, Schively, Siddiqui, Smith, Venkatesh, Wagner, Yeh and Zhou2020) models that span multiple disciplines (Jain et al., Reference Jain, Qin and Rajagopal2017) are necessary, perhaps in the form of digital twins supported by artificial intelligence (AI) (Inderwildi et al., Reference Inderwildi, Zhang, Wang and Kraft2020).
This has been recognized in the UK (National Infrastructure Commission, 2017), which in 2018 launched a National Digital Twin programme (Centre for Digital Built Britain, 2018). The vision of the programme is to lead the digital transformation of the construction and infrastructure sectors by creating a National Digital Twin that enables a data-centric approach to managing the built and natural environments. The National Digital Twin is not intended to be monolithic, but rather a system of interconnected entities that share data and that are able to combine to answer complex questions. For example, what infrastructure exists, and what is its capacity, location, and condition? What are the environmental, social, and economic impacts of proposed infrastructure projects?
The benefit of a data-centric approach, within which we include the availability of data from smart infrastructure and the sharing of data in a national-scale digital twin, lies in the use of data to support better decision making. In mature economies such as the UK, the value of existing infrastructure far exceeds the value of infrastructure that is under development, such that the key benefits will derive from optimizing the use of existing assets (Cambridge Centre for Smart Infrastructure and Construction [CISL], 2016). Examples from the UK include aviation and rail, where new capacity has been (or will be) created by optimizing the air traffic and rail control systems (Cambridge Centre for Smart Infrastructure and Construction [CISL], 2016).
In 2018, the Centre for Digital Built Britain (CDBB) published the Gemini Principles (Bolton et al., Reference Bolton, Butler, Dabson, Enzer, Evans, Fenemore, Harradence, Keaney, Kemp, Luck, Pawsey, Saville, Schooling, Sharp, Smith, Tennison, Whyte, Wilson and Makri2018) to establish a basis for the development of the National Digital Twin. The principles state that each element of the digital twin must have a clear purpose, must be trustworthy and must function effectively. They raise challenging questions about the ownership, curation, quality, and security of data, about the protection of intellectual property, and about the interoperabililty of data and models, but intentionally avoid prescribing solutions.
CDBB subsequently published a plan to develop an information management framework (IMF) for the National Digital Twin (Hetherington and West, Reference Hetherington and West2020). It was proposed that the IMF should include a Foundation Data Model to provide a consistent high-level ontology for the digital twin and for sharing and validating data, a Reference Data Library to provide a shared vocabulary for describing digital twins, and an Integration Architecture to support the design and connection of digital twins. It is implicit in the discussion that data should be stored using a distributed architecture as opposed to a centralized database, and that it must be easy to discover and query across multiple sources. The discussion further emphasizes the need to enable interactions between data and models from different organizations and sectors, including buildings, utilities, infrastructure and transport, as well as social and environmental models.
Despite the bold statement of intent by the National Digital Twin programme, it remains unclear how to implement such a digital twin. In order to achieve its full potential, it will be necessary, for example, to address the challenges to interoperability posed by the heterogeneity of data and services (software and tools), and the nonuniqueness (i.e., duplication and inconsistency) of data, all of which impede communication between domains.
Starting in 2013, researchers at CARES (2020a), the Cambridge Centre for Advanced Research and Education in Singapore, started work on the World Avatar project to investigate this type of problem. The idea behind the project is to connect data and computational agents to create a living digital “avatar” of the real world. The digital world is intended to be “living” in the sense that the computational agents will, amongst other things, incorporate real-time data such that the digital world remains up to date and that analyses based on the data remain self-consistent. The name “World Avatar” seeks to convey the possibility of representing every aspect of the real world, extending the idea of digital twins to consider the possibility of representing any abstract concept or process.
The initial focus of the research at CARES was the decarbonization of the chemical industry in Singapore. This resulted in the development of the J-Park Simulator (Eibeck et al., Reference Eibeck, Lim and Kraft2019; CARES, 2020d), which uses technologies from the Semantic Web (Berners-Lee et al., Reference Berners-Lee, Hendler and Lassila2001) to create a knowledge-graph-based digital twin of the eco-industrial park on Jurong Island (Pan et al., Reference Pan, Sikorski, Kastner, Akroyd, Mosbach, Lau and Kraft2015, Reference Pan, Sikorski, Akroyd, Mosbach, Lau and Kraft2016; Kleinelanghorst et al., Reference Kleinelanghorst, Zhou, Sikorski, Foo, Aditya, Mosbach, Karimi, Lau and Kraft2017; Zhou et al., Reference Zhou, Pan, Sikorski, Garud, Aditya, Kleinelanghorst, Karimi and Kraft2017). The scope of World Avatar project has since broadened considerably. It has demonstrated the use of ontologies to facilitate interoperability between models and data from different technical domains (Devanand et al., Reference Devanand, Karmakar, Krdzavac, Rigo-Mariani, Foo, Karimi and Kraft2020; Farazi et al., Reference Farazi, Salamanca, Mosbach, Akroyd, Eibeck, Aditya, Chadzynski, Pan, Zhou, Zhang, Lim and Kraft2020c), developed an agent discovery and composition service to allow agents to be combined to perform more complex tasks (Zhou et al., Reference Zhou, Eibeck, Lim, Krdzavac and Kraft2019), developed a blockchain-based smart contract system to enable an agent marketplace (Zhou et al., Reference Zhou, Lim and Kraft2020a), and demonstrated a parallel world framework for scenario analysis (Eibeck et al., Reference Eibeck, Chadzynski, Lim, Aditya, Ong, Devanand, Karmakar, Mosbach, Lau, Karimi, Foo and Kraft2020). It also now includes a Cities Knowledge Graph project with researchers at ETH Zurich to improve the planning and design of cities, and a Pharma Innovation Programme Singapore (PIPS) project to allow the World Avatar to control laboratory robots performing chemistry experiments.
The purpose of this paper is to demonstrate how Semantic Web technology can be used to implement a Universal Digital Twin as part of the World Avatar project. In particular, we aim to show that a dynamic general-purpose knowledge graph based on ontologies and autonomous agents that continually operate on it is ideally suited for the implementation of a digital twin at a national level.
The paper is structured as follows. Section 2 discusses the Semantic Web and the technologies that are available as part of it. Section 3 explains the World Avatar and presents examples that demonstrate its capability, and discusses current work to develop a knowledge-graph-based digital twin of the UK to support the decarbonization of the UK energy landscape. Conclusions are discussed in Section 5.
2. The Semantic Web Stack
The Semantic Web (Berners-Lee et al., Reference Berners-Lee, Hendler and Lassila2001) provides a valid description logic (Baader et al., Reference Baader, Calvanese, DL, Nardi and Patel-Schneider2007) representation of data on the World Wide Web. Resources on the Semantic Web are all instances of ontological classes. The resources are identified using internationalized resource identifiers (IRIs), ensuring an unambiguous representation. Technologies that enable the architecture, development and existence of the Semantic Web are vertically orchestrated based on functional dependency, forming the Semantic Web stack. The interested reader is referred to Allemang and Hendler (Reference Allemang and Hendler2011).
2.1. Ontologies
An ontology is a collection of classes, object properties and data properties expressing facts about and a semantic model of a domain of interest, for example, the built environment. An object property links an instance of a class (the domain of the property) to an instance of a class (the range of the property).Footnote 1 Object properties may be structured hierarchically. A data property links an instance of a class (the domain of the property) to a data element (the range of the property).Footnote 2 Similar to object properties, data properties may be structured hierarchically. A class acquires meaning via relationships to other classes.
An ontology is also known as a TBox (Terminological Component), where a class hierarchy is formed and associative relations are established through user-defined object properties, allowing cross-domain linking and modeling. Data properties allow the representation of different types of data. An ABox (Assertional Component) is an instantiation of a TBox representing entities, together with data and metadata about the entities. Inconsistencies can be determined at the level of data and relationships between the entities in an ABox via the assertion of data types, logical constraints, and cardinality (i.e., how many of something are allowed) in the TBox.
2.2. Linked data
Linked Data (Berners-Lee, Reference Berners-Lee2006; Bizer et al., Reference Bizer, Heath, Berners-Lee and Sheth2011) is Semantic Web data that is linked to other Semantic Web data to facilitate exploration and discovery (as opposed to semantic, but otherwise isolated data). Linked Data uses resource description framework (RDF) (Klyne and Carroll, Reference Klyne and Carroll2004) as the standard language to store data in the form of subject, predicate, and object triples. Related entities across datasets are connected via IRIs which are meant to be resolvable and provide meaningful information when looked up. Linked Data use ontologies to create and link entities and enrich the entities with data and metadata. Linked open data (LOD) refers to Linked Data that is published with an open license, such that it offers the possibility of finding and using related data, for example to resolve issues with naming and consistency.
2.3. Knowledge graphs
A knowledge graph is a network of data expressed as a directed graph, where the nodes of the graph are concepts or their instances (data items) and the edges of the graph are links between related concepts or instances. Knowledge graphs are often built using the principles of Linked Data. They provide a powerful means to host, query and traverse data, and to find and retrieve related information.
2.4. Data storage
Triple stores and quad stores provide solutions for the storage and management of RDF data. As the names suggest, triple stores use a 3-column (subject, predicate, and object) statement format, whereas quad stores use a 4-column (subject, predicate, object, and context) statement format. The context element can provide additional information about the data, for example a time coordinate, a reference or a name. When the context contains a name (which could be codified by an IRI) the statement is called a named graph. Many statements can belong to the same named graph, forming a subunit within the store and allowing the possibility of querying only the named graph. Most stores are able to accommodate both triples and quads and, for historic reasons, are often simply referred to as “triple stores.” A number of storage solutions exist, such as RDF4J (Eclipse Foundation, 2020) and Fuseki (Apache Software Foundation, 2020a) at the lab scale, and Blazegraph (2020) and Virtuoso (OpenLink Software, 2019) at the enterprise scale. In addition to triple stores, ontology-based data access (OBDA) enables ontological queries to be performed over relational and NoSQL databases (Botoeva et al., Reference Botoeva, Calvanese, Cogrel, Rezk, Xiao, Lenzerini and Peñaloza2016). Triple stores and OBDA provide endpoints, known as SPARQL endpoints, that are identified by IRIs and that can be used to query and update data. Authentication and authorization solutions to control security and access exist and are discussed elsewhere (Balfanz et al., Reference Balfanz, Czeski, Hodges, Jones, Jones, Kumar, Lindemann and Lundberg2019).
2.5. Queries and updates
SPARQL (Aranda et al., Reference Aranda, Corby, Das, Feigenbaum, Gearon, Glimm, Harris, Hawke, Herman, Humfrey, Michaelis, Ogbuji, Perry, Passant, Polleres, Prud’hommeaux, Seaborne and Williams2013) is a semantic-aware standard language to query and/or update data via a SPARQL endpoint, with or without activating an inference engine. Queries can be performed over named graphs, over an entire endpoint or (using a federated query) over multiple endpoints. Federated queries offer the possibility to retrieve data from and reason over multiple data sources at the same time, including the possibility of combining data from public and private data sources owned by any number of different parties. GeoSPARQL (OGC, 2012) is a standard defined by the Open Geospatial Consortium (OGC) as a domain-specific extension of SPARQL, allowing spatial reasoning and computations on data to reply to geospatial queries.
Each triple or quad store provides its own application programming interface (API) to support SPARQL query and update operations. However, each API is only compatible with its native store. Jena-JDBC (Apache Software Foundation, 2020b) provides a highly scalable store-agnostic API that can be used to query and update virtually any store.
2.6. Inference and rule engines
Inference engines (e.g., HermiT, Data and Knowledge Group, 2019) can operate on data expressed using RDF to reason about existing knowledge and infer new knowledge (Allemang and Hendler, Reference Allemang and Hendler2011), for example using the domain and range of object and data properties. Rule engines (e.g., Drools; Red Hat, Inc, 2020) can generate new knowledge through the codification and analysis of “if-then-else” conditions to calculate new values for data properties.
2.7. Examples
Google, Microsoft, IBM, Facebook, and eBay recently published a paper (Noy et al., Reference Noy, Gao, Jain, Narayanan, Patterson and Taylor2019) to explain how they use knowledge graphs. Google and Microsoft both use knowledge graphs to power their search engines. IBM uses one to support the IBM Watson question and answer engine. Facebook uses one to help understand what people care about. eBay is building one to connect what a seller is offering with what a buyer wants.
The article provides a number of insights and identifies opportunities and challenges, particularly relating to the scalability and query-response time of triple stores. Google built its knowledge graph using a set of low-level structures and associated reasoning mechanisms that are replicated at increasing levels of abstraction. This gives advantages in terms of scalability because new abstractions are built on tried and tested low-level units, and because it makes the design easier to understand. Facebook addresses the challenge of conflicting information by either dropping information if confidence in it was deemed to be too low, or by retaining the conflicting information and the associated provenance data. In this manner, their knowledge graph is able to explain why certain assertions are made, even if it cannot identify which assertion is objectively “correct.” IBM Watson uses polymorphic stores to offer the ability to support multiple indices, database structures, in-memory and graph stores. Data are split (often redundantly) into one or more of these stores, allowing each store to address specific requirements and workloads.
3. The World Avatar Dynamic Knowledge Graph
The World Avatar project aims to create a digital “avatar” of the real world. The digital world is composed of a dynamic knowledge graph that contains concepts and data that describe the world, and an ecosystem of autonomous computational agents that simulate the behavior of the world and that update the concepts and data so that the digital world remains current in time. In this manner, it is proposed that it is possible to create digital twins that are able to describe the behavior of complex systems, and by doing so provide the ability to make data-driven decisions about how to optimize the systems.
Within the World Avatar, there exists the notions of a “base world” that describes the current state of the real world, and “parallel worlds” that describe the effect of what-if changes to the base world. The base world enables the World Avatar to address control problems. The parallel worlds enable the World Avatar to perform scenario analysis to address design problems.
A central tenet of the World Avatar is the requirement to share data so that all the computational agents experience a self-consistent view of the world, and the requirement that data and computational agents must be interoperable across different technical and social domains. This interoperability, defined in the sense of the ability of tools and systems to understand and use the functionalities of other tools (Chen et al., Reference Chen, Doumeingts and Vernadat2008), is considered to be one of the key aspects of Industry 4.0 (Lu, Reference Lu2017) and will become increasingly important as the complexity and choice of tools inevitably increases. For example, considerations raised by recent reports concerning the possible role of hydrogen in the future UK energy landscape (Committee on Climate Change, 2018; Arup, 2019b; Hydrogen Taskforce, 2020a, 2020b) span the electrical power system, the gas grid, the potential of biomass, solar and wind energy, the transport system, heating of commercial and domestic buildings, in addition to considerations relating to the acceptance and adoption of new technologies by the public.
The following sections present an overview of the World Avatar and give examples of how it has been used to date. Section 3.1 describes the structure of the World Avatar. Section 3.2 discusses the computational agents that operate within the World Avatar. Section 3.4 presents example use cases. Section 4 describes the extension of the World Avatar toward a knowledge-graph-based digital twin of the UK. In order to keep the exposition concise, technical details about implementation are omitted here, but can be found in the references provided.
3.1. Structure
The World Avatar (Eibeck et al., Reference Eibeck, Lim and Kraft2019; CARES, 2020d) represents information in a dynamic knowledge graph using technologies from the Semantic Web stack. Unlike a traditional database, the World Avatar contains an ecosystem of autonomous computational agents that continuously update it.
The main components of the dynamic knowledge graph are illustrated in Figure 1. The dynamic knowledge graph contains concepts and instances that are linked to form a directed graph. The agents are described ontologically (Zhou et al., Reference Zhou, Eibeck, Lim, Krdzavac and Kraft2019) as part of the knowledge graph, and are able to perform actions on both concepts and instances. This confers versatility because it combines a design that enables agents to update and restructure the knowledge graph, with a structure that allows agents to discover and compose other agents simply by reading from and writing to the knowledge graph.
The main components of the World Avatar dynamic knowledge graph.
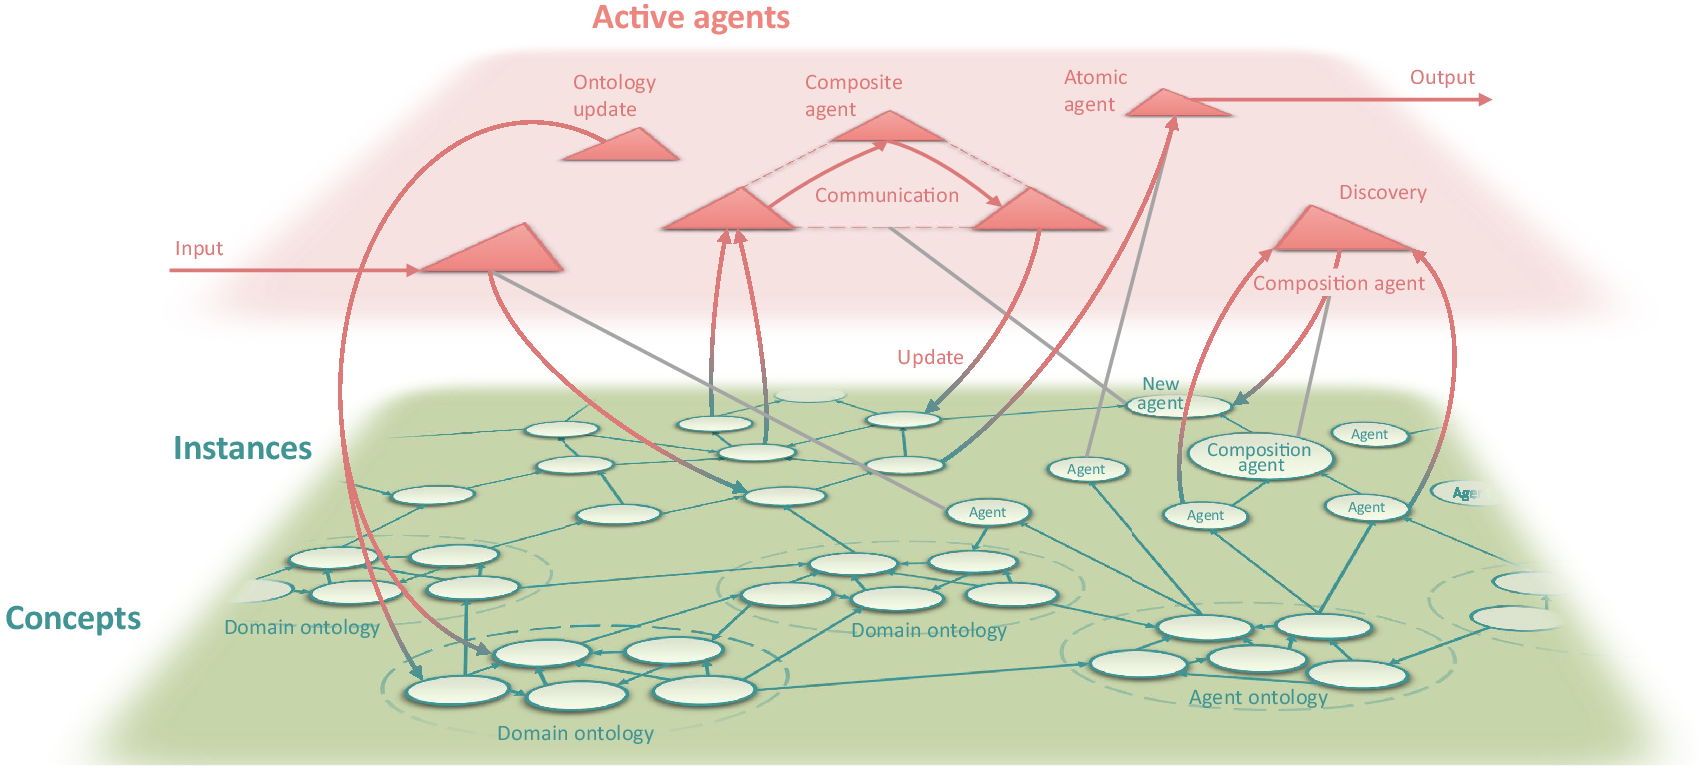
The links between the contents of the dynamic knowledge graph take the form of Internationalized Resource Identifiers (IRIs), which can be thought of as generalized web-addresses (Ishida, Reference Ishida2008). This ensures an unambiguous representation and enables the efficient traversal of the graph, both in the sense of traversing related content and in the sense of traversing whatever hardware is used to host the content.
3.2. Agents
At any given time, instances of the computational agents described in the knowledge graph may be activated to perform tasks. In this context, “agent” refers to software that uses Semantic Web technologies to operate on the knowledge graph to fulfill specific objectives. Agents may be atomic agents (i.e., not composed of other agents), or composite agents composed of multiple atomic agents operating in a coordinated way.
Agents can perform a variety of activities and can operate on both the concepts and instances in the knowledge graph (Eibeck et al., Reference Eibeck, Lim and Kraft2019):
-
• Input/output. Agents can update instances with data from the real world, for example, data from sensors or smart infrastructure. Agents can retrieve data from the knowledge graph and send signals back to real world, for example, to visualize data or to control an actuator.
-
• Update. Agents can query the knowledge graph, calculate derived quantities, and update instances with the new data. An example could be querying sources of emissions and the prevailing wind conditions to update estimates of air quality by simulating the dispersion of the emissions (Eibeck et al., Reference Eibeck, Lim and Kraft2019; Zhou et al., Reference Zhou, Eibeck, Lim, Krdzavac and Kraft2019).
-
• Restructure. Agents can restructure the knowledge graph by:
-
– Adding instances (i.e., items in ABoxes), for example, to explore the optimal placement of new infrastructure (Devanand et al., Reference Devanand, Kraft and Karimi2019; Eibeck et al., Reference Eibeck, Chadzynski, Lim, Aditya, Ong, Devanand, Karmakar, Mosbach, Lau, Karimi, Foo and Kraft2020).
-
– Adding concepts (i.e., items in TBoxes) to improve the description of data, for example, to add classes relating to dispatchable and nondispatchable resources to an ontology describing energy sources.
-
– Adding relationships between instances or between concepts, for example, using ontology matching to support the creation of relationships between equivalent concepts.
-
-
• Create new agents. Agents can provide services to facilitate agent discovery and to create composite agents to coordinate the activities of agents to perform complex tasks, for example, the estimation of air quality (Zhou et al., Reference Zhou, Eibeck, Lim, Krdzavac and Kraft2019). The possibility of introducing an agent marketplace and quality of service (QoS) measures for agents has been demonstrated using a blockchain-based smart contract system (Zhou et al., Reference Zhou, Lim and Kraft2020a).
The calculations performed by agents can take any form, including physics-based models with a theoretical structure, gray box models that combine some theoretical structure with data-driven components, and pure data-driven models. See Yu et al. (Reference Yu, Seslija, Brownbridge, Mosbach, Kraft, Parsi, Davis, Page and Bhave2020) for examples of these approaches in the context of emissions modeling. The availability of semantically structured machine-queryable data makes the World Avatar well-suited to be coupled to machine learning applications, where it is well-known that the time spent on data preparation and curation typically adds a significant cost to machine learning.
The potential of the World Avatar arises from the generic functionalities offered by agents that integrate ontologies and create new agents. Both would serve to raise the level of semantic interoperability and allow for the automation of processes to include new data and capabilities, and maintain interoperability as the quantity and complexity of the data and agents increases.
3.3. Ontological coverage
The current ontological coverage of the World Avatar includes 3D city data (OntoCityGML, Eibeck et al., Reference Eibeck, Lim and Kraft2019), weather (Weather Ontology, Institute of Computer Engineering at Technical University of Vienna, 2014), process engineering (OntoCAPE, Marquardt et al., Reference Marquardt, Morbach, Wiesner and Yang2010), eco-industrial parks (OntoEIP, Zhang et al., Reference Zhang, Romagnoli, Zhou and Kraft2017; Zhou et al., Reference Zhou, Pan, Sikorski, Garud, Aditya, Kleinelanghorst, Karimi and Kraft2017; Zhou et al., Reference Zhou, Zhang, Karimi and Kraft2018), and electrical power systems (OntoPowerSys, Devanand et al., Reference Devanand, Karmakar, Krdzavac, Rigo-Mariani, Foo, Karimi and Kraft2020). It includes ontologies for quantum chemistry (OntoCompChem, Krdzavac et al., Reference Krdzavac, Mosbach, Nurkowski, Buerger, Akroyd, Martin, Menon and Kraft2019), chemical species (OntoSpecies, Farazi et al., Reference Farazi, Krdzavac, Akroyd, Mosbach, Menon, Nurkowski and Kraft2020b), chemical kinetic reaction mechanisms (OntoKin, Farazi et al., Reference Farazi, Akroyd, Mosbach, Buerger, Nurkowski, Salamanca and Kraft2020a), and combustion experiments (OntoChemExp, Bai et al., Reference Bai, Geeson, Farazi, Mosbach, Akroyd, Bringley and Kraft2021). Selected subgraphs of the LOD Cloud (lod-cloud.net, 2020), in particular DBpedia (Lehmann et al., Reference Lehmann, Isele, Jakob, Jentzsch, Kontokostas, Mendes, Hellmann, Morsey, van Kleef, Auer and Bizer2015; DBpedia, 2020) are also connected to the knowledge graph.
3.4. Use cases
This section presents use cases that demonstrate different aspects of the World Avatar. The use cases are from the Cities Knowledge Graph, PIPS, and J-Park Simulator projects so are mainly associated with Singapore. However, the application of the World Avatar is not restricted to these contexts, as we shall discuss in Section 4.
3.4.1. Urban planning
The Cities Knowledge Graph project (CARES, 2020b) will integrate urban design and planning tools developed by the Future Cities Laboratory at the Singapore-ETH Centre with the World Avatar. The tools include the Collaborative Interactive Visualization and Analysis Laboratory design informatics platform (Future Cities Laboratory, 2020b), the Multi-Agent Transport Simulation Singapore model (Future Cities Laboratory, 2020c), the City Energy Analyst toolbox (Future Cities Laboratory, 2020a), and the ESRI CityEngine (Environmental Systems Research Institute, 2020) 3D modeling software. The concept is shown in Figure 2.
The Cities Knowledge Graph project will develop a pilot for a comprehensive knowledge management platform that provides interoperability between different types of city-relevant data to improve the precision of planning instruments and bridge the gap between planning use cases and knowledge domains. Reproduced from https://www.cares.cam.ac.uk/research/cities/ with permission.
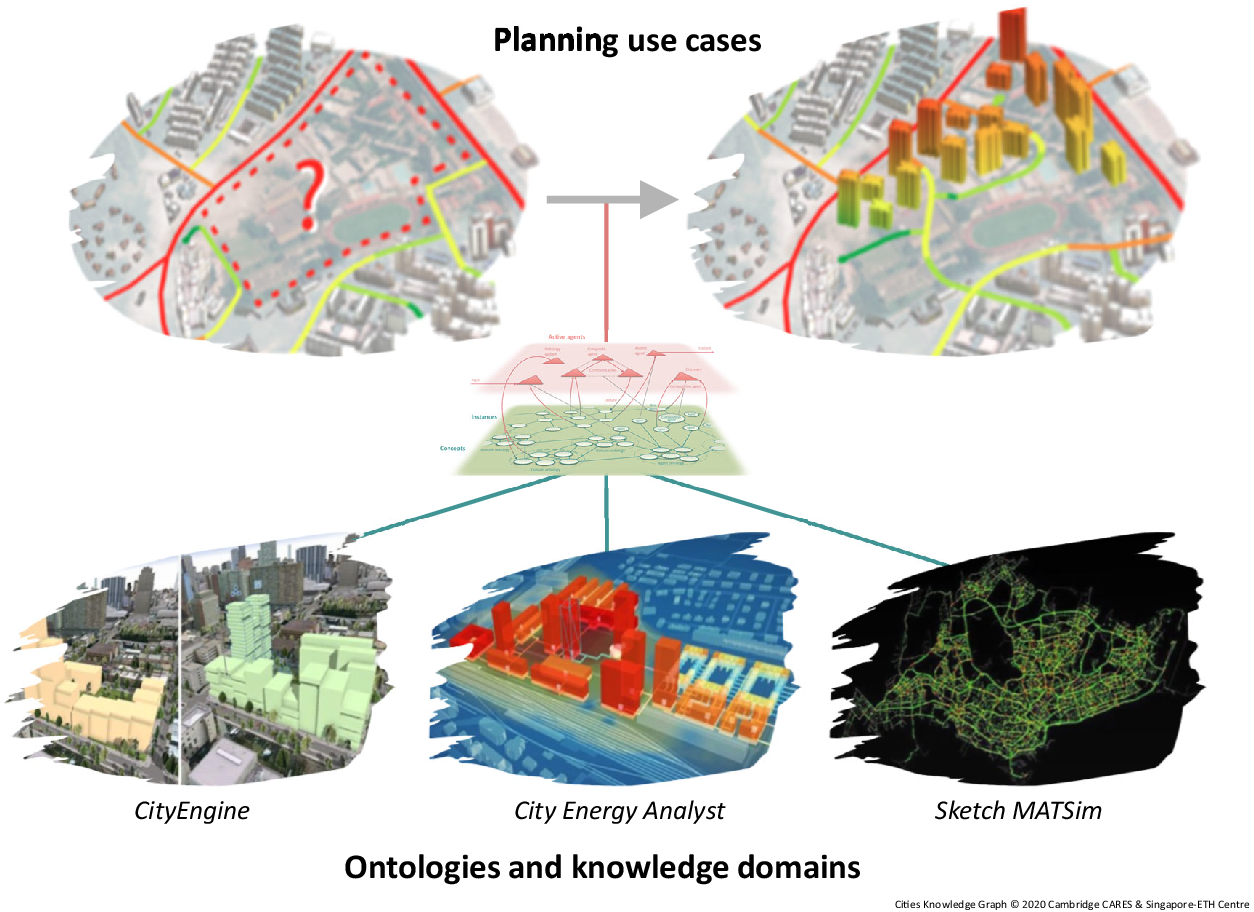
The resulting system will enable interoperability between building data, transport flows, underground infrastructure, humidity, and temperature data to improve the design and planning of cities by automating aspects of data processing, and by integrating concepts and targets from different planning arenas. Work to date has demonstrated the capability to incorporate live building management system (BMS) data into the dynamic knowledge graph (CARES, 2020e) and has integrated the World Avatar with OntoCityGML (Centre Universitaire d’Informatique at University of Geneva, 2012), an ontology that describes 3D models of cities and landscapes based on the CityGML 2.0 standard (Gröger et al., Reference Gröger, Kolbe, Nagel and Häfele2012). Tools have been developed to convert data from CityGML to OntoCityGML format. Work to find the best way to host this data within the dynamic knowledge graph is ongoing.
3.4.2. Intelligent querying and generation of data
The World Avatar contains chemical data, including kinetic reaction mechanisms (Farazi et al., Reference Farazi, Akroyd, Mosbach, Buerger, Nurkowski, Salamanca and Kraft2020a) and computational chemistry (Krdzavac et al., Reference Krdzavac, Mosbach, Nurkowski, Buerger, Akroyd, Martin, Menon and Kraft2019). It is able to use computational chemistry data to calculate thermodynamic quantities required by the reaction mechanisms, and link the resulting quantities to the computational chemistry calculations used to derive them (Farazi et al., Reference Farazi, Krdzavac, Akroyd, Mosbach, Menon, Nurkowski and Kraft2020b). It is able to identify inconsistencies in the data (Farazi et al., Reference Farazi, Salamanca, Mosbach, Akroyd, Eibeck, Aditya, Chadzynski, Pan, Zhou, Zhang, Lim and Kraft2020c) and interact with high performance computing (HPC) facilities in the real world to perform additional computational chemistry calculations to generate the data required to resolve the problems (Mosbach et al., Reference Mosbach, Menon, Farazi, Krdzavac, Zhou, Akroyd and Kraft2020). It includes experimental data (for combustion experiments) and is able to automate the process of calibrating reaction mechanisms versus experiment data (Bai et al., Reference Bai, Geeson, Farazi, Mosbach, Akroyd, Bringley and Kraft2021).
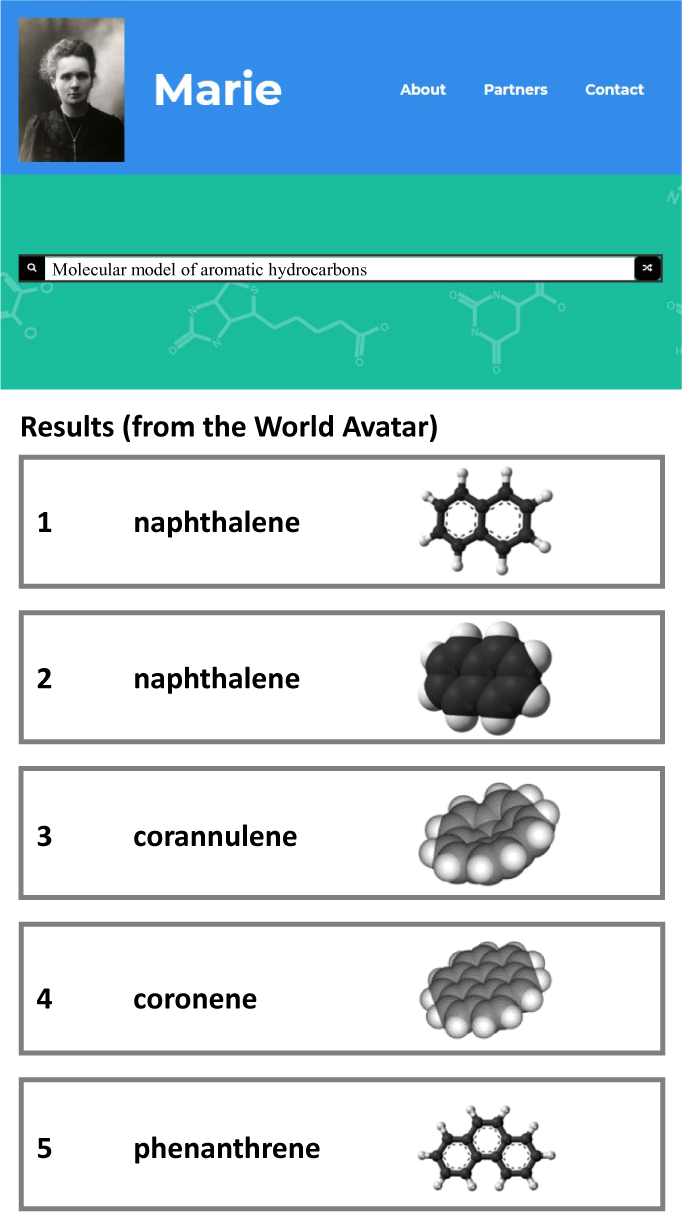
Research in collaboration with CMCL (CMCL Innovations, 2020a) has investigated the use of natural language processing (NLP) to develop an intelligent query interface for the chemistry data available via the World Avatar (Zhou et al., Reference Zhou, Nurkowski, Mosbach, Akroyd and Kraft2020b). Figure 3 shows a screenshot of a demonstration website (Computational Modelling Cambridge Ltd., 2020). It has been shown that the use of intent recognition and topic modeling, and the structure of the domain ontologies has a strong impact on the accuracy of the queries, with shallow ontologies performing better than deep ontologies. This poses a number of open challenges because scientific research typically leads to hierarchical classification systems that do not lend themselves to shallow ontologies.
Screenshot of Marie website (with enlarged text).
The availability of intelligent query interfaces has the potential to improve the discovery and interoperability of data. Work is ongoing to use such interfaces in conjunction with the World Avatar to develop quantitative structure activity/property relationships (QSAR/QSPR) that allow the prediction of the properties of a chemical from its structure, for example, its toxicity (Organisation for Economic Co-operation and Development, 2020) or its photovoltaic performance (Eibeck et al., Reference Eibeck, Nurkowski, Menon, Bai, Zhou, Mosbach, Akroyd and Kraft2021, and references therein). This is the focus of the PIPS (CARES, 2020c) project. PIPS will develop the capability of the World Avatar not only to automate calculations (Mosbach et al., Reference Mosbach, Menon, Farazi, Krdzavac, Zhou, Akroyd and Kraft2020), but to automate experiments by allowing agents to control a laboratory robot. This capability will close the loop between analysis and experiment to automate the generation of reaction and synthesis data, and establish an ontology framework for AI reasoning agents to generate chemical knowledge from data.
3.4.3. Cross-domain calculation of air quality
In recent years there has been increasing concern over the effect of emissions from combustion on air quality (Department for Environment Food and Rural Affairs [United Kingdom], 2019; National Climate Change Secretariat [Singapore], 2020), in particular, the emission of NO x (Department of Transport [United Kingdom], 2016, 2019; Air Quality Expert Group, 2017; Environmental Protection Agency [United States], 2020) and particulate matter (PM) (Environmental Committee, London Assembly, 2015), and the effect of black carbon (BC) emissions on the climate (Bond et al., Reference Bond, Doherty, Fahey, Forster, Berntsen, DeAngelo, Flanner, Ghan, Kärcher, Koch, Kinne, Kondo, Quinn, Sarofim, Schultz, Schulz, Venkataraman, Zhang, Zhang, Bellouin, Guttikunda, Hopke, Jacobson, Kaiser, Klimont, Lohmann, Schwarz, Shindell, Storelvmo, Warren and Zender2013).
Combustion accounts for approximately 99% of Singapore’s CO2 emissions (National Environment Agency, 2018, pp. 134–137). In addition to being one of the most densely populated countries (The World Bank Group, 2018), it hosts one of the world’s busiest ports with arrivals exceeding 138,000 vesselsFootnote 3 and a throughput of more than 37 million twenty-foot equivalent units in 2019 (Maritime and Port Authority of Singapore, 2020). There naturally arises the question of how emissions from hard-to-abate sectors like shipping influence factors such as air quality in different regions of Singapore. The interoperability of the World Avatar provides a method to answer these questions. Figure 4 illustrates how this was achieved. See references (Eibeck et al., Reference Eibeck, Lim and Kraft2019; Farazi et al., Reference Farazi, Salamanca, Mosbach, Akroyd, Eibeck, Aditya, Chadzynski, Pan, Zhou, Zhang, Lim and Kraft2020c) for more details of the implementation and results.
Real-time cross-domain estimation of the contribution of emissions from shipping to air quality in Singapore. Agents operating on the World Avatar update the knowledge graph with real-time information about the weather and about ships in the vicinity of Singapore. An emissions agent is able to use the information about the ships to estimate the emissions of unburned hydrocarbons, CO, NO2, NO x , O3, SO2, PM2.5, and PM10 from each ship. An atmospheric dispersion agent is able to use the information about the weather, the emissions from each ship and the built environment in Singapore to simulate the dispersion of the emissions. Virtual sensor agents report the resulting air quality estimates at different locations. Adapted from Farazi et al. (Reference Farazi, Salamanca, Mosbach, Akroyd, Eibeck, Aditya, Chadzynski, Pan, Zhou, Zhang, Lim and Kraft2020c).
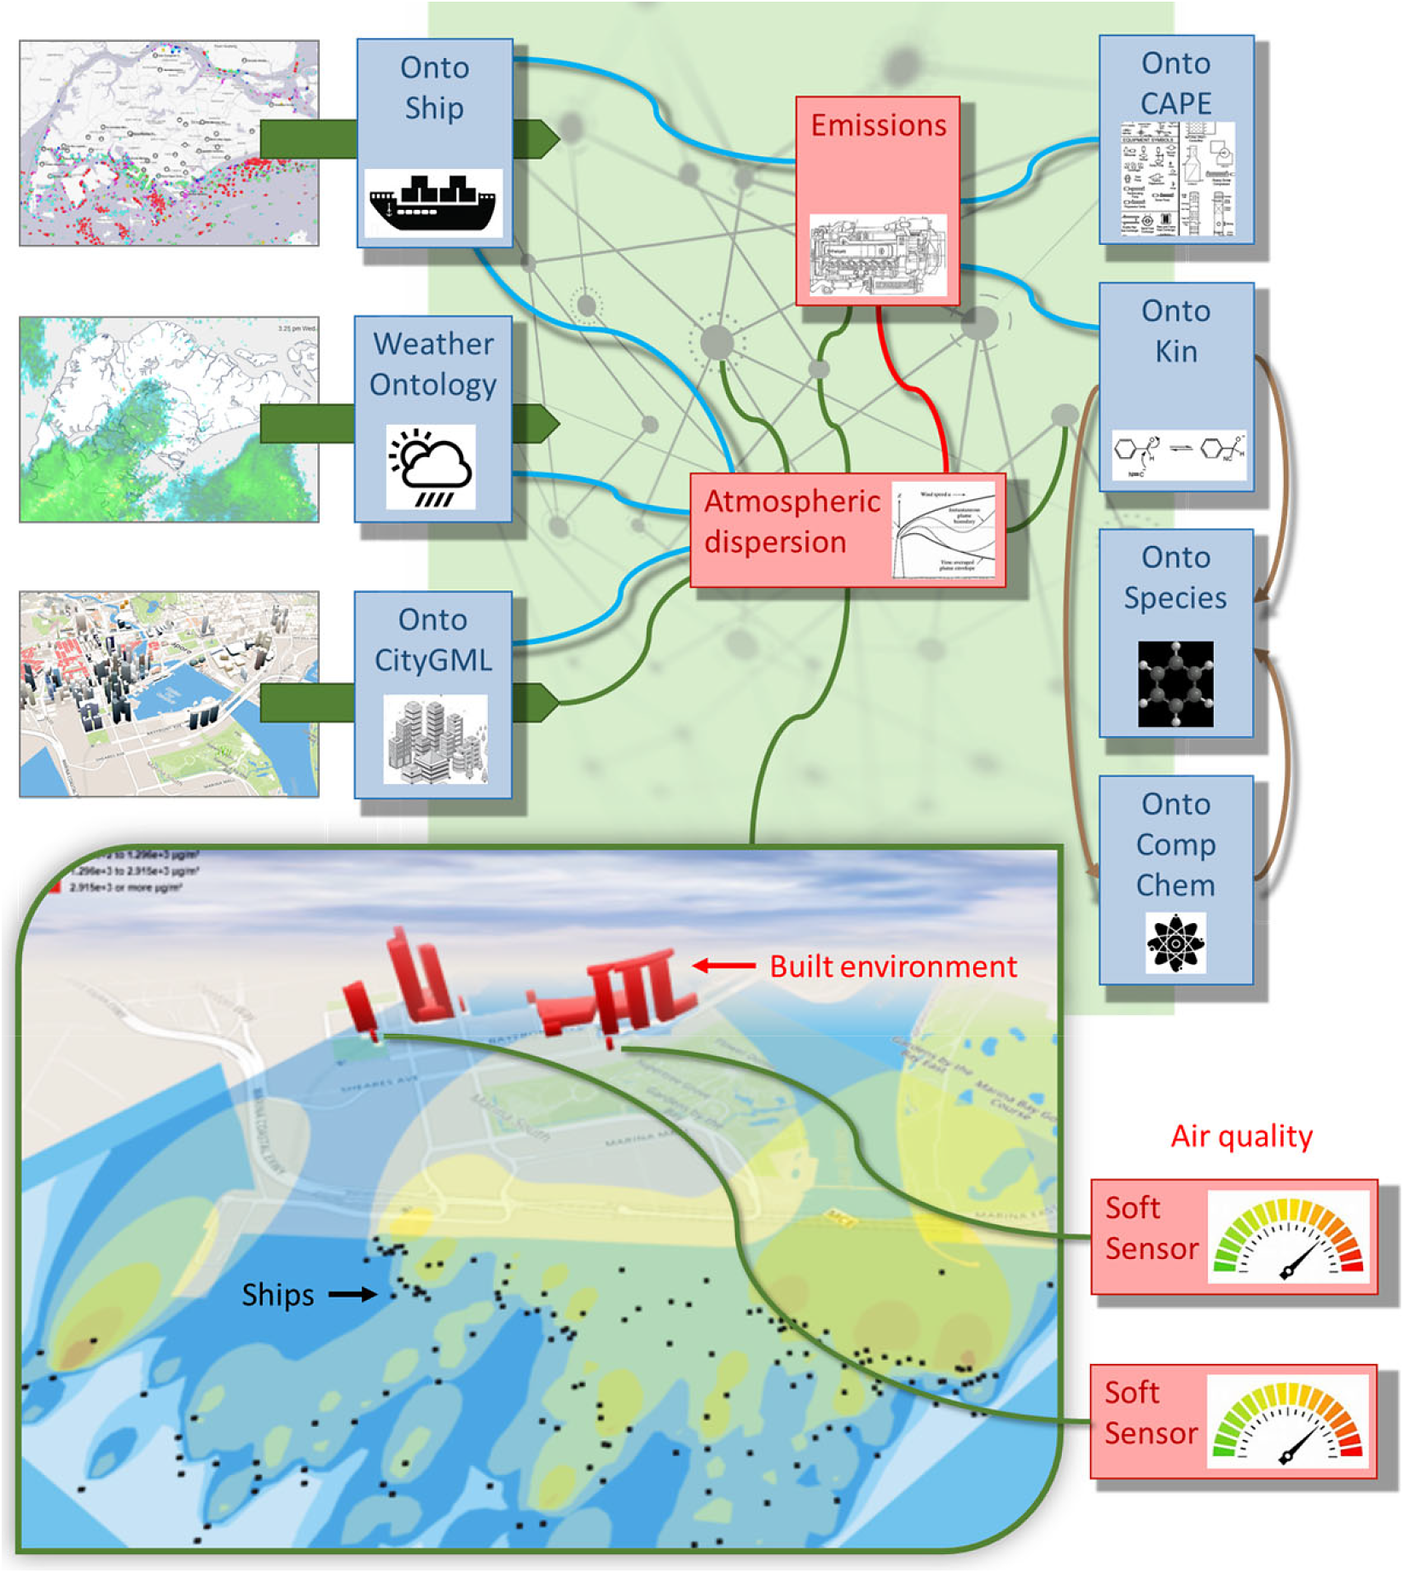
The choice of which agents to use in the calculation illustrated in Figure 4 is controlled by a composition agent (Zhou et al., Reference Zhou, Eibeck, Lim, Krdzavac and Kraft2019). The emissions can be calculated either by agents that use surrogate models developed using the SRM Engine Suite (CMCL Innovations, 2020c) and Model Development Suite (CMCL Innovations, 2020b), or by agents that directly use the SRM Engine Suite. The atmospheric dispersion can be simulated either by agents that use the Atmospheric Dispersion Modeling System (ADMS) (Cambridge Environmental Research Consultants, 2020) or by agents that use the EPISODE 3D CFD code (Karl et al., Reference Karl, Walker, Solberg and Ramacher2019). The agents wrap around existing software, including commercial software, with the possibility of an agent marketplace (Zhou et al., Reference Zhou, Lim and Kraft2020a) offering an alternative to traditional licensing models.
Whilst the emissions from ships can be described using data-driven models, trained using measurement data, for example, this would preclude the ability to assess the impact of different fuels. The chemical data (species properties, reactions, and reaction rates) that are required to assess the impact of different fuels can be described in the knowledge graph and any unknown quantities can, in principle, be calculated (although the calculation of reaction rates remains challenging). The ability of the World Avatar to enable interoperability between the different components of such calculations has been demonstrated in terms of calculating thermodynamic data for chemical species from computational chemistry data (Mosbach et al., Reference Mosbach, Menon, Farazi, Krdzavac, Zhou, Akroyd and Kraft2020), linking the resulting species data with reaction mechanisms (Farazi et al., Reference Farazi, Krdzavac, Akroyd, Mosbach, Menon, Nurkowski and Kraft2020b), and performing parameter estimation to improve the agreement with experimental data (Bai et al., Reference Bai, Geeson, Farazi, Mosbach, Akroyd, Bringley and Kraft2021). This is depicted on the right-hand side of Figure 4.
This use case illustrates how the World Avatar may be used to calculate the consequences of current activities in the base world. It demonstrates what can be achieved in terms of interoperability, both between models and data from different domains (weather, the built environment, ships, chemistry, emissions, and atmospheric dispersion) and covering different length scales (from the atomic length scales of the computational chemistry calculations to the kilometer length scales of the atmospheric dispersion simulations). Of course, this is unnecessarily elaborate if we are only interested in Singapore. The point, however, is that the World Avatar allows such calculations to be performed for any location.
3.4.4. Parallel worlds for scenario analysis
The parallel worlds capability of the World Avatar supports decision making in a complex environment by allowing the exploration of different scenarios and their associated outcomes. The parallel worlds exploit the structure of the dynamic knowledge graph to use scenario agents to group new instances of any entities that are modified in a scenario and store them in a scenario-specific part of the knowledge graph. Access, queries and updates to the scenario-specific instances are mediated via a scenario agent. The scenario-specific information in the parallel world can be thought of as overlaying the base world, so unchanged entities remain connected to the base world and any changes to the base world are reflected in the scenario. Conversely, any changes in the parallel world remain isolated within the scenario-specific part of the knowledge graph and so do not interfere with the base world. Based on an idea very similar to version-control systems that are widely used among software developers, parallel world containers store the differences to the base world in named graphs where the scenario provides the context. Technical details can be found in Eibeck et al. (Reference Eibeck, Chadzynski, Lim, Aditya, Ong, Devanand, Karmakar, Mosbach, Lau, Karimi, Foo and Kraft2020).
Figure 5 illustrates the parallel world concept. In this example, the parallel world is used to explore the effect of levying a carbon tax on the emissions from power generation processes to motivate a transition from fossil fuels to clean energy technologies. The following questions are addressed:
-
• What value of carbon tax is required to make the transition to small modular nuclear reactors (SMRs) profitable for a given set of conditions (e.g., project life span, depreciation rate, electrical load profiles, and generator characteristics)?
-
• Which plant(s) should be replaced and where should the new SMR(s) be located?
Parallel world concept for what-if scenario analysis. The panels at the top illustrate the electrical network from the real world (left) and an optimized network that is subject to a carbon tax (right). The network from the real world is described in the base world. The modifications to the network in the parallel world are described in a scenario-specific part of the knowledge graph. The pink triangles denote natural gas generators that are present in both the base world and the parallel world. The blue square denotes an oil generator that is only present in the base world. The radiation symbol denotes a small modular nuclear reactor that is only present in the parallel world. Adapted from Eibeck et al. (Reference Eibeck, Chadzynski, Lim, Aditya, Ong, Devanand, Karmakar, Mosbach, Lau, Karimi, Foo and Kraft2020).
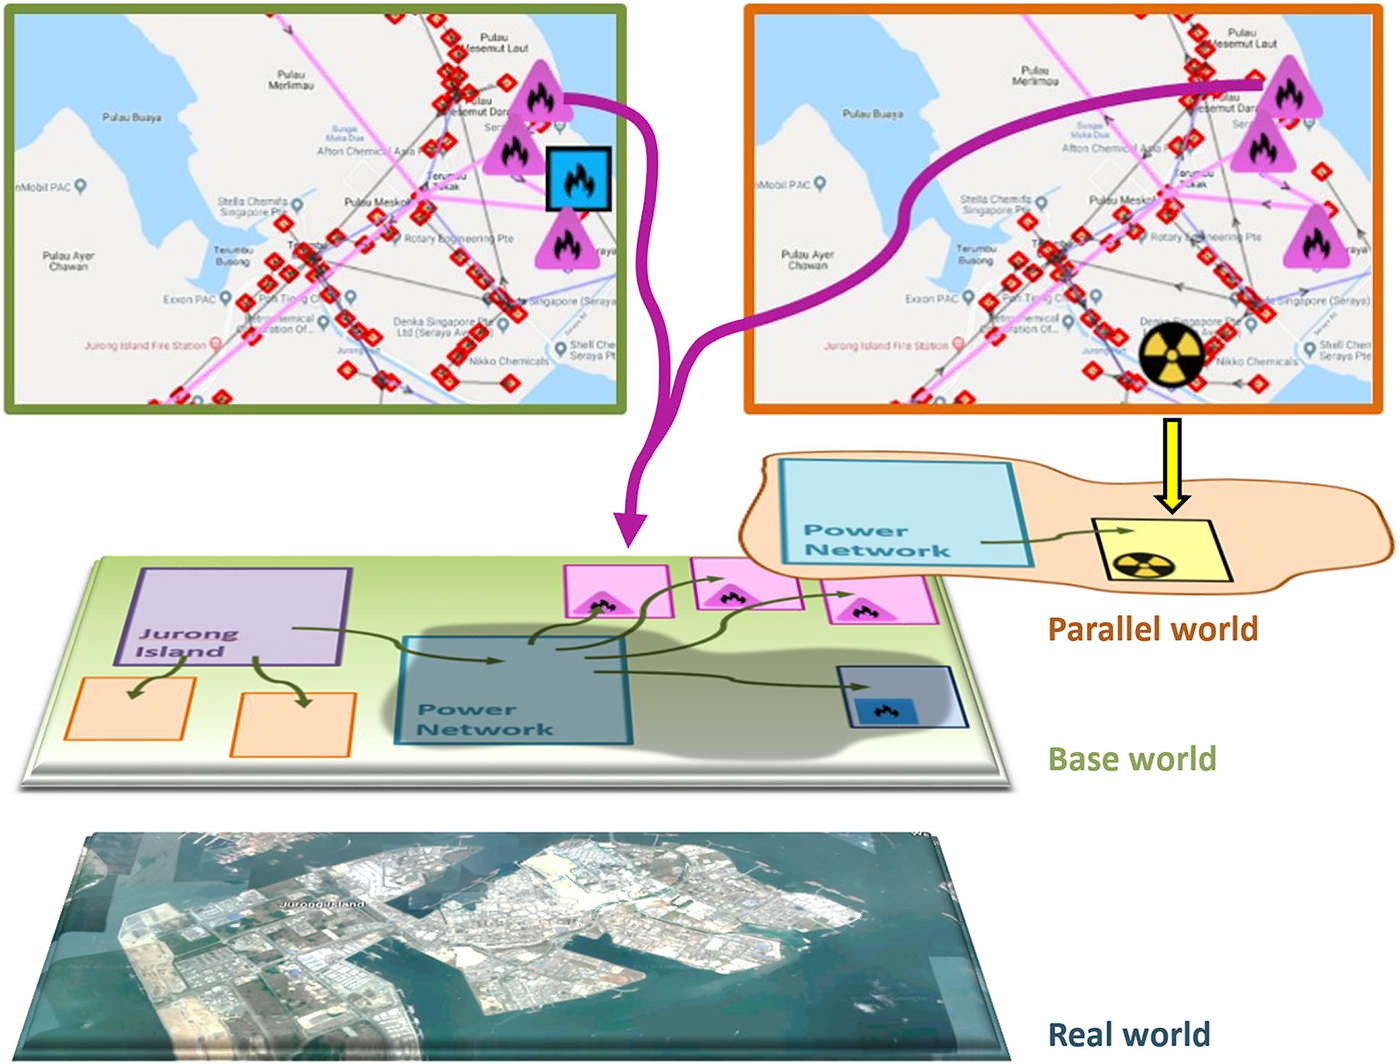
The parallel world shows that oil generators are replaced with SMRs as the carbon tax is increased from S$5 to S$170 per tonne. The types of generator present and the corresponding estimates of the CO2 emissions are automatically updated in the parallel world to reflect these changes, and an optimal power flow (OPF) agent is invoked to minimize the overall operating cost of the scenario in the parallel world. See references (Devanand et al., Reference Devanand, Kraft and Karimi2019; Eibeck et al., Reference Eibeck, Chadzynski, Lim, Aditya, Ong, Devanand, Karmakar, Mosbach, Lau, Karimi, Foo and Kraft2020) for more details of the implementation and results.
This use case illustrates how digital twinning and what-if scenario analysis using a dynamic knowledge graph can support decision makers to understand the effect of different design choices and policy instruments. In this example, the problem addressed by the parallel world is simple enough to be formulated as a classical optimization problem with a well-defined objective function. However, many scenarios will be too complex for this to be the case. How to address this is discussed in the context of the knowledge-graph-based digital twin of the UK in Section 4.
4. The Knowledge-Graph-Based Digital Twin of the UK
The knowledge-graph-based digital twin of the UK is an effort within the World Avatar project to create a semantic digital twin of the UK. The aim is to provide a comprehensive live distributed platform to support the optimal use, planning and development of infrastructure in the UK and to support scenario analysis to help the UK achieve its development goals, for example, by supporting the decarbonization of the energy landscape.
By construction, the design of the World Avatar ensures that all data are connected and have an unambiguous representation, and are discoverable and queryable through a uniform interface. The use of ontologies promotes portability, making it easy to reuse data and results and support interoperability. It is inherently multidomain and can be extended by adding new ontologies and defining equivalence, or other relationships as appropriate, between semantically related terms to maintain, and even improve, interoperability as it grows. It is designed to allow the data to evolve over time, with the agents ensuring that it remains up to date. The architecture is distributed, offering the possibility of hosting different types of data in different places and providing links to the requisite provenance and license information. This includes the option for data owners to retain control over the hosting of their data and to control access as required by the nature of the data, ranging from heavily restricted access for sensitive data to open access for open data.
Furthermore, the ontological structure of the World Avatar is designed in a naturally hierarchical and extensible way (Zhou et al., Reference Zhou, Pan, Sikorski, Garud, Aditya, Kleinelanghorst, Karimi and Kraft2017) that allows representations at any length scale or level of detail or granularity, ranging, for example, from household appliances in residential buildings, or unit operations in industrial plants, to national infrastructure and beyond.
The interconnectedness of all represented concepts and instances that is inherent to knowledge graphs, combined with the constant activity of agents that are dynamically updating the knowledge graph, including with live data feeds, naturally enables interaction of digital twins at all scales with each other in the virtual world and with the real-world entities they are representing. These properties render a dynamic knowledge-graph approach particularly suitable for implementing a national-scale digital twin, and fully consistent with the principles laid out by Bolton et al. (Reference Bolton, Butler, Dabson, Enzer, Evans, Fenemore, Harradence, Keaney, Kemp, Luck, Pawsey, Saville, Schooling, Sharp, Smith, Tennison, Whyte, Wilson and Makri2018) and Arup (2019a).
The following sections describe progress toward the creation of the base world in a knowledge-graph-based digital twin of the UK, and discuss a route to meet the challenges posed by goal alignment in the context of parallel worlds.
4.1. Base world
This section describes the progress to date and the immediate next steps for the creation of the base world in a knowledge-graph-based digital twin of the UK. The immediate motivation for doing this is to help address questions relating to how best to help the UK achieve net zero carbon emissions. The energy sector is the largest contributor to emissions in the UK and was responsible for 82% of total emissions in 2018 (Brown et al., Reference Brown, Cardenas, Choudrie, Jones, Karagianni, MacCarthy, Passant, Richmond, Smith, Thistlethwaite, Thomson, Turtle, Bradley, Broomfield, Buys, Clilverd, Gibbs, Gilhespy, Glendining, Gluckman, Henshall, Hobson, Lambert, Malcolm, Manning, Matthews, May, Milne, Misra, Misselbrook, Murrells, Pang, Pearson, Raoult, Richardson, Stewart, Walker, Watterson, Webb and Zhang2020, p. 40). Work to date has therefore focused on data relating to the electric power system, the gas grid, the potential for photovoltaic and wind power, biomass and the built environment, all of which are critical to the future of the energy landscape (Committee on Climate Change, 2018). Beyond carbon emission reduction, potential applications are of course numerous and include, but are not limited to, public health, urban and infrastructure planning, and achieving a circular economy.
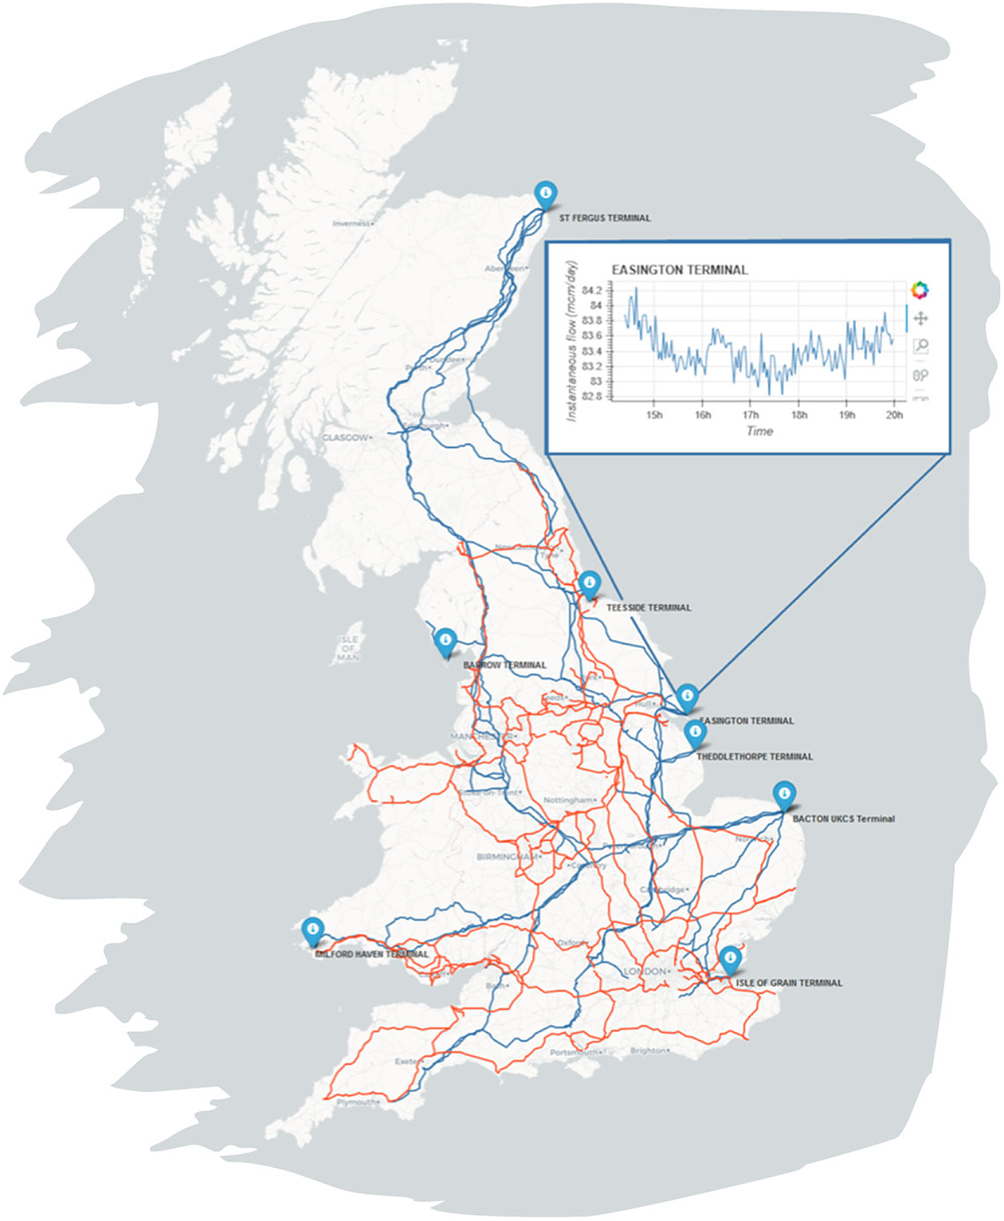
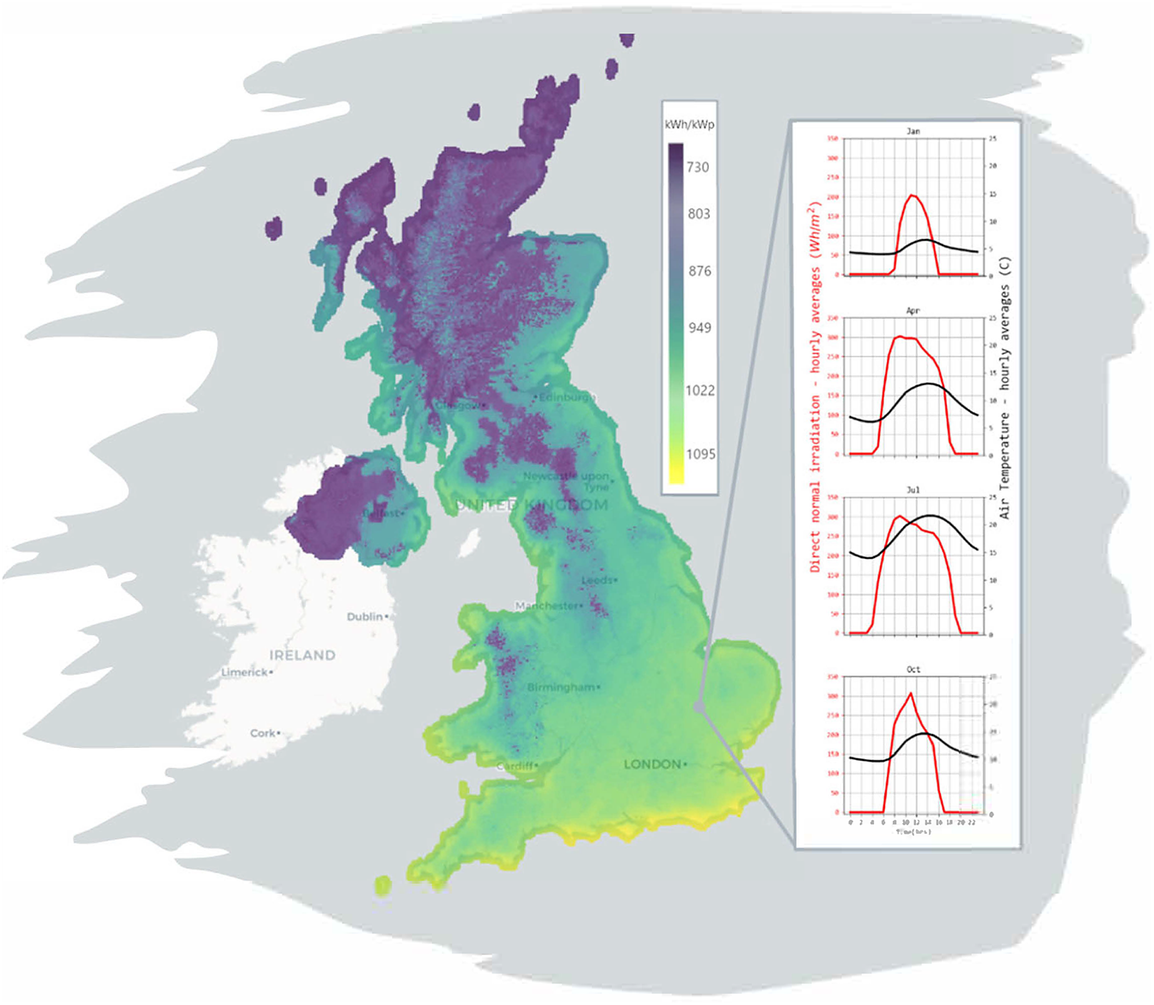
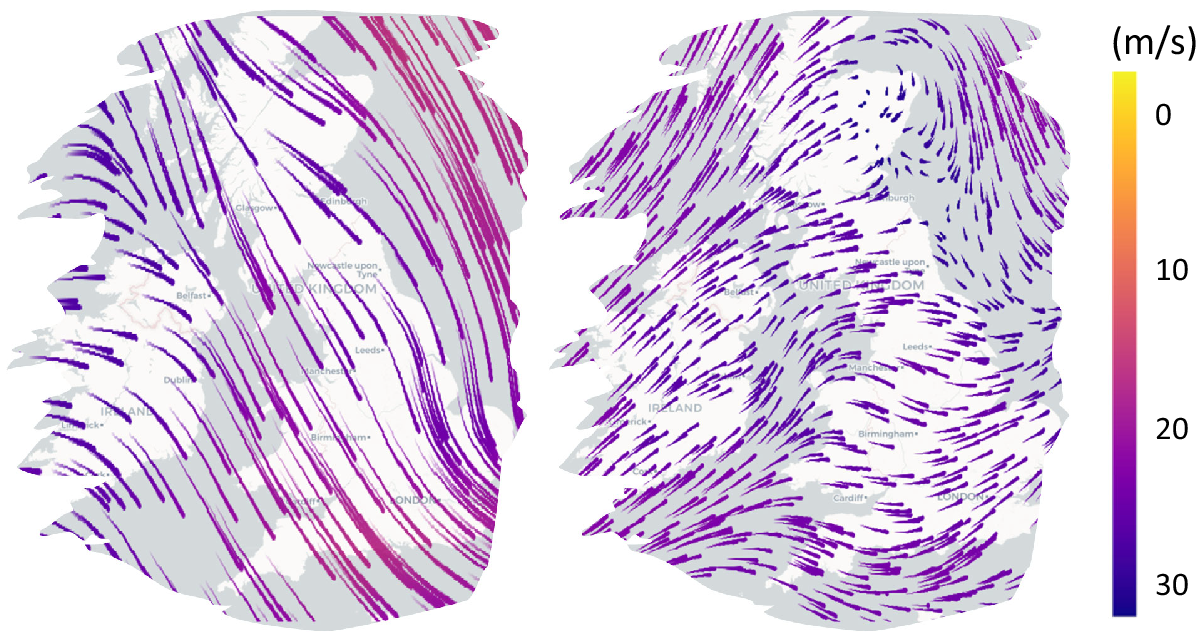
Figure 6 shows the geospatial configuration of the National Grid Electricity Transmission and National Grid Gas Transmission systems (National Grid, 2020a, 2020b). Work to extend the ontological coverage of the World Avatar to include this data is ongoing. In addition to the configuration of the networks, data for all the regional generators over 30 MW in the UK (Department for Business, Energy, and Industrial Strategy, 2020) have been added to the World Avatar and used in a preliminary analysis of how a carbon tax on existing generation infrastructure would effect the composition of power generation (Atherton et al., Reference Atherton, Xie, Aditya, Zhou, Karmakar, Akroyd, Mosbach, Lim and Kraft2020). It was shown that the carbon tax motivated a transition from coal to combined cycle gas turbines (CCGT), with nuclear and renewable sources being fully utilized. When regional capacities, demands and (found to be complementary) transmission losses were considered, this transition was found to occur first in London and the South East, where northern coal imports were displaced by local CCGT generation. Figures 7 and 8 show the photovoltaic power potential and wind speed and direction data in the UK. The photovoltaic data are published by SolarGIS (2020) on behalf of the World Bank as part of the Global Solar Atlas (2020). The wind data are part of the ERA5 data set published by the EU Climate Data Service (Hersbach et al., Reference Hersbach, Bell, Berrisford, Biavati, Horányi, Muñoz Sabater, Nicolas, Peubey, Radu, Rozum, Schepers, Simmons, Soci, Dee and Thépaut2018). Work to extend the ontological coverage of the World Avatar to include this type of data is an immediate priority.
Geospatial configuration of the National Grid Electricity Transmission (red) and National Grid Gas Transmission (blue) systems. The markers (blue) show the locations of the intake terminals for the National Grid Gas Transmission system. The inset shows real-time data for the gas flow into the network from the Easington North Sea gas terminal. Data obtained from the National Grid (2020a, 2020b).
Map showing the average annual photovoltaic power potential in the UK from 1994 to 2018. The inset shows the seasonal variation in the average daily photovoltaic potential and temperature in the vicinity of Cambridge, UK. Contains data licensed by The World Bank under the Creative Commons Attribution license (CC BY 4.0) with the mandatory and binding addition presented in Global Solar Atlas terms (https://globalsolaratlas.info/support/terms-of-use).
Map showing wind data for the UK at selected points in time. The data show the horizontal component of the velocity 100 m above sea level. Left: November 19, 2020 12:00. Right: February 1, 2020 15:00.Contains modified Copernicus Climate Change Service information [2020]. The data are available under an open license from Copernicus Products.
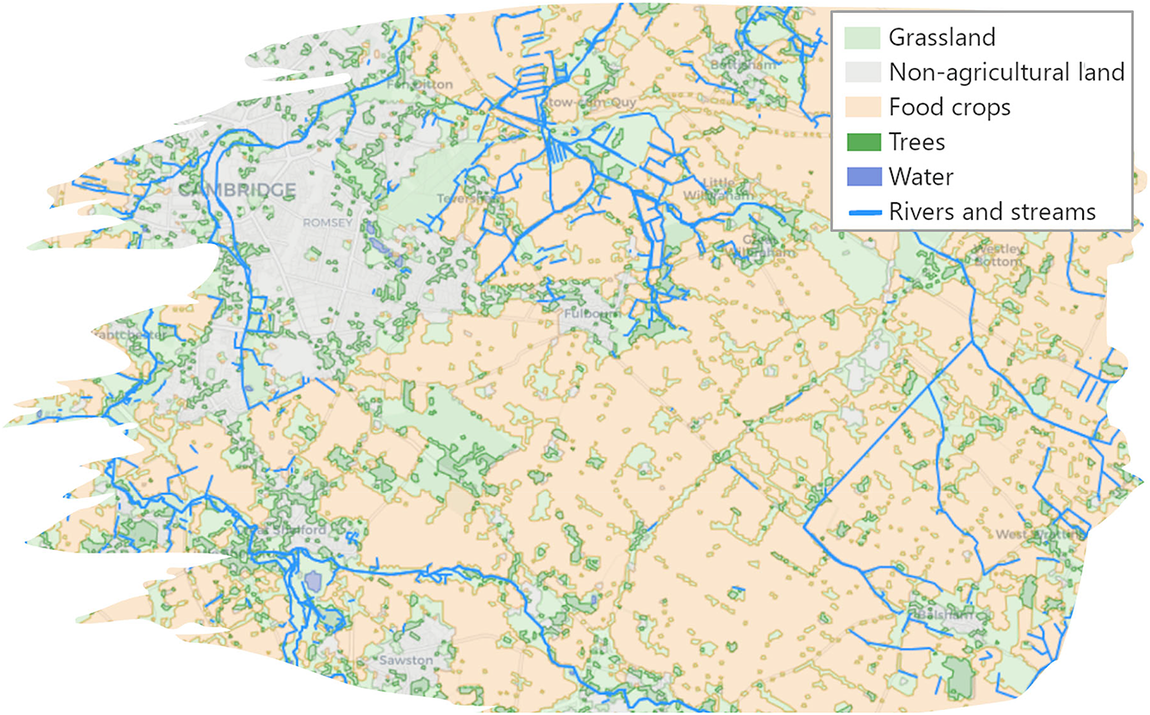
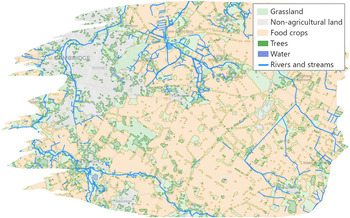
Figures 9 and 10 show an example of land use data in the vicinity of Cambridge, UK and data about the built environment in the vicinity of the Department of Chemical Engineering and Biotechnology at the University of Cambridge. The land use data are available via the Crop Map of England (Rural Payments Agency, 2019), which provides geospatial data about the types of biomass grown throughout the whole of England. The data about the rivers and streams in Figure 9 are available using the ordnance survey (OS) Features API (Ordnance Survey, 2020a). The base map and building data in Figure 10 are available using the OS Vector Tile API (Ordnance Survey, 2020c). Every building with a postal address in the UK has an associated Unique Property Reference Number (UPRN), likewise every road has a Unique Street Reference Number (USRN). These identifiers and items linked to them are available using the OS Linked Identifiers API (Ordnance Survey, 2020b). Work to extend the World Avatar to include the biomass data is ongoing. Work to include information about the built environment using OntoCityGML (Centre Universitaire d’Informatique at University of Geneva, 2012) is underway as part of the Cities Knowledge Graph project (see Section 3.4.1).
Land use in the vicinity of Cambridge, UK. Contains data from the Crop Map of England (CROME) 2019 (Rural Payments Agency, 2019) licensed under an Open Government License.
Ordnance Survey building data in the vicinity of the Department of Chemical Engineering and Biotechnology (UPRN:10090969505) and the Centre for Digital Built Britain (UPRN:10090627569) in Cambridge, UK. Contains public sector information licensed under the Open Government License v3.0.
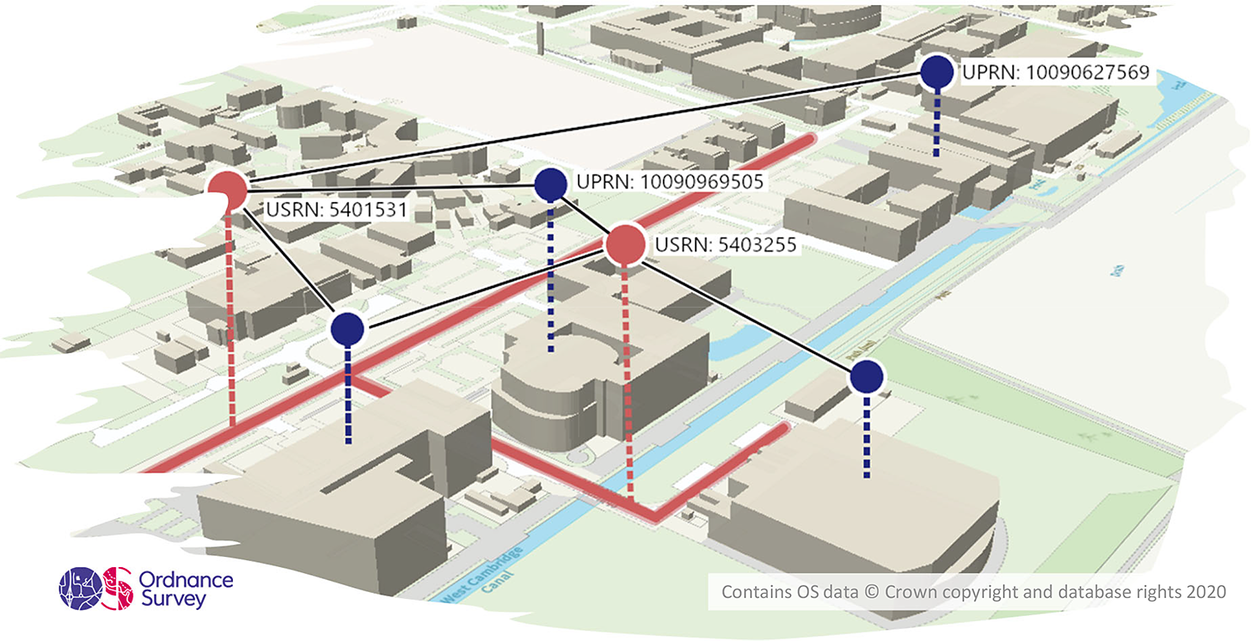
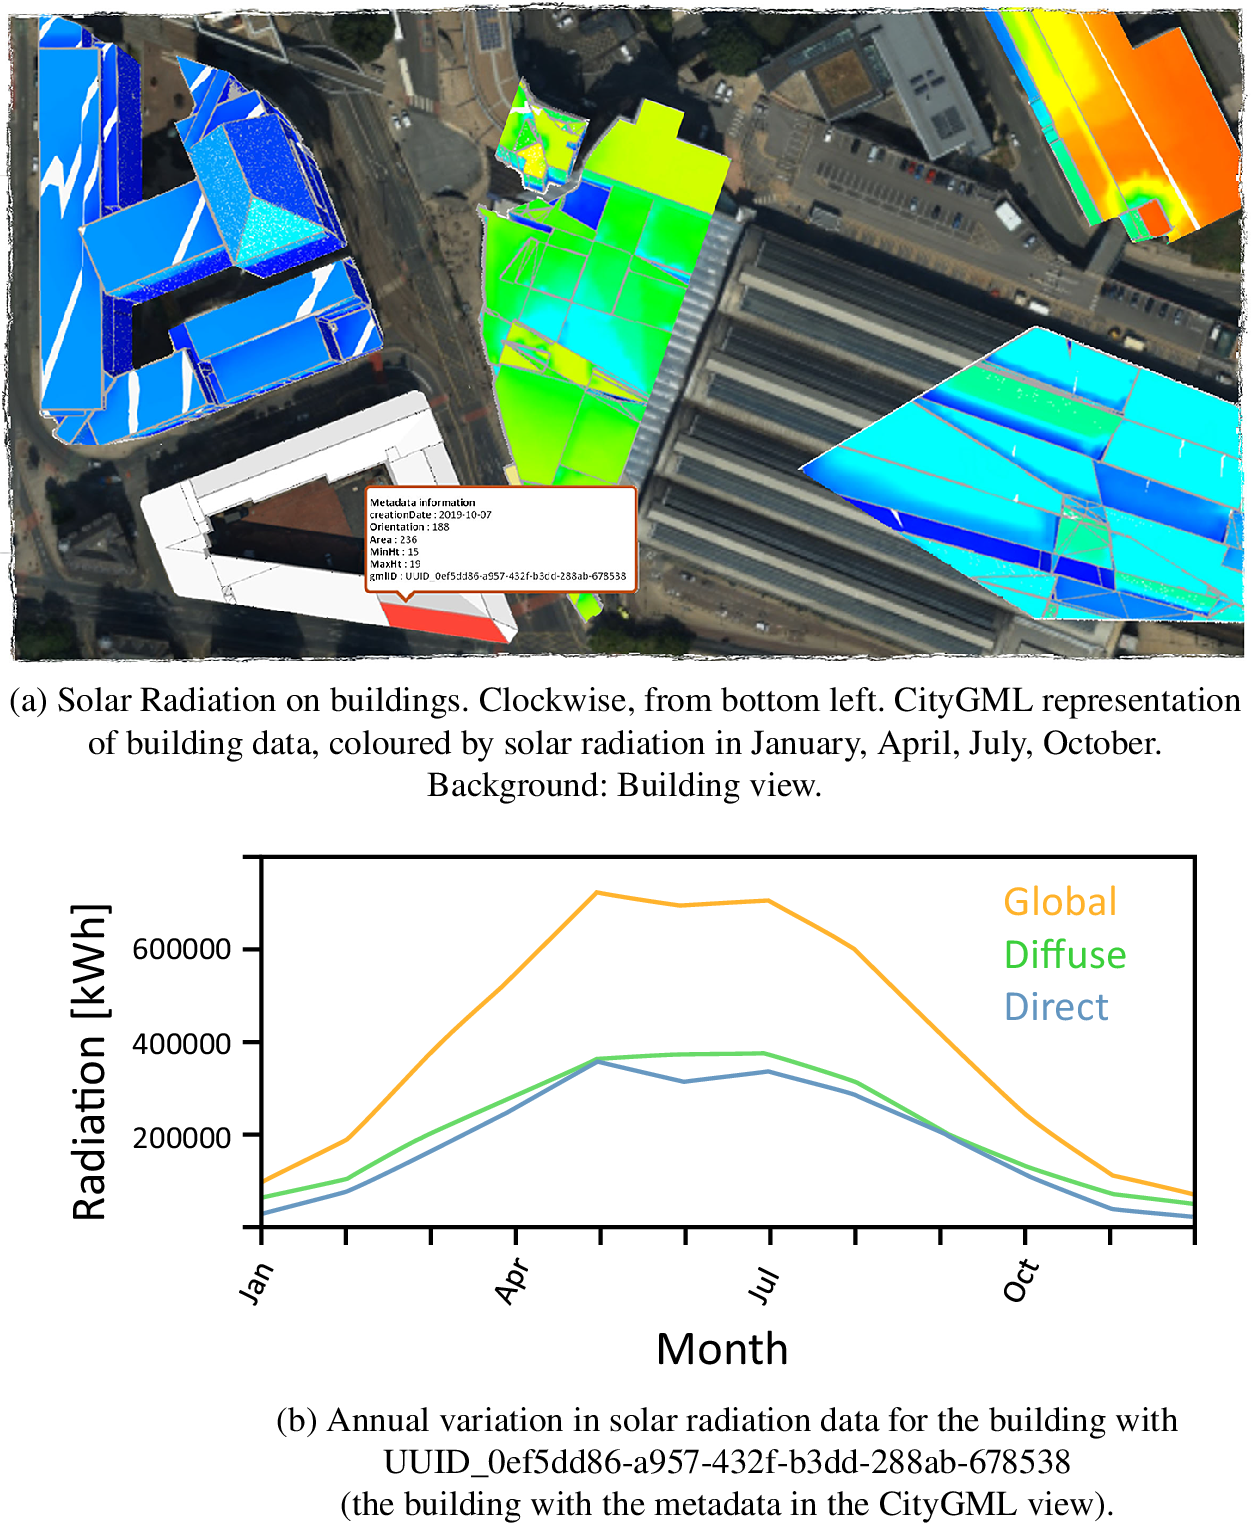
Figure 11 shows the built environment in the vicinity of Manchester Piccadilly Railway Station overlaid with data about the solar radiation incident on the roof of each building. The data are published as part of a virtual city map of Manchester (Virtual City Systems, 2020). This illustrates just one way in which the types of data in Figures 6–10 can be combined. Making such data available as part of a knowledge-graph-based digital twin of the UK presents the opportunity to include them in parallel world scenario analyses, for example, to investigate the building-by-building potential of installing solar panels and battery storage, either locally within each building, at a street or district level.
Modified screenshots of city data in the vicinity of Manchester Piccadilly Railway Station (Virtual City Systems, 2020). Contains public sector information licensed under the Open Government License v3.0.
4.2. Goal alignment for parallel worlds
The parallel worlds capability of the World Avatar offers a powerful tool to explore the design space of complex problems. However, the problems of interest, for example, how best to develop the UK infrastructure, rapidly become too complex to be treated in the manner of classical optimization problems. This is the case both in the sense that the problems are not amenable to defining a straightforward objective function and in the sense that the design space is too complex to be explored without some additional insight to suggest propitious scenarios. In an ideal world, computational agents would suggest scenarios and automate the exploration of the design space. In order to attempt this, it will be necessary to equip the agents with an understanding of our values and what we, as a society, want to achieve. In other words, we need to equip the agents with goals.
There are many ways to define goals. The sustainable development goals (SDGs) (United Nations, 2015) defined by the UN offer one possible starting point. There are 17 SDGs, which are further specified in terms of 169 targets, each of which is associated with a set of proposed indicators. Each level in this hierarchy is increasingly specific, so whilst the goals are abstract, the indicators are specific and measurable. Table 1 shows an example for SDG 9.
Sustainable Development Goal 9, Target 9.4 and Indicator 9.4.1.
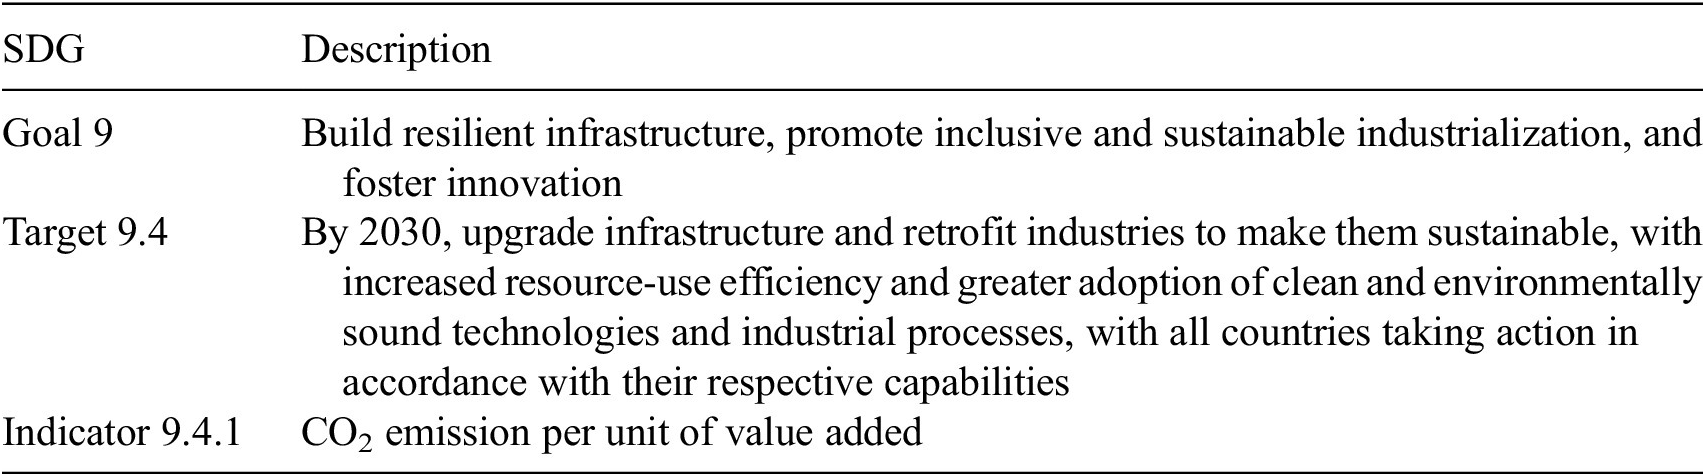
A sustainable development goals interface ontology (SDGIO) already exists (Sustainable Development Goals Interface Ontology [SDGIO], 2015). Work is underway to link the World Avatar to this ontology and to create agents to evaluate selected SDG Indicators. The current focus is on Indicator 9.4.1. Data for all the UK power stations (and in fact power stations worldwide) are available via the World Avatar, and agents are being developed to estimate the emissions intensity of power generation in the UK and worldwide. Such agents can be written by placing thin, standardized wrappers around conventional pieces of software, irrespective of whether they are in-house, third-party, or expensive-to-evaluate (see, e.g., Mosbach et al., Reference Mosbach, Menon, Farazi, Krdzavac, Zhou, Akroyd and Kraft2020). In the first instance, the emissions intensity of power generation will be calculated as CO2 emissions per unit electrical power produced, as opposed to per unit value added. The rationale for this is that the power produced is a measurable physical quantity, whereas value added is less straightforward to define. The ability to evaluate these indicators and learn how actions investigated in parallel worlds translate to progress toward things like the SDGs provides a possible route for how to develop the insight required to suggest new scenarios.
Another possible route forward could be to calculate goals based on environmental, social, and governance (ESG) metrics, either for individual companies or for specific industrial sectors. Such metrics are projected to be incorporated into future financial regulations and will be strongly linked to the risk and growth profiles of the companies involved. The use of the dynamic knowledge graph could help address the issues of ambiguity and consistency that currently affects such metrics because all metrics would be calculated on the basis of the same data set. For example, environmental factors such as emissions, waste management, water and energy usage could be assessed based on real-world data from the knowledge graph. Further, the parallel worlds capability would allow industries to explore the impact of different strategies, for example investment in different energy technologies, and use this to guide their corporate social responsibility (CSR) strategy.
Inevitably, there will arise scenarios where goals conflict with each other (Fuso Nerini et al., Reference Fuso Nerini, Tomei, To, Bisaga, Parikh, Black, Borrion, Spataru, Castán Broto, Anandarajah, Milligan and Mulugetta2018). For example, building more roads may enable better access to schools and therefore better education, so lifting people out of poverty and reducing hunger. However, this would also lead to more road use which could (depending on the type of transport) lead to more pollution. It is therefore necessary to consider goal alignment, that is to say, how to ensure that the scenarios considered by the World Avatar support the goals of humanity. This could potentially be achieved by using the goals not only to inform, but also constrain the suggestion of scenarios. The questions of how to suggest scenarios and achieve goal alignment remain important topics of research.
5. Conclusions
This paper demonstrates for the first time how a comprehensive digital twin can be implemented as a dynamic knowledge graph built using technologies from the Semantic Web stack. Examples are presented from the World Avatar project.
The World Avatar dynamic knowledge graph is composed of Linked Data and an ecosystem of computational agents operating on the knowledge graph. The agents enable the automated incorporation of new data and the calculation of quantities of interest, such that the dynamic knowledge graph is able to evolve in time and remain up-to-date.
The contents of the dynamic knowledge graph are instantiated using ontologies that provide semantic models of the domains of interest and of computational agents. This design confers versatility because it enables agents to update and restructure the knowledge graph, and to discover and compose other agents simply by reading from and writing to the knowledge graph. Further, the knowledge graph could, in principle, be extended to accommodate any concept that is required in the future. It has a distributed architecture that supports a uniform SPARQL query and update interface, and that supports the same access control technologies that already secure electronic data. The use of Linked Data helps address the issues of ambiguity, and enables the linking of provenance information and related data, supporting the discovery and reuse of data and results.
Use cases from the World Avatar demonstrate key aspects of the dynamic knowledge graph. The Cities Knowledge Graph project is being used to develop a pilot for a comprehensive knowledge management platform that provides interoperability between different types of city-relevant data to improve the planning of cities. The PIPS project demonstrates the versatility of the dynamic knowledge graph both in terms of the breadth of domains that it can accommodate, and that it can interact with systems in the real world. Use cases from the J-Park Simulator were used to introduce the concepts of the base world and parallel worlds. The base world describes the real world as it is and allows for intelligent control of infrastructure. The parallel worlds allow scenario analysis to support the intelligent exploration of alternative designs whilst remaining linked to, but without affecting the base world.
The use case from the base world demonstrates the cross-domain interoperability of the dynamic knowledge graph. Agents calculate the impact of shipping on the air quality by combining live feeds of weather and shipping data, fuel chemistry and combustion simulations with atmospheric dispersion simulations. The agents wrap around commercial software and third party APIs, and offer black box, gray box and physics-based models. A composition agent is used to select which agents to deploy. A smart contract system enables agent selection to be performed using quality of service (QoS) measures, and offers the possibility of a software-as-a-service licensing model.
The use case from the parallel world demonstrates the use of the dynamic knowledge graph to perform scenario analysis. The example explores how the design of possible energy systems changes when a carbon tax is levied on emissions from power generation. It identifies the tax level that is required to motivate a change to cleaner energy technologies, and calculates the optimal design and operating conditions of the new system. The parallel worlds capability raises a number of important research questions relating to how to explore design spaces that are too complex to be addressed as conventional optimization problems. For example, how to assess whether a scenario is beneficial, how to make good suggestions for alternative scenarios and how to ensure alignment between the scenarios considered by the digital twins and the goals of society? One option is to take inspiration from the SDGs defined by the UN and from metrics for ESG in the context of corporate decision making. Work to evaluate progress toward the SDGs has been started.
Work to develop a knowledge-graph-based digital twin of the UK is ongoing. The next iteration of the digital twin will be applied in the context of supporting the decarbonization of the UK energy landscape and will enable the semantic annotation of data describing the power system and the electrical and gas transmission systems, of data describing solar radiation and wind, and of data describing what biomass is grown where. The Semantic Web stack provides tools that confer a number of advantages on knowledge-graph-based digital twins. However, the implementation of a digital twin that meets the needs of a Universal Digital Twin remains hugely challenging and poses a number of open questions. Nonetheless, there are good reasons to be optimistic. The achievements of Google, Microsoft, IBM, Facebook, and eBay (Noy et al., Reference Noy, Gao, Jain, Narayanan, Patterson and Taylor2019) show that these types of technical challenges can be addressed and that the results have the potential to be extraordinary.
Nomenclature
Acknowledgments
Thank you to the members of the Computational Modelling (CoMo) Group in the Department of Chemical Engineering and Biotechnology at the University of Cambridge, the members of the Cambridge Centre for Advanced Research and Education in Singapore (CARES), and the members of Computational Modelling Cambridge Ltd. (CMCL) who have contributed to the research underlying the ideas described in this paper. Special thanks to Tom Savage who helped prepare a number of the figures and to Dr Feroz Farazi who helped check some of the text.
Author Contributions
Conceptualization, J.A., S.M., A.B., M.K.; Formal analysis, J.A., S.M., M.K.; Funding acquisition, J.A., S.M., A.B., M.K.; Methodology, J.A., S.M., A.B., M.K.; Software, J.A., S.M.; Supervision, J.A., S.M., M.K.; Validation, J.A., S.M., M.K.; Visualization, J.A., S.M., M.K.; Writing—original draft, J.A.; Writing—review and editing, J.A., S.M., A.B., M.K. All authors approved the final submitted draft.
Data Availability Statement
Data availability is not applicable to this article as no new data were created or analyzed in this study.
Competing Interests
The authors declare no competing interests exist.
Funding Statement
This research was supported by the National Research Foundation, Prime Minister’s Office, Singapore under its Campus for Research Excellence and Technological Enterprise (CREATE) programme. Part of the research was also funded by the European Commission, Horizon 2020 Programme, DOME 4.0 Project, GA 953163. The funders had no role in study design, data collection and analysis, decision to publish, or preparation of the manuscript. Additional support for a number of PhD studentships was provided by Computational Modelling Cambridge Ltd. M.K. gratefully acknowledges the support of the Alexander von Humboldt Foundation.


 Open access
Comments
No Comments have been published for this article.