


Introduction
The creation of protected areas (PAs) is one of the main strategies for the maintenance of biodiversity and ecosystem services in the face of the growing destruction of natural environments (Gaston et al. Reference Gaston, Jackson, Cantú-Salazar and Cruz-Piñón2008, Joppa & Pfaff Reference Joppa and Pfaff2011). Until 2007, there was an increase in the number and extent of PAs around the world (Jenkins & Joppa Reference Jenkins and Joppa2009). Brazil played an important role worldwide in this increase of PAs between 2003 and 2009, mostly in the Amazon region (Jenkins & Joppa Reference Jenkins and Joppa2009).
According to the Brazilian Federal Law nº 9.985/2000, which legislates the National System of Protected Areas (Sistema Nacional de Unidades de Conservação; SNUC 2000), PAs in Brazil can involve either strict protection or sustainable use, and they are created and managed by federal, state or municipal jurisdictions (Pereira & Scardua Reference Pereira and Scardua2008). The purpose of strict PAs is to preserve nature and allow only the indirect use of its natural resources, whereas sustainable use PAs aim to reconcile nature conservation with the sustainable use of some portion of its natural resources (Supplementary Table S1, available online).
The number and size of Brazil’s PAs increased from the late 1990s to the 2000s and became more substantial and consistent after the establishment of the SNUC law (SNUC 2000) and the Programa Áreas Protegidas da Amazônia (Protected Areas Program of Amazonia; Medeiros et al. Reference Medeiros, Young, Pavese, Araújo, Pereira, Rodrigues, Medeiros and Araújo2011, Bernard et al. Reference Bernard, Penna and Araújo2014). The federal government has changed its PA creation strategy in Brazil since the 1990s, when the number and size of sustainable use PAs began to increase, intending to better align the environmental issues of the country’s economic development agenda with biodiversity conservation (Cabral & Brito Reference Cabral and Brito2013). Ninety-three instances of PA downgrading, downsizing and degazettement were identified between 1981 and 2012 (Bernard et al. Reference Bernard, Penna and Araújo2014).
Although the expansion of PAs has been significant in recent years, this effort is not consistent across all of the Brazilian biomes. Conservation investments were mainly allocated to the Amazon region, resulting in 28% of its area being within PAs (Vieira et al. Reference Vieira, Pressey and Loyola2019). The second highest percentage of protection among Brazilian biomes is in the Atlantic Forest, which has c. 10% of its area within PAs, followed by the Cerrado (8.6%), the Caatinga (7.7%), Pantanal (4.6%) and Pampa (only 2.7% of its total area inside PAs; Vieira et al. Reference Vieira, Pressey and Loyola2019).
Seasonally Dry Tropical Forest and Woodland (SDTFW) constitutes a biome with a global distribution of vegetation unities, which present structural and functional similarities due to parallel environmental filters (Moncrieff et al. Reference Moncrieff, Bond and Higgins2016, Queiroz et al. Reference Queiroz, Cardoso, Fernandes, Moro, da Silva, Leal and Tabarelli2017). These filters are primarily climatic conditions such as high annual mean temperature (typically above 17°C), high potential evapotranspiration and annual rainfall of 250–2000 mm (Dirzo et al. Reference Dirzo, Young, Mooney and Ceballos2011). However, the most distinctive environmental filter in SDTFW is its rainfall seasonality, with 4–6 dry months yearly when rainfall is less than 100 mm (Gentry Reference Gentry, Medina, Mooney and Bullock1995). The unique phenology of the plant communities of SDTFWs is therefore shaped by alternating deciduousness during dry periods and evergreen in the rainy season (Mooney et al. Reference Mooney, Bullock, Medina, Medina, Mooney and Bullock1995).
There is a history of research and conservation neglect in the SDTFW biome (Pennington et al. Reference Pennington, Lehmann and Rowland2018). Compared with humid tropical forests, fewer scientific studies have been performed on SDTFW (Hughes et al. Reference Hughes, Pennington and Antonelli2012, Pennington et al. Reference Pennington, Lehmann and Rowland2018). This relative lack of knowledge is reflected in current high rates of species description for the biome (Silva et al. Reference Silva, Leal and Tabarelli2017b). Only in the past 3 years, for example, the floristic composition of the Caatinga SDTFW increased from 3150 to 3347 species (see Queiroz et al. Reference Queiroz, Cardoso, Fernandes, Moro, da Silva, Leal and Tabarelli2017, Fernandes et al. Reference Fernandes, Cardoso and de Queiroz2020). Furthermore, Miles et al. (Reference Miles, Newton, DeFries, Ravilious, May and Blyth2006) estimated that 97% of the remaining area of these tropical dry forests is at immediate risk from one or more threats, including agriculture and pasture conversion, fragmentation, fire, human occupation and climate change. This background implies that, without the implementation of a representative network of PAs, the SDTFW biome is at risk of losing biodiversity that is yet to be described.
Approximately 67% of the remaining global SDTFW area is in the Neotropics (Miles et al. Reference Miles, Newton, DeFries, Ravilious, May and Blyth2006), where the Caatinga is the largest SDTFW and is entirely restricted to Brazil (Silva et al. Reference Silva, Barbosa, Leal, Tabarelli, Silva, Leal and Tabarelli2017a). The dominant Caatinga vegetation ranges from open scrublands to tall, dry forests shaped by high inter-annual variability in rainfall (Silva et al. Reference Silva, Barbosa, Leal, Tabarelli, Silva, Leal and Tabarelli2017a). The Caatinga region has the lowest gross domestic product (GDP) in Brazil, and in 2010 it was home to 28.6 million people; the combination of high human population density and low economic development results in significant anthropogenic pressure on natural resources (Silva et al. Reference Silva, Barbosa, Leal, Tabarelli, Silva, Leal and Tabarelli2017a). Poor rural populations depend significantly on free-range livestock (cattle and goats), small-scale agriculture and timber extraction (Silva et al. Reference Silva, Leal and Tabarelli2017b).
The Caatinga has been given low priority for investment in conservation, and it is currently one of Brazil’s least protected and studied biomes (Silva et al. Reference Silva, Leal and Tabarelli2017b). The budget for Caatinga PAs in 2012, for example, was 13 times lower than is considered necessary by the Brazilian Ministry of the Environment for the essential operation of a PA in Brazil (Oliveira & Bernard Reference Oliveira and Bernard2017). Most PAs in the biome are Environmental Protection Areas (EPAs; International Union for Conservation of Nature (IUCN) category V, according to Rylands & Brandon Reference Rylands and Brandon2005). EPAs are generally extensive, encompassing public and/or private areas, and because they fall within the most permissive PA category, they frequently present a certain degree of human occupation (Fonseca et al. Reference Fonseca, Antogiovanni, Matsumoto, Bernard, Venticinque, Da Silva, Leal and Tabarelli2017). The difficulty in managing EPAs arises from the large number of private areas that they harbour and from the public authority’s inefficient application of zoning within their boundaries (Sousa et al. Reference Sousa, Santos, Salgado, Araújo, Medeiros and Araújo2011).
Considering the importance of PAs as an efficient mechanism of biodiversity conservation, we aimed to identify biases and trends in Caatinga PAs to support future decisions regarding the conservation of this biome. First, we compared the extent of Caatinga protection with that of other SDTFWs in the Neotropics. Then, we assessed the expansion in number and area of Caatinga PAs from 1946 to 2021. We expected that: (1) over time, state governments would have created more PAs than the federal government and that both would have been more inclined to create sustainable use PAs in the Caatinga, especially EPAs, rather than strict PAs, following national trends (Rylands & Brandon Reference Rylands and Brandon2005); and (2) the sizes of federal and state PAs would not differ, but EPAs would be larger on average than strict PAs, once EPAs became generally extensive (Fonseca et al. Reference Fonseca, Antogiovanni, Matsumoto, Bernard, Venticinque, Da Silva, Leal and Tabarelli2017). For each state in Caatinga, we also investigated the proportion of Caatinga area covered by PAs and evaluated the correlation between this proportion and the total Caatinga area in the state. However, assuming each state’s independence in environmental policy, we had no a priori hypothesis for this correlation.
Methods
Comparisons of total PAs among SDTFWs in the Neotropics
We compared the total PA in the Caatinga with other SDTFWs from the Neotropics. We compiled spatial data from the World Database on Protected Areas (WDPA) from 2021 (UNEP-WCMC & IUCN 2021) and only considered PAs categorized by the IUCN. We used major groups of SDTFWs from the Neotropics (Neotropical SDTFW) according to Queiroz et al. (Reference Queiroz, Cardoso, Fernandes, Moro, da Silva, Leal and Tabarelli2017): Caatinga, south-western South America, Pacific South America, Inter-Andean dry valleys, north-western South America, Caribbean and Mesoamerica. These groups were classified based on the map of terrestrial ecoregions of the world (Olson et al. Reference Olson, Dinerstein, Wikramanayake, Burgess, Powell and Underwood2001).
Spatial data assembling and processing
In order to assess the expansion in the number and size of Caatinga PAs, we compiled spatial data on Caatinga PAs through the Ministry of Environment’s Cadastro Nacional de Unidades de Conservação do Ministério do Meio Ambiente (national registry of PAs; MMA 2021). This database is more complete and better updated than the WDPA. We gathered information on jurisdiction (federal, state or municipal), protection type (strict protection or sustainable use), category (see Supplementary Table S1) and year of creation. We downloaded shapefiles of the Caatinga and Brazilian states and calculated the area of each state within the Caatinga boundaries, the total area of each PA inside the Caatinga and the total area of PAs within each state in hectares. If PAs of different protection types or jurisdictions overlapped, we considered only the most restrictive type and highest-protection jurisdiction for area calculations. We used QGIS (QGIS.org 2018) for mapping, shapefile management and area calculations.
Any analyses comparing protection types can produce skewed results for the sustainable use type because EPAs are larger and have more permissive uses of natural resources (Fonseca et al. Reference Fonseca, Antogiovanni, Matsumoto, Bernard, Venticinque, Da Silva, Leal and Tabarelli2017). Therefore, we decided to analyse EPAs separately from the remaining sustainable use areas. Private reserves were not considered in this study because they are created only according to private interest, and there are still many gaps in official spatial data of private reserves. Private conservation lands in Brazil are certainly also essential for protecting biodiversity (da Silva et al. Reference da Silva, Pinto and Scarano2021), and there is great potential for a detailed evaluation of this PA category. Municipal PAs were also excluded from our analysis given their small number (only three municipal PAs in the database).
Data analysis
We used the χ2 test to assess the significance of the association between jurisdiction and PA type for areas created between 1946 and 2021. We assessed whether size differs between strict PAs, sustainable use PAs and EPAs among jurisdictions using a factorial analysis of variance (ANOVA) by permutation. We used a significance level with Bonferroni correction (α = 0.0166) in these post hoc tests among PA protection types once we had run three pairwise comparisons. The statistical analyses were run in R software (R Core Team 2021).
We analysed the expansion of PAs over time (number and size) considering three periods: (1) 1946–1991, in which government actions related to environmental preservation were still incipient (Medeiros et al. Reference Medeiros, Young, Pavese, Araújo, Pereira, Rodrigues, Medeiros and Araújo2011); (2) 1992–1999, the decade when goals were established to create PAs for biodiversity conservation, as proposed by the Convention on Biological Diversity in 1992 (see MMA 2000); and (3) 2000–2021, a time of greater engagement by the government in environmental issues (e.g., SNUC 2000) and of biodiversity conservation targets assumed by signatory countries during the Conference of the Parties in 2010 (Weigand et al. Reference Weigand, Silva and Silva2011).
We analysed the relationship between the state’s area in the Caatinga and the area proportion of EPAs in PAs in each state using Pearson correlation (Supplementary Fig. S1).
Results
Caatinga constitutes 32% of the global extent of Neotropical SDTFWs, followed by Mesoamerica with 28%, south-western South America with 23% and north-western South America with 7%, while the remaining three ecoregions contribute less than 5% each (Fig. 1 & Table 1). Contrasting these ecoregion areas with WDPA areas (UNEP-WCMC & IUCN 2021), the Caatinga has an average proportional degree of protection (4.18% of its area protected; Fig. 1) when compared to the other six SDTFWs (range 2.92–23.36%; Table 1).
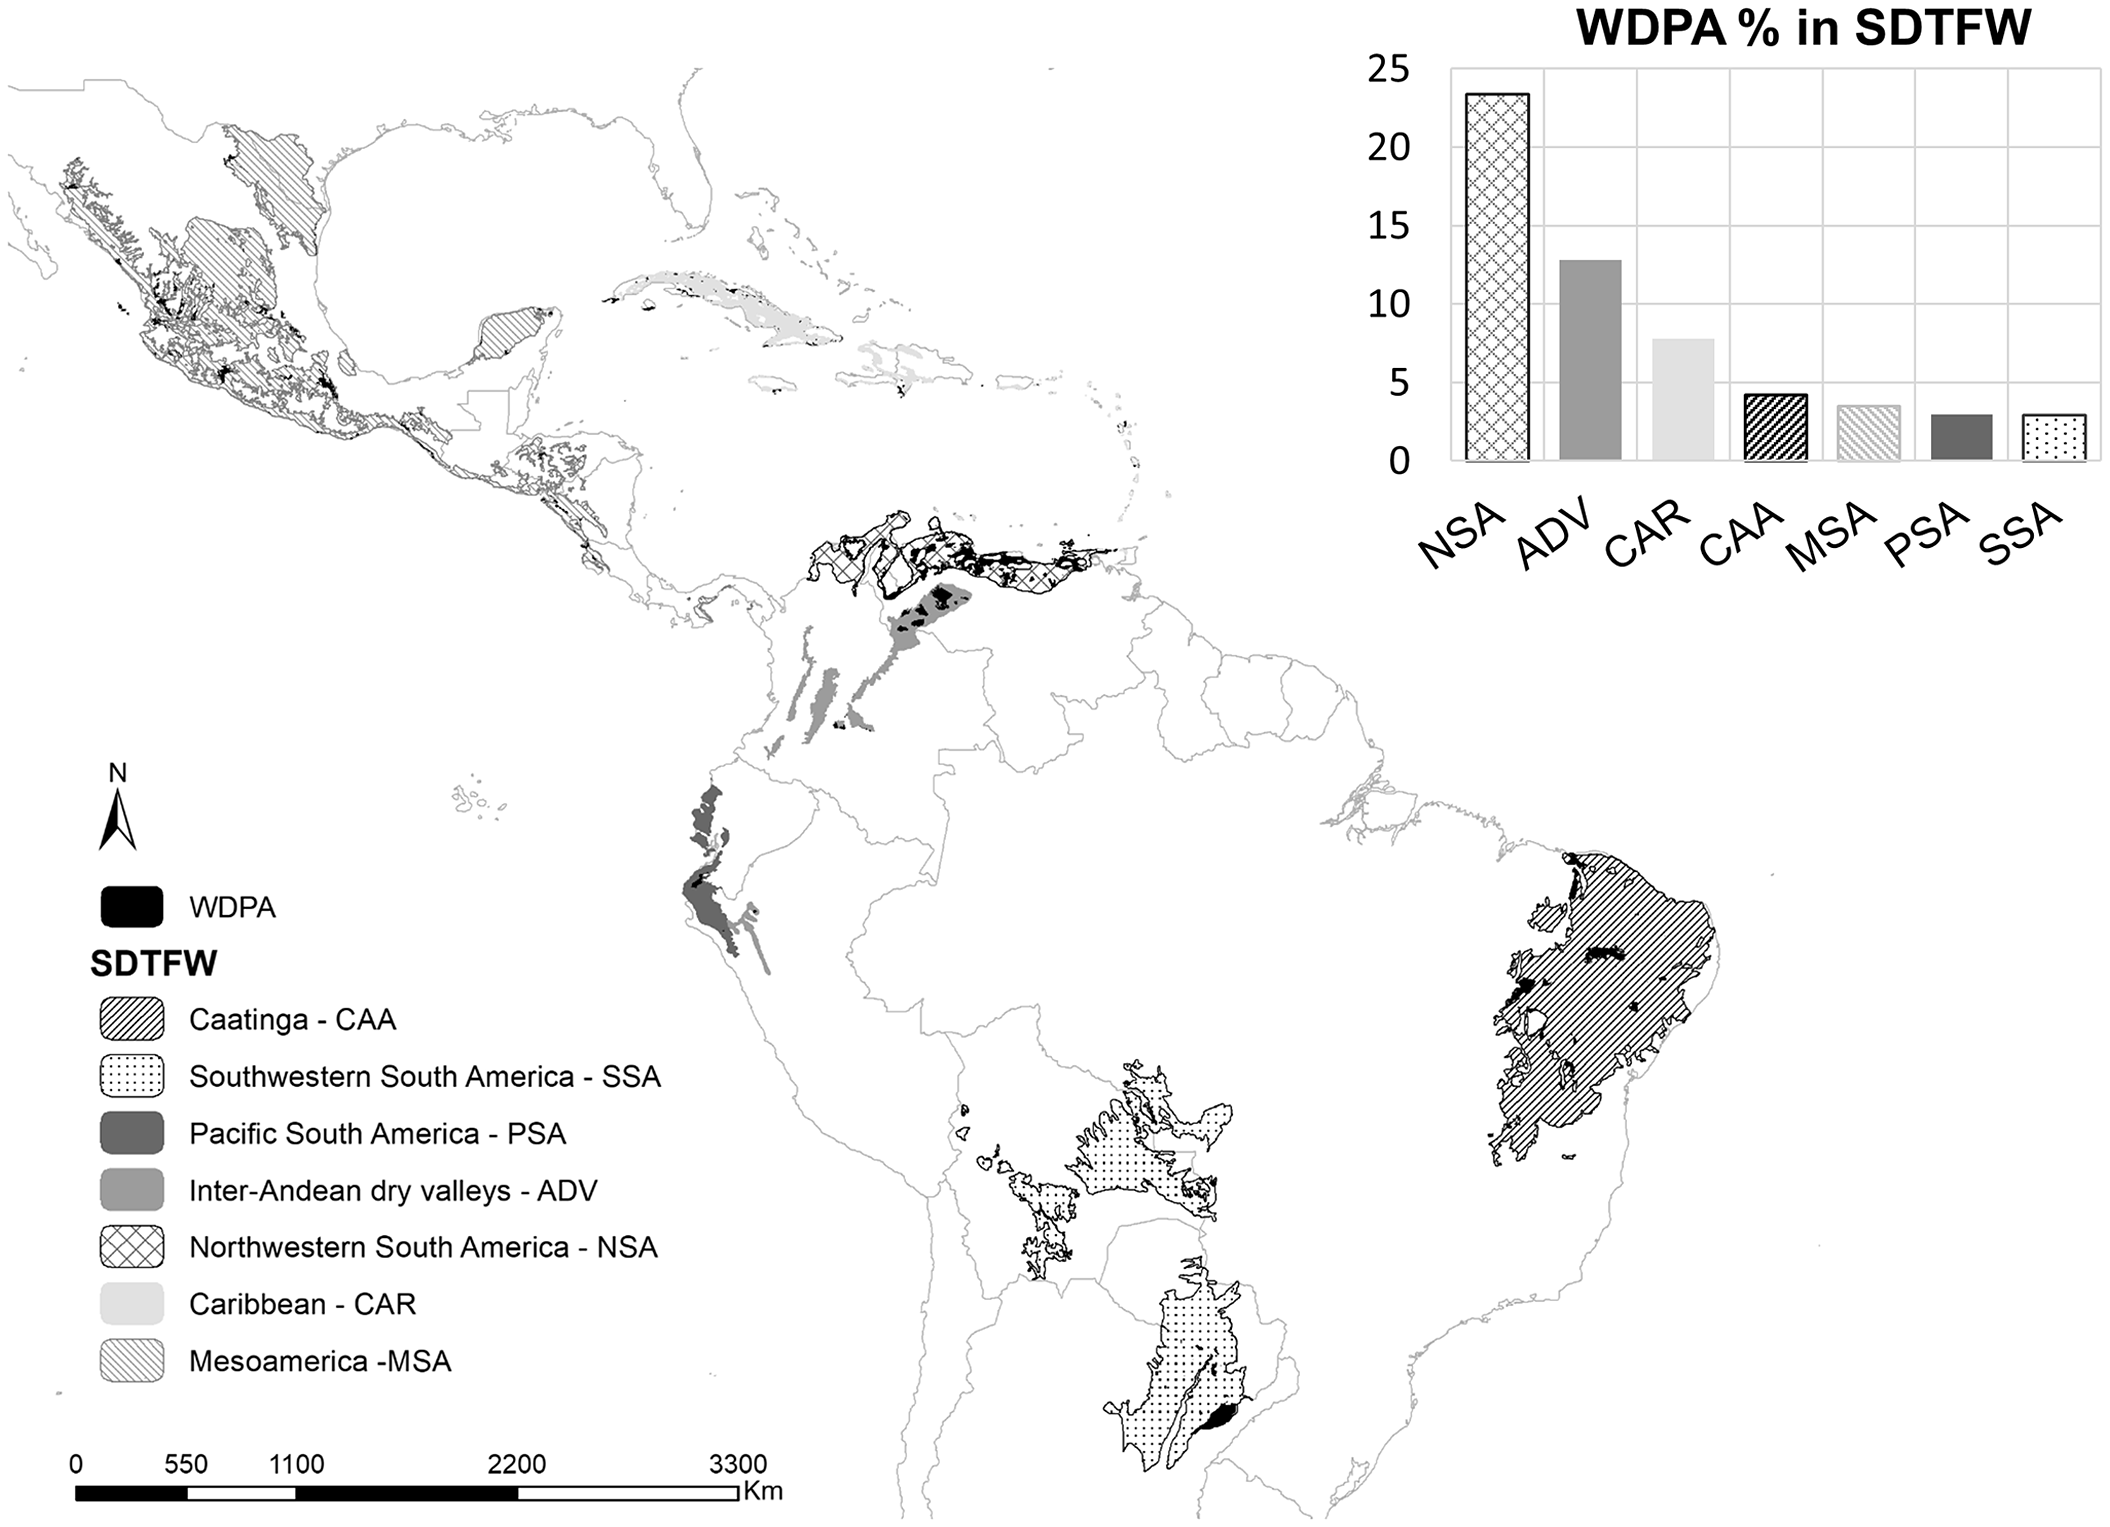
Fig. 1. Distribution map of the seven ecoregions classified as Seasonally Dry Tropical Forests and Woodland (SDTFW) biomes in the Neotropics (adapted from Queiroz et al. Reference Queiroz, Cardoso, Fernandes, Moro, da Silva, Leal and Tabarelli2017). Protected areas from the World Database on Protected Areas (WDPA) are presented in black. Each SDTFW ecoregion is represented in a distinct shade of grey or pattern, which is matched at the histogram (top right). The histogram shows percentage of ecoregion area protected by the WDPA (WDPA % in SDTFW).
Table 1. Protected areas in Seasonally Dry Tropical Forests and Woodlands (SDTFWs) in the Neotropics. Total area (ha) is the total area of the Neotropical SDTFWs. International Union for Conservation of Nature (IUCN) categories correspond to the area (ha) of protected areas of each IUCN category in Neotropical SDTFWs according to the World Database on Protected Areas (WDPA) from 2021. WDPA total (ha) is the total area of protected areas in each Neotropical SDTFW according to the WDPA from 2021. Protected (%) is the proportion of the total protected area in each Neotropical SDTFW. Protected area categories according to IUCN vary from most restrictive (Ia) to least restrictive (VI) use (see https://www.iucn.org/theme/protected-areas/about/protected-area-categories).

The Caatinga covers c. 82 795 415 ha (MMA 2016b). The official environmental agency data on PAs (MMA 2021) show that 8.9% of the biome’s area was under some form of legal protection; of the Caatinga area, only 1.8% is subject to strict protection, 0.1% is of sustainable use and 7% is in EPAs. The total area under protection is 7 373 262 ha, which is distributed in 107 distinct PAs. Of this total PA extent, 20% is in 55 strict PAs, 1.1% is in 17 sustainable use PAs and 78.9% is in 35 EPAs. Federal PAs correspond to 60% of the analysed protected Caatinga area, while 40% comprises state PAs (Fig. 2 & Table 2).
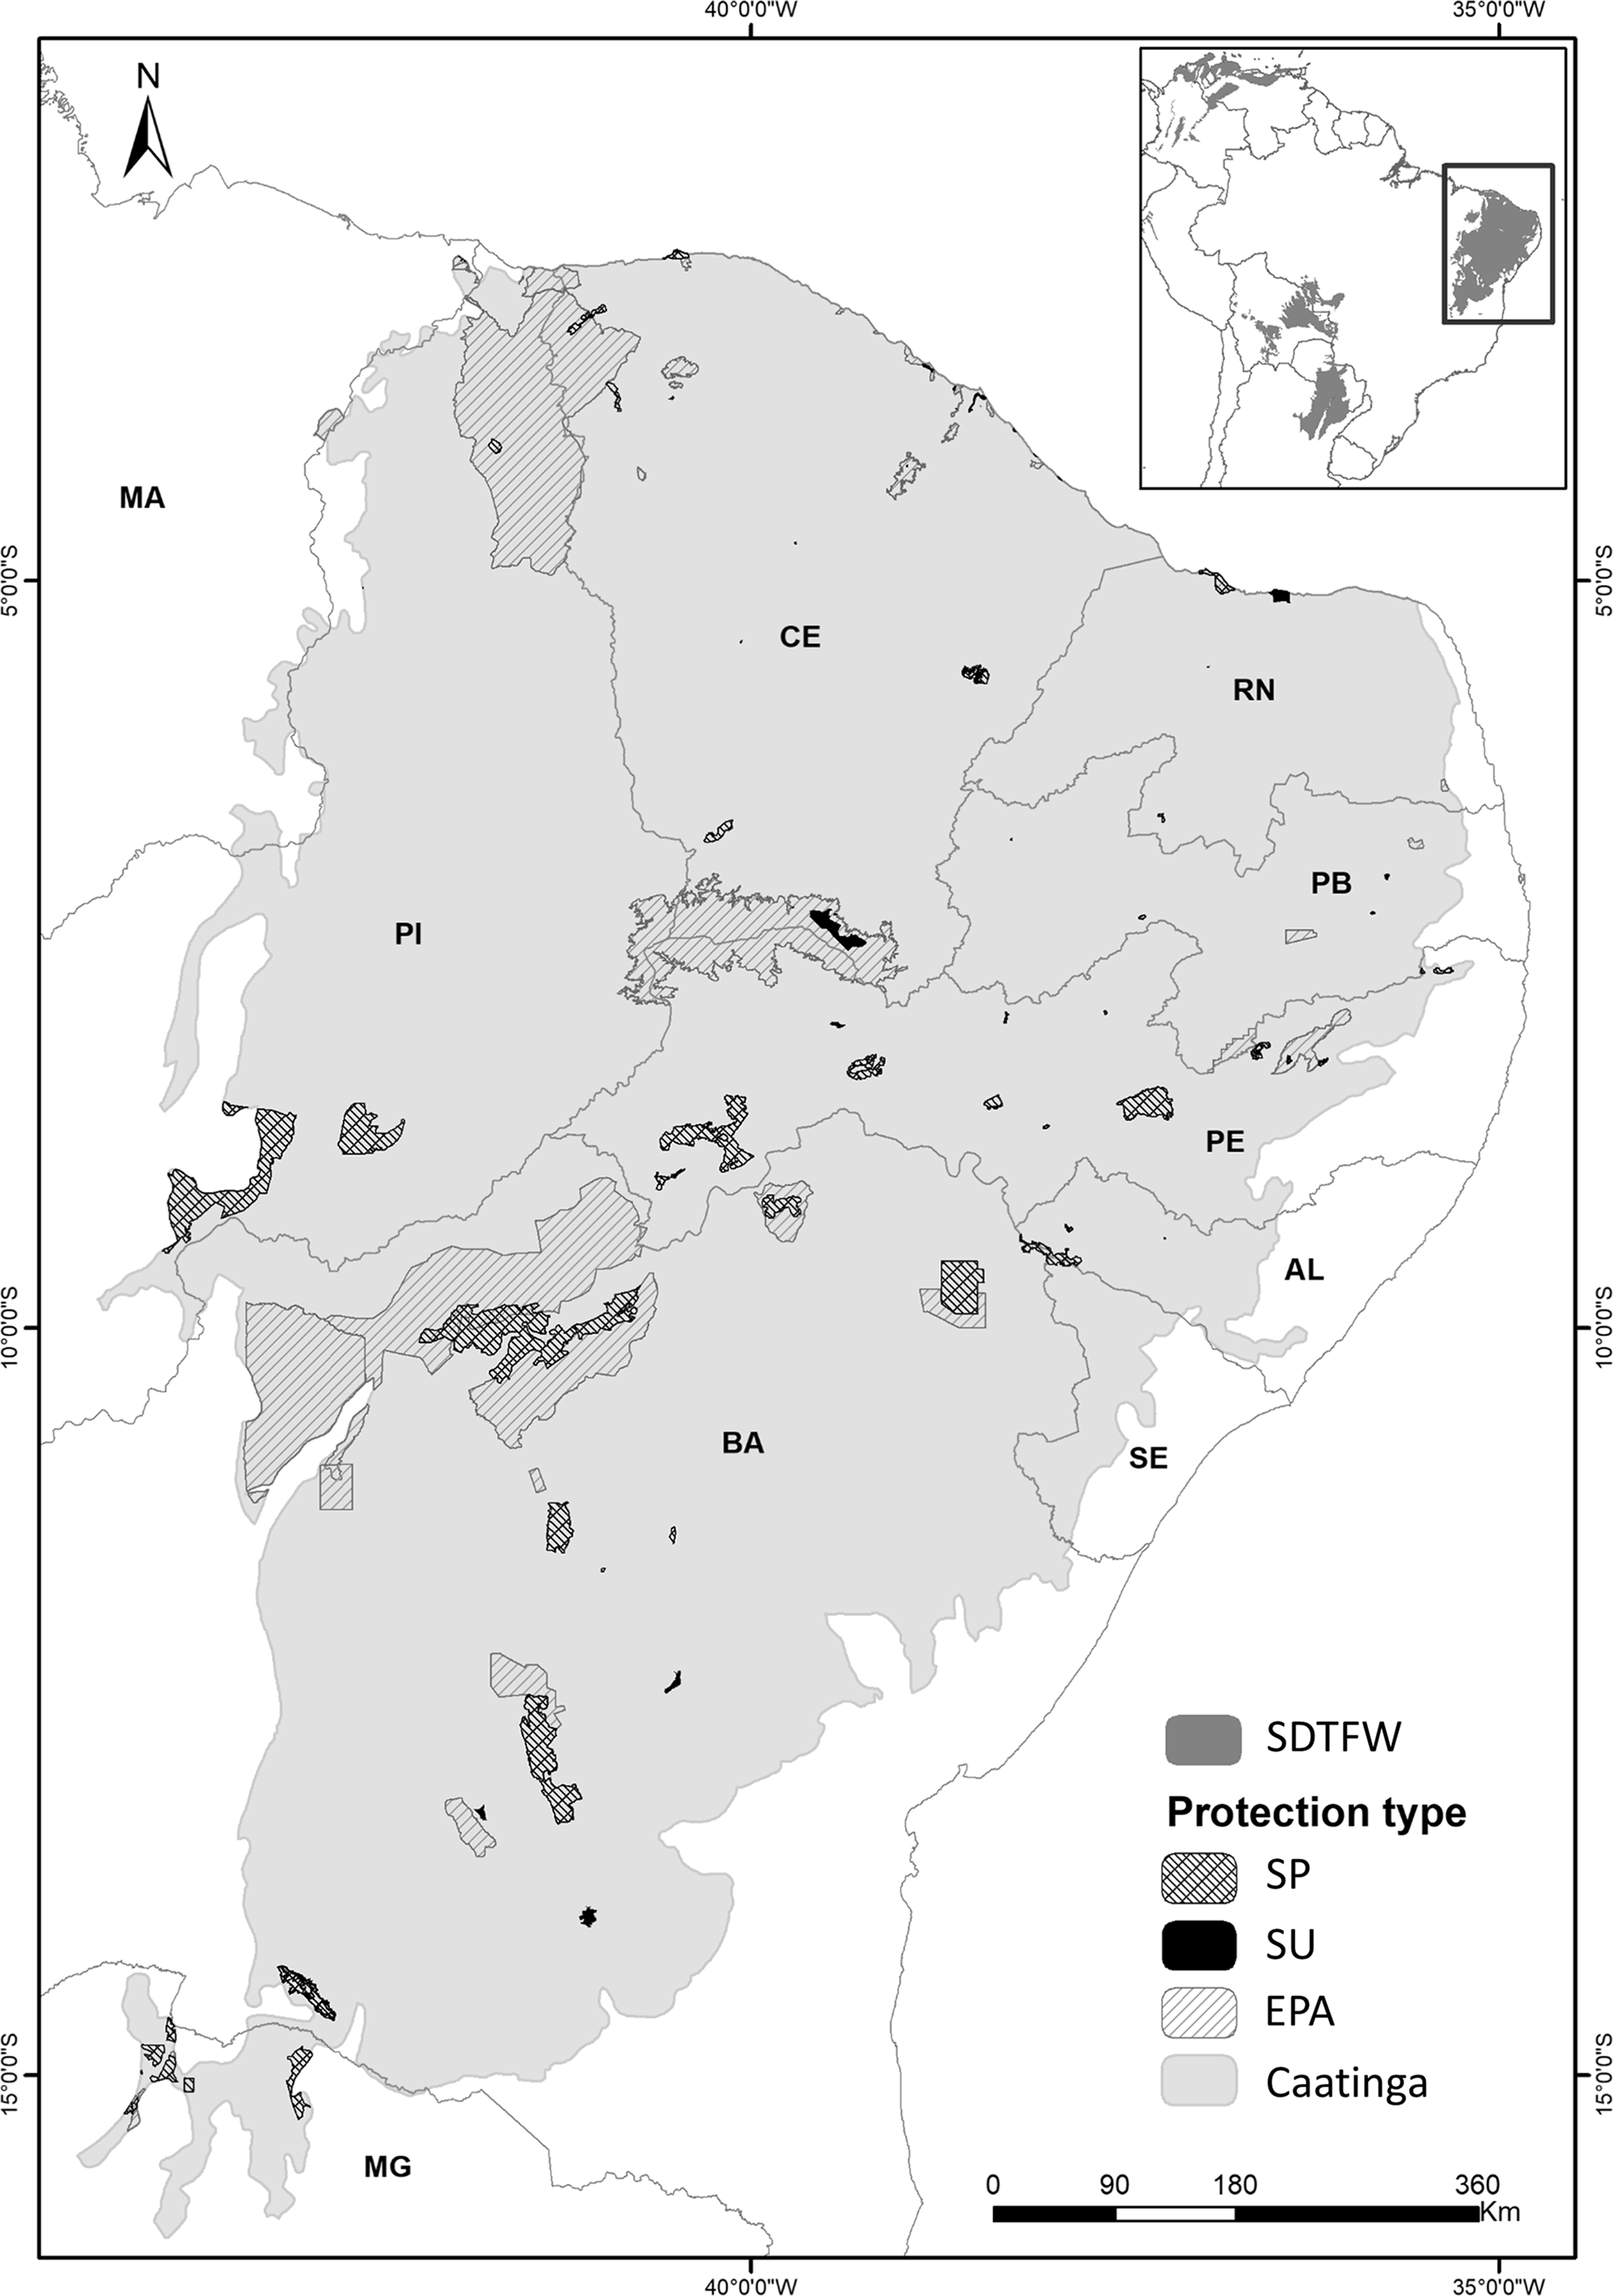
Fig. 2. Map of protected areas in the Caatinga Seasonally Dry Tropical Forests and Woodland (SDTFW) ecoregion. Protection types are: strict protection (SP; n = 55), sustainable use (SU; n = 17) and Environmental Protected Area (EPA; n = 35). AL = Alagoas; BA = Bahia; CE = Ceará; MA = Maranhão; MG = Minas Gerais; PB = Paraíba; PE = Pernambuco; PI = Piauí; RN = Rio Grande do Norte; SE = Sergipe.
Table 2. Protected areas (PAs) in the Caatinga by protection type and jurisdiction. Shown are the number (n), area extent in hectares (PA (ha)), proportion relative to total PA (PA (%)) and proportion relative to Caatinga area (Caatinga (%)) by protection type (strict protection, sustainable use and environmental protected area (EPA)) and jurisdiction (federal and state) in Brazil’s Caatinga.

The protection type was associated with jurisdiction (χ2 = 5.82, p = 0.05); the federal jurisdiction had fewer EPAs and more sustainable use PAs than expected, while the state jurisdiction had fewer sustainable use PAs and more EPAs than expected (Supplementary Table S2).
PA size differs in relation to jurisdiction (permutational two-way ANOVA: F = 24.95; df = 1, 101; p < 0.01) and protection type (F = 15.71; df = 2, 101; p < 0.01), although no interaction exists between jurisdiction and protection type (F = 0.855; df = 2, 101; p = 0.43). Federal PAs (135 667 ± 328 033 ha, median = 11 746 ha) are larger than state PAs (41 366 ± 172 205 ha, median = 3462 ha; Fig. 3). EPAs are larger (170 372 ± 386 105 ha, median = 14 185 ha) than strict PAs (27 211 ± 63 112 ha, median = 4820 ha; permutational ANOVA: F = 13.71; df = 1, 88; p < 0.01) and sustainable use PAs (4616 ± 9545 ha, median = 613 ha; permutational ANOVA: F = 27.23; df = 1, 50; p < 0.01). However, there is no difference in the sizes of strict and sustainable use PAs (permutational ANOVA: F = 4.02; df = 1, 70; p = 0.05). The sustainable use PA size range is c. 11–38 917 ha, the strict PA size range is 15–346 906 ha and the EPA size range is 497–1 611 373 ha (Fig. 3).
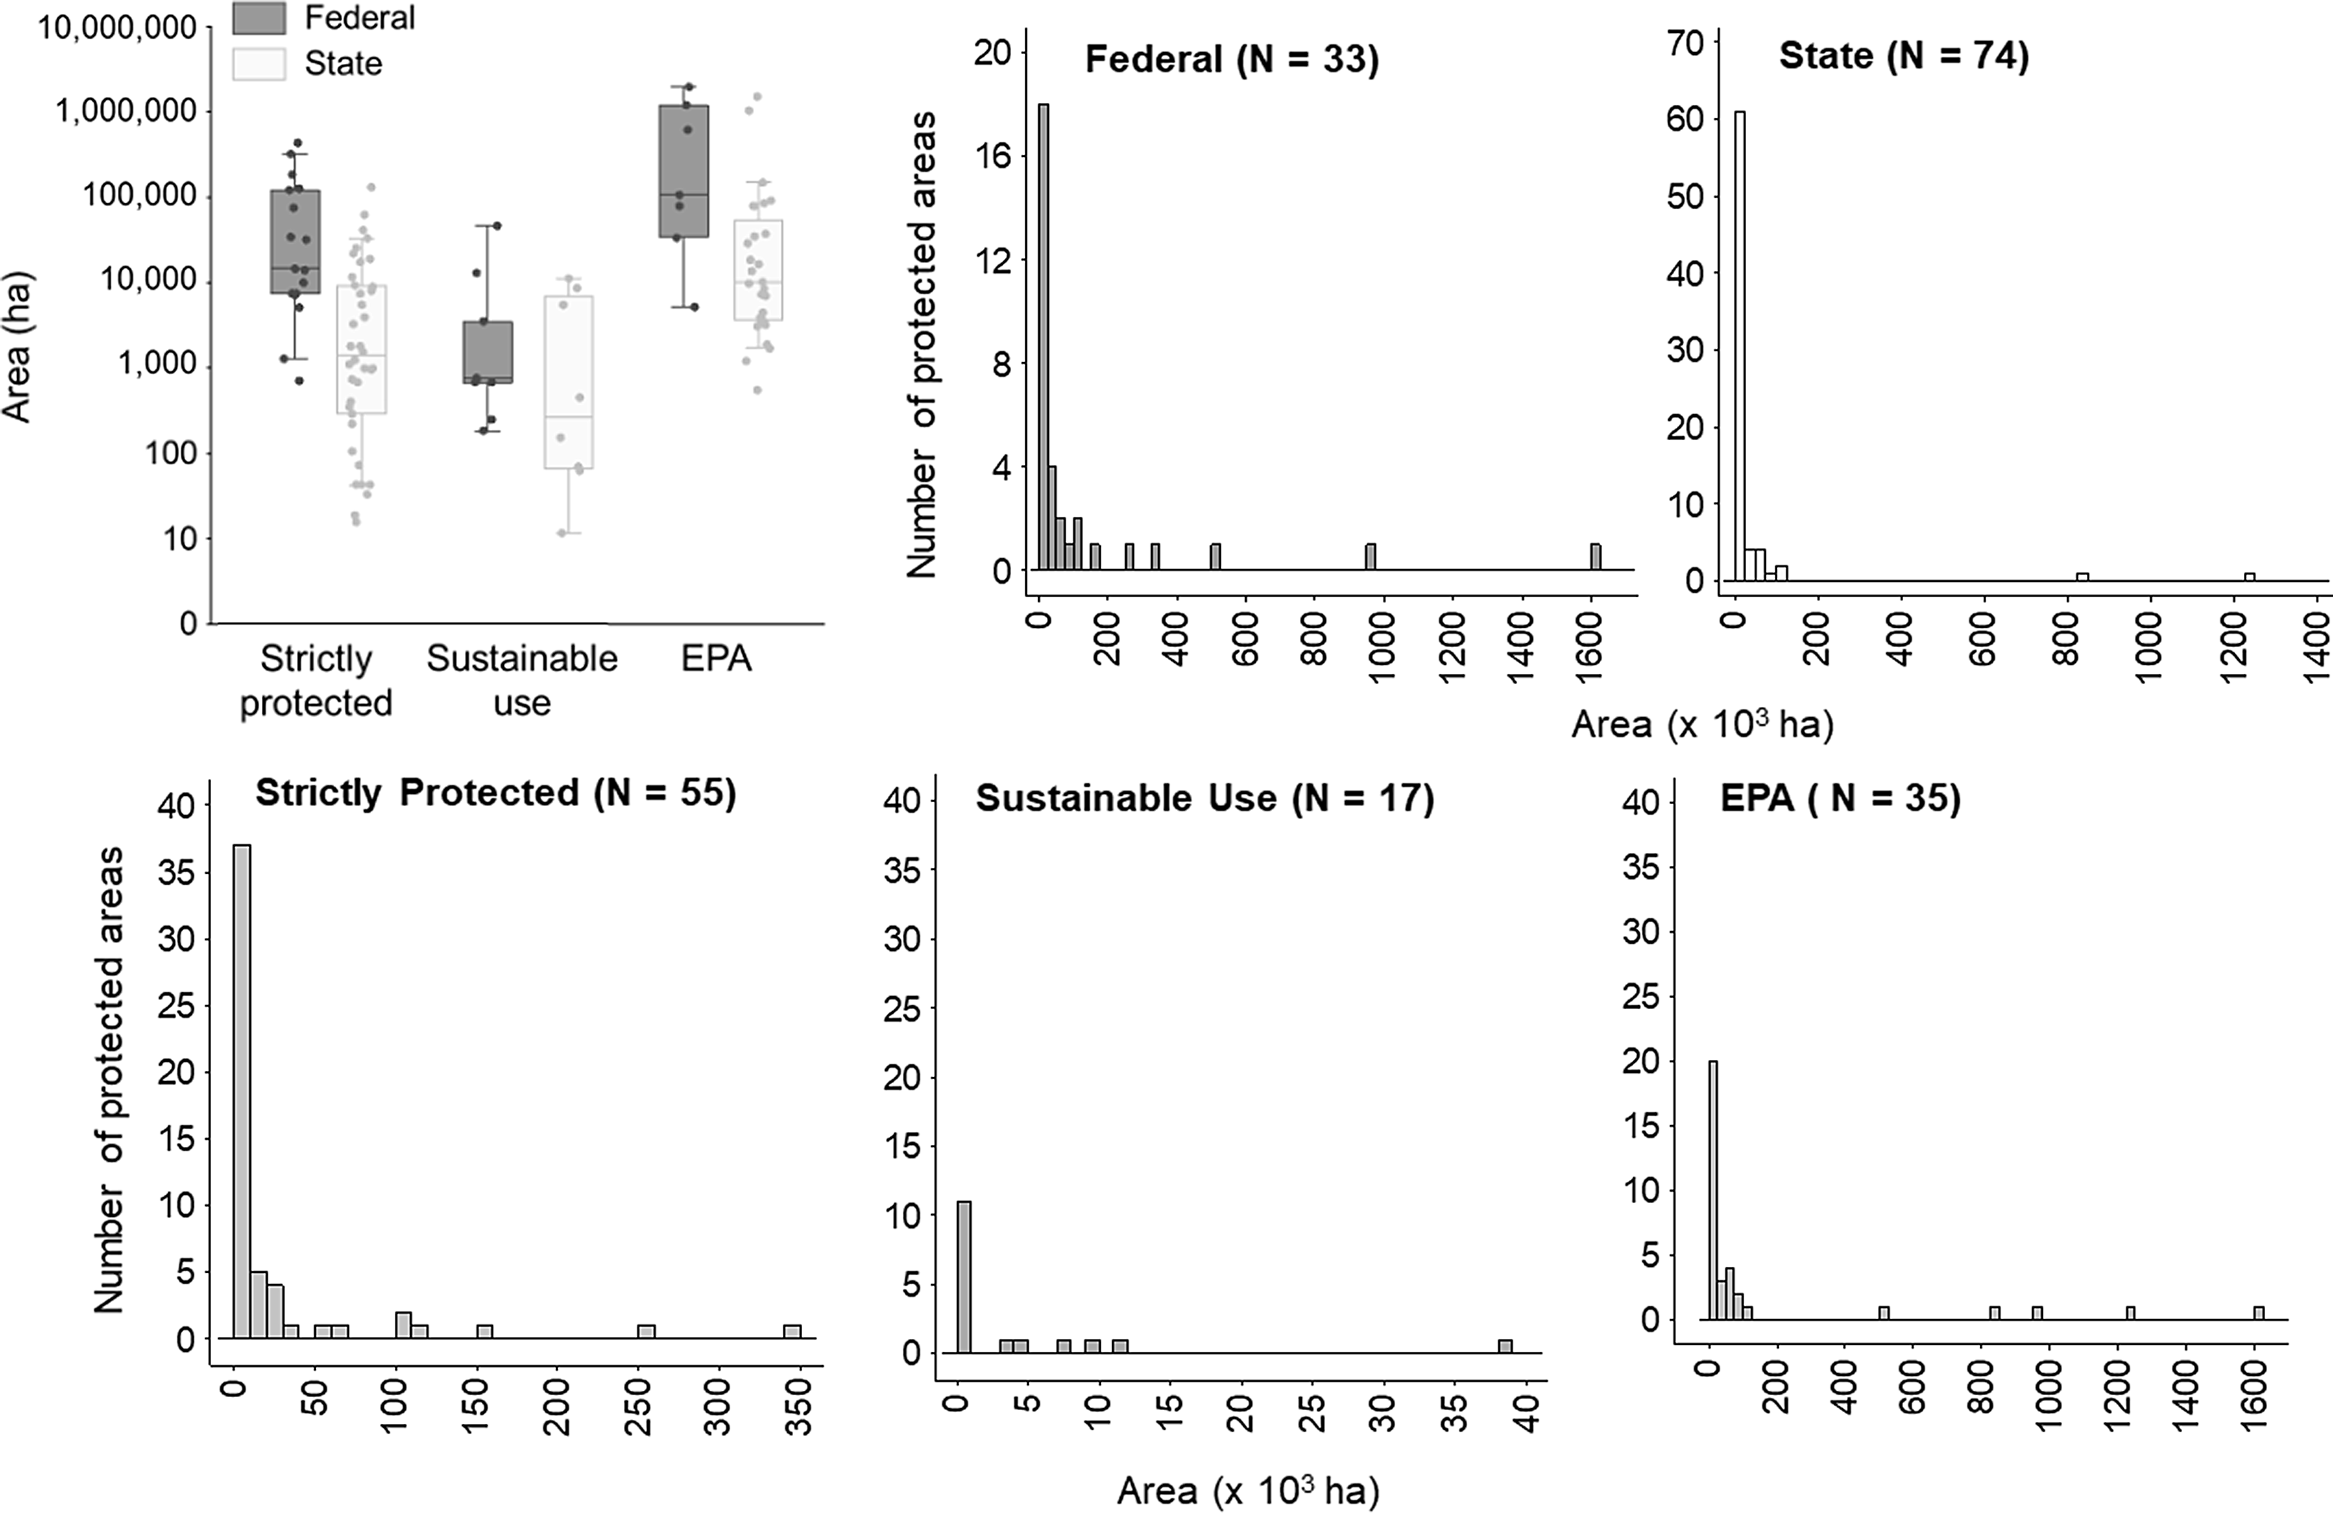
Fig. 3. Left uppermost panel is a histogram contrasting jurisdiction and protection type. Federal protected areas (PAs) are larger than state PAs. Environmental Protected Areas (EPAs) are larger than strict PAs and sustainable use PAs. However, there is no difference in the sizes of strict PAs and sustainable use PAs. The subsequent panels show PA size distributions (hectares × 103) in the Caatinga ecoregion by jurisdiction (federal and state) and by protection type (strict protection, sustainable use and EPA).
Federal PAs have been created since 1946, with some periods of moderate increase in number, while the number of state PAs sharply increased from 1990 onwards (Fig. 4a). Proportionally, EPAs lead the Caatinga’s total PAs (Fig. 4b). From 1946 to 1991, most PAs created were federal (11 out of 17 PAs created) and under strict protection (7 out of these 11 PAs). During this time, 84% of the Caatinga PA area was federal. States created the majority of PAs between 1992 and 1999s (19 out of 25), but federal PAs created during this period comprised a larger proportional area (federal = 71%, state = 29%). The expansion of PA size during this period was mainly through EPAs (92%). From 2000 to 2021, many state strict PAs were created (31 out of 65 PAs created), although state EPAs were more representative in size (61% of total PAs; Fig. 4b).

Fig. 4. (a) Number and (b) proportion of protected areas by jurisdiction (federal and state) and protection type (strict protection, sustainable use and environmental protected area (EPA)) created through time in the Caatinga. Shaded areas separate the time intervals: 1946–1991, 1992–1999 and 2000–2021. Panel (b) represents the proportion of each protected area type in relation to the total protected area of the Caatinga.
Ceará, Rio Grande do Norte, Paraíba and Pernambuco are the states with the largest proportion of Caatinga (Fig. 2). Among them, Pernambuco has the largest area of Caatinga under state protection (7.9%), followed by Ceará (6.8%), while Rio Grande do Norte and Paraíba have the lowest proportions of Caatinga area inside PAs (0.8% and 1.1%, respectively). Alagoas and Sergipe are small states with slightly less than 50% of their territories in the Caatinga biome; they also present a minimal proportion of their Caatinga area under protection (1.0% in Alagoas and 0.6% in Sergipe). Bahia and Piauí, with slightly more than 50% of their areas inside the Caatinga, have the highest percentages of their Caatinga area under protection (12.3% and 11.4%, respectively). The states of Maranhão and Minas Gerais, with less than 2% of their total area in the Caatinga, protect 9.2% and 8.7% of their Caatinga areas, respectively (Fig. 2, Supplementary Fig. S1 & Supplementary Table S3). The states’ Caatinga areas are positively correlated with the proportion of EPAs in the total PAs (Supplementary Fig. S1d).
Discussion
The Caatinga is the largest continuous block of SDTFW biome in the Neotropics, and it also has the largest total area under protection. Proportionally, however, it is not the most protected STDFW in the Neotropics and, with its 5.85% of PA cover, it is far from reaching Aichi 2020 biodiversity targets (www.cbd.int/nbsap) or national targets such as the Comissão Nacional da Biodiversidade (CONABIO; National Commission on Biodiversity) goal of safeguarding at least 17% of the Caatinga by 2020 (CONABIO 2013). Furthermore, according to the official Brazilian database, 80% of the PA extent in Caatinga corresponds to the least restrictive protection type: the EPA category.
In addition, according to our analysis, all Neotropical SDTFWs are below the Aichi biodiversity goal to ‘improve the status of biodiversity by safeguarding ecosystems, species and genetic diversity’ (strategic goal C). As expected, smaller SDTFWs usually protect a relatively greater percentage of their total area, such as in the Caribbean, north-western South America and Inter-Andean dry valleys ecoregions. The Pacific South America ecoregion is an exception to this pattern because it is the smallest SDTFW and also presents the lowest PA cover; this raises even greater conservation concern for the region.
In the Caatinga, the federal government is still responsible for most of the PA creation and maintenance. The number of state PAs in Brazil began to surge in the late 1980s (Rylands & Brandon Reference Rylands and Brandon2005), including in the Caatinga. This rise was a consequence of the New Brazilian Federal Constitution of 1988, which decentralized natural resources management, enhancing the role of municipalities and states based on their local interests (Wever et al. Reference Wever, Glaser, Gorris and Ferrol-Schulte2012, Neves Reference Neves2016). However, federal PAs are larger than state PAs because they were created according to national conservation demands that surpass state and biome boundaries. Furthermore, most large federal PAs were created before 2000, when states’ investments in PAs were still incipient. Even so, states also increased the number and extent of PAs in the Caatinga over the last 18 years. Workshops to define priority areas for conservation, championed by the Ministry of the Environment in 2000, supported initiatives to create new PAs from 2000 onwards (Rylands & Brandon Reference Rylands and Brandon2005, Gouveia et al. Reference Gouveia, Ruiz-Esparza, Santana, Carlos, Oliveira, Bitencourti and Gomes2010). Nevertheless, one concern regarding the increase in the number and size of state PAs in the Caatinga is that, historically, states have reduced sizes, relaxed restrictions and sometimes even cancelled the decrees creating state PAs in the past, especially those with strict protection (Bernard et al. Reference Bernard, Penna and Araújo2014).
Although there are fewer federal EPAs than expected given the number of state EPAs, they are extensive and larger than strict PAs and other sustainable use PAs. Because this is the most permissive category of PA, this trend indicates that decisions at the state level reflect the interests of economic/extractivist sectors more than environmental protection (Wever et al. Reference Wever, Glaser, Gorris and Ferrol-Schulte2012, Vieira et al. Reference Vieira, Pressey and Loyola2019). EPAs have become the primary category option for decision-makers because, in addition to being one of the oldest categories of sustainable use, they allow land under private ownership within their limits, minimizing the risk of conflicts of interest with the local community (Sousa et al. Reference Sousa, Santos, Salgado, Araújo, Medeiros and Araújo2011). EPAs, for example, allow mining activities inside their boundaries, one of the most aggressive environmental threats in Brazil, which is expected to show a 10-fold increase over the coming years (Villen-Perez et al. Reference Villen-Perez, Mendes, Nobrega, Cortes and De Marco2018). In addition, Brazil is currently experiencing a crisis in its environmental policy (Magnusson et al. Reference Magnusson, Grelle, Marques, Rocha, Dias and Fontana2018, Thomaz et al. Reference Thomaz, Barbosa, Duarte and Panosso2020, Barbosa et al. Reference Barbosa, Alves and Grelle2021), and because even strict PAs are under threat (Silveira et al. Reference Silveira, Ferreira, Perillo, Carmo and Neves2018, Prasniewski et al. Reference Prasniewski, Szinwelski, Sobral-Souza, Kuczach, Brocardo, Sperber and Fearnside2020), EPAs are expected to guarantee even less effective protection.
States present fewer sustainable use PAs aside from EPAs. Sustainable use PAs have more management and human settlement restrictions, and areas in this category are generally created in response to local demands, covering smaller areas than EPAs. For example, traditional populations that rely on small-scale extractivist activities are targeted in the creation of Extractive or Sustainable Development Reserves, while National Forests or Fauna Reserves demand the expropriation of private lands within their limits (SNUC 2000).
In the first update report on priority areas for conservation of the Caatinga, Bahia, Ceará, Pernambuco and Piauí states harboured the most priority areas for conservation (MMA 2007). In recent years, these states have increased their PA networks, mainly through the creation of state strict PAs in Pernambuco and sustainable use PAs in the other states. Bahia, Ceará, Piauí and Pernambuco were later highlighted again for the number and extent of their very high priority areas for conservation (MMA 2016a). In 2018, the federal government created four news PAs in Bahia, making it the state with the highest percentage of its Caatinga under protection. We notice that even states with larger Caatinga areas have their PA systems biased towards EPAs (Supplemental Fig. S1d).
Alagoas, Sergipe, Paraíba and Rio Grande do Norte states show the least satisfactory results regarding conservation initiatives in the biome, even though Rio Grande do Norte and Paraíba have 94% and 91% of their territories in the Caatinga, respectively. This negligence is reflected in the priority areas for conservation, which indicates that Rio Grande do Norte and Paraíba have the highest number of very high priority areas for conservation (Gouveia et al. Reference Gouveia, Ruiz-Esparza, Santana, Carlos, Oliveira, Bitencourti and Gomes2010, MMA 2016a). The creation and consolidation of the state PA network are subject to the application of state public policies that emerge from the local conservation demands and interests of a region, which vary by PA type and jurisdiction (Rylands & Brandon Reference Rylands and Brandon2005), explaining the different scenarios found among states.
The ongoing trend of investment and expansion in the number and size of EPAs to the detriment of other PA categories and the inefficient implementation of EPAs are concerning issues for the future of PAs in the Caatinga. We found that states with greater extents of Caatinga have an even greater proportion of EPAs in their systems (Supplementary Fig. S1). These also include the most economically developed states in Caatinga (Bahia, Pernambuco and Ceará), which would have more potential to invest in strict PA creation. High population density, intense use of natural resources and the land tenure situation consolidated over centuries resulted in a challenging scenario for the creation of new strict PAs, which are proven to be more efficient in protecting ecosystem services when compared to sustainable use or unprotected areas (Terborgh et al. Reference Terborgh, Schaik, Davenport and Rao2002, Gouveia et al. Reference Gouveia, Ruiz-Esparza, Santana, Carlos, Oliveira, Bitencourti and Gomes2010, Salvatierra et al. Reference Salvatierra, Ladle, Barbosa, Correia and Malhado2017). At the same time, in the Caatinga, there are still large natural remnants (Antongiovanni et al. Reference Antongiovanni, Venticinque and Fonseca2018) under different regimes of chronic disturbance (Antongiovanni et al. Reference Antongiovanni, Venticinque, Matsumoto and Fonseca2020) that represent important opportunities for the creation of strict PAs and sustainable use PAs. Nevertheless, the creation of strict PAs demands substantial resources for land expropriation. Such areas are inevitably seen as obstacles to development because they may inhibit some economic activities within their areas and vicinities that involve the unregulated use of natural resources. Even so, although strict and sustainable use PA creation is more challenging than that for EPAs, their implementation should be prioritized if biodiversity conservation goals are to be met.
Conclusion
Given the depicted nature of PAs in the Caatinga, we recommend measures that might increase the protection of Caatinga biodiversity, including: (1) increased investment in projects that focus on conservation and sustainable use in the Caatinga and support the creation, expansion and management of PAs; (2) states being rewarded for acting on the recommendations of the priority areas for conservation report, elaborated by the Ministry of Environment, regarding the creation of new PAs; and (3) effective implementation and management of current PAs, especially EPAs.
Supplementary material
To view supplementary material for this article, please visit https://doi.org/10.1017/S0376892921000308.
Acknowledgements
We thank Rafael Laia and Adrian Garda for reading and commenting on this manuscript.
Financial support
This study was financed in part by the funding agency Coordenação de Aperfeiçoamento de Pessoal de Nível Superior – Brasil (CAPES) – Finance Code 001. This work was supported by CAPES under Master Scholarship for MGT; and the Brazilian Council for Scientific and Technological Development (CNPq) under Grant #308040/2017-1 for EMV.
Conflict of interest
The authors declare no competing interests in the conduct of this research.
Ethical standards
None.


