

INTRODUCTION
Both influenza and norovirus epidemics follow a seasonal trend: a susceptible cohort and an efficient means of virus transmission are necessary to cause an epidemic. Our earlier studies demonstrated that seasonal epidemics of influenza and norovirus have similar geographical diffusion over time [Reference Inaida1–Reference Inaida3]. The characteristics of the epidemics were spatially related: they were confined to relatively small areas, showed gradual variation from the core of the epidemic to the periphery, and generated epidemic clusters. In some areas, the epidemic clusters were not affected by demographic variables alone, such as population density or family size, which is thought to play a key role in propagating viral transmission. This suggests the possibility of other environmental factors with a sustained effect on immunity, such as soil radiation.
Soil radiation is a major cause of environmental radiation and is thought to have a destructive effect on the human immunocycle through internal irradiation [Reference Shahid4, Reference Shahid5]. Previous studies suggested that irradiation resulted in a variety of haematopoietic disorders, such as abnormality of immunoglobulin or T-cell populations, mutated human cell-related components such as interferon, and adverse effects on gene transcription and DNA, with potential damage caused to bone marrow and thymus [Reference Shahid4–Reference Jahns21]. These haematopoietic functions and systems consist of the immunity-generating components, hence one of the effects of irradiation is thought to be a reduced level of immunity. Such results were observed for residents who were exposed to low-dose background radiation from the soil and workers at nuclear power plants or other occupational sites with radiation exposure, as well as survivors from the atomic bombings in Hiroshima and Nagasaki. However, the effect of irradiation on health outcomes, including immune dysfunction, remains unclear [Reference McMahon22–Reference Daniak24].
In this study, we conducted an exploratory study on the immunity impact of soil radiation by examining the relationship between the epidemics of infectious diseases and soil radiation level in Japan. We investigated an increase in the incidence rate of influenza and norovirus infection, as a susceptibility or immunity index, and we compared these incidence rates with the irradiation level from soil radiation by calculating a correlation. This study was intended to generate hypotheses about the health effects of soil radiation. For matching the incidence rates and soil radiation data, we used spatial overlay analysis using the geographical information system (GIS, ArcGIS 9.3v ESRI). Data on the incidence of infectious diseases were sourced from the National Epidemiological Surveillance of Infectious Diseases (NESID) [1] and soil sample data of uranium (U), thorium (Th), and potassium oxide (K2O) used for estimating the gamma irradiation level [Reference Beck25] were obtained from the website of the Geological Society of Japan.
METHODS
Sentinel surveillance data
We assessed sentinel surveillance data on individuals aged <20 years from the NESID during the last three epidemic influenza (2006–2007, 2007–2008, 2009–2010) and norovirus (2006–2007, 2007–2008, 2008–2009) seasons, whose epidemics recur with a considerable number of cases every year. Of note, the 2006–2007 norovirus season, which was the largest epidemic of the disease in the history of national surveillance, has been attributed to the emergence of a new GII.4 variant [Reference Inaida2, Reference Inaida3]. In addition, the 2009–2010 influenza season was a pandemic season in Japan. These epidemic seasons were included in this study to observe the effect of the emergence of new virus variants. For influenza, the 2006–2007 epidemic season was caused mainly by type B and subtype H3, and the 2007–2008 season was caused mainly by subtype H1. The 2008–2009 season, was the same as the previous season and continued to have subtype H1 as the predominant epidemic virus type, and the 2009–2010 season that had a lower incidence of norovirus were not included [26, Reference Inaida27]. For norovirus, the 2007–2008 season was caused by a predominant GII.4 variant [Reference Motomura28].
The number of sentinel sites included about 5000 small- to medium-sized clinics. Influenza data (on influenza-like illnesses) were gathered at 2000 adult clinics and 3000 paediatric clinics. Norovirus data (i.e. gastroenteritis cases) were collected at about 3000 small- to medium-sized paediatric clinics. Of note, 3000 of the sentinel site paediatric clinics monitored both influenza and norovirus cases, and as such, the majority of data pertained to children aged <15 years. The number of sentinel sites was based on the catchment population of the administrative sector to which the respective health centres belonged. Selection of sentinel sites is randomly decided by the local health centres. To indicate the population background for sentinel sites, the number of population aged <20 years was extracted for a 1-km radius of each sentinel through GIS using 2005 national census data.
Each sentinel clinic reported weekly the number of influenza cases to the prefectural heath institutes through regional health centres. Diagnosis was made based on the presence of four major symptoms (high fever, sudden outbreak of illness, upper respiratory inflammation, and whole body symptoms such as general malaise), and a rapid influenza testing kit was also frequently used to confirm the diagnosis. Gastroenteritis cases were reported weekly from each sentinel clinic based on the symptoms of diarrhoea, vomiting, and acute abdominal pain. Although this surveillance includes other causes of gastroenteritis such as bacterial or other viral causes, norovirus epidemics were also monitored by laboratory confirmation. The laboratory testing is conducted for about 10% of all cases through reverse transcription–polymerase chain reaction (RT–PCR) testing (at the laboratories of the prefectural health institutes). All these data include both sporadic cases and outbreaks. The full flow of surveillance data and the reporting system have been described in previous studies [Reference Taniguchi29]. The significant difference of sentinel data was examined according to the Friedman test, i.e. a non-parametric test comparing observed datasets over time and their P value (at significance level P < 0·01) examines a null hypothesis that the sampled data are identical for the different times when the data were collected [Reference Michael30]. This test was conducted using SPSS v. 21 (IBM Corp., USA) for each of the three seasons.
Incidence rate
We determined the population standard size for each sentinel site by calculating the population per clinic using the total population and the total number of clinics at the prefectural level. This was calculated for adjusting the population base level per clinic in prefectures. These data were obtained from online open sources based on surveys of medical institutions conducted by the Ministry of Health, Labour, and Welfare [31]. Subsequently, the incidence rates for the total number of incident cases [Reference Inaida1, Reference Inaida3] reported by a sentinel site were calculated against the prefectural population standard (hereinafter, the ‘incidence’) and taken into account for each of the three seasons to give a relative epidemic level. The calculation of incidence for influenza was conducted for the period of epidemic defined by the threshold of more than one incidence case per sentinel. For norovirus, the period of epidemic is defined from the 36th and 52nd epidemiological weeks of gastroenteritis cases, based on the pathogenic detection over a decade [Reference Inaida3]. Then correlations of the incidences between the seasons were assessed using SPSS.
Correlation between incidence and soil radiation dose
The Kriging (ordinary kriging) interpolation method available in GIS Spatial Analyst enabled conversion of point-based data to surface data, and the epidemic cluster was depicted using the incidence for each of the three seasons (at 5-km grid cell size). Feature of spread of incidence was compared to background gamma radiation calculated according to observations of three radioactive components in the soil samples: uranium (U), thorium (Th), and potassium oxide (K2O) whose data are available at the website of the Geological Society of Japan [32]. The soil samples were collected from over 3000 sites (between 1999 and 2003) and these elements were extracted with 0·1 n HCl from the soil samples. The corresponding data were accessed online at the website of the Geological Society of Japan. The absorbed dose of d (μGy/h) was calculated using D −3 = 13·0 CK2O (%) + 5·4 CU (ppm) + 2·7 CTh (ppm) to estimate the dose of gamma irradiation at a height of 1 m from the ground [32, Reference Minato33] and was depicted on a map according to the interpolation (natural neighbour) method (at 1-km grid cell size) available in GIS Spatial Analyst. Natural neighbour is the method used to geographically calculate a subset of obtained samples to a query point and then weights them to fill a value to interpolate and is often used to map distribution of soil parameters [Reference Watson34, Reference Sarmah35].
The mean absorbed dose dm was calculated from the interpolated soil radiation using a 1-km radius for each sentinel site in GIS. The average of the incidence for each radiation dose in units of 0·01 μGy/h for each of the three seasons was calculated. Then, the moving averages of the incidences (using seven incidence values, including three values above and below each dose, in units rounded to 0·01 μGy/h) and associated 95% confidence intervals (CIs) were calculated between 0 < dm ⩽ 0·15 μGy/h; the correlations between these values and the radiation dose were then assessed for both diseases in each of the three seasons. These calculations were conducted with SPSS.
RESULTS
Distribution of incidence and soil radiation
The areas with higher soil radiation tended to be located in the west of the country (Fig. 1a ). For both influenza and norovirus infections, the Friedman test revealed a significant difference in sentinel data (P < 0·001) in all observed seasons. The spread of the incidences for both influenza and norovirus infections exhibited a similar pattern over the three seasons (maps of the 2006–2007 influenza and norovirus seasons are shown in Fig. 1b, c ), and the mean correlation coefficients between the first season and the following two seasons were significantly high for influenza (0·75, P < 0·01) and norovirus (0·90, P < 0·01) infections. In areas with relatively higher soil radiation, there was an increased likelihood of epidemic clusters (spots of relatively higher incidence), although the number of incidences varied between different areas (Fig. 1).
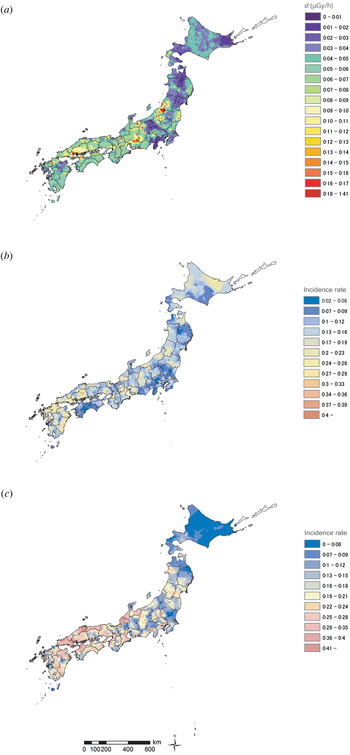
Fig. 1. Epidemic of infectious diseases and soil radiation in Japan. (a) Distribution of background gamma radiation d (μGy/h) calculated from data of three radioactive components observed in soil samples (which were collected between 1999 and 2003), including uranium (U), thorium (Th), and potassium oxide (K2O), using D −3 = 13·0 CK2O (%) + 5·4 CU (ppm) + 2·7 CTh (ppm) to estimate the dose at a height of 1 m from the ground. (b) Spread of incidence rate of influenza (2006–2007 season). (c) Spread of incidence rate of norovirus (2006–2007 season). Panels (b) and (c) were depicted using the incidence against the prefectural population standard size at each sentinel site. For panel (c) the incidence rate of each sentinel site in the Kyushu area, where increased epidemic levels were observed compared to other areas, was adjusted (at minus 0·1) in order to provide an overview.
Most sentinel sites for both influenza and norovirus were located in areas with exposure to the dose intervals of radiation of 0 < dm ⩽ 0·15 μGy/h, with the majority of sentinel sites having an exposure of 0 < dm < 0·06 μGy/h (Table 1). The population size (aged <20 years) within a 1-km radius of each sentinel site showed relatively similar distribution over dose.
Table 1. The distribution of the number of sentinel sites by dose of soil radiation and average of population aged <20 years (for 1-km radius of each sentinel site)
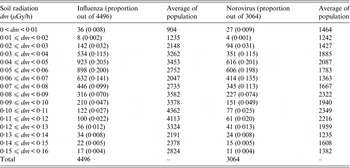
Dose of soil radiation was calculated from data of three radioactive components observed in soil samples which were collected between 1999 and 2003 in Japan. A small number of sentinel sites located in areas with radiation exposure dose 0·16 ⩽ dm μGy/h, were excluded from this study.
Population (national census data of 2005) was extracted by 1-km radius for each sentinel site.
Correlation between incidence and radiation exposure dose
Across the analysed seasons, there was a gradual increase in the incidences associated with higher radiation doses (Table 2, Fig. 2). There were also some fluctuations in incidences. For example, the baseline incidence (which was the incidence at 0 < dm < 0·01 μGy/h) was higher in the 2009–2010 influenza season and the 2006–2007 norovirus season, which were both large outbreak seasons for each disease. With respect to the average incidences for the three seasons, the incidence for influenza infection was 1·80 (95% CI 1·47–2·12) times higher and that for norovirus infection was 2·07 (95% CI 1·53–2·61) times higher in areas with soil radiation doses of 0·15 ≤ dm < 0·16 μGy/h compared to that in areas with the lowest doses of 0 < dm < 0·01 μGy/h.
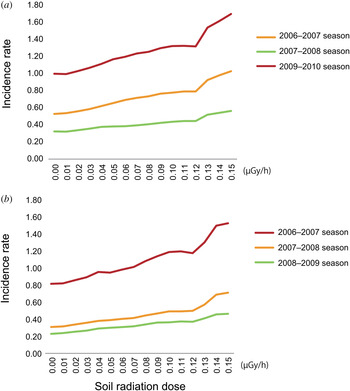
Fig. 2. Incidence rate and soil radiation dose in Japan. Changes in the moving averages of the incidence rates (calculated using seven values for the incidence rate, including three values above and below each dose, rounded to 0·01 μGy/h) for each of the three epidemic seasons for influenza and norovirus (i.e. the fluctuation in the average of the incidence rate at 0·03 μGy/h was calculated by taking the average of the incidence rate between 0 μGy/h (rounded to 0 < dm < 0·005) and 0·06 μGy/h (rounded to 0·055 ⩽ dm < 0·065) based on the radiation dose data (calculated from data of three radioactive components observed in soil samples which were collected between 1999 and 2003) in Figure 1a The value for the highest dose, 0·15 μGy/h, was calculated by averaging the incidence rates between 0·12 and 0·17 μGy/h due to the limitation of obtaining data over 0.15 μGy/h. The data with 95% confidence intervals are shown in Table 2.
Table 2. Moving average of incidence rate (95% confidence interval)

Finally, the correlation between the fluctuation in the average of the incidences for influenza and norovirus infection and the soil radiation dose was significantly positive for all three seasons (Fig. 2, Table 3).
Table 3. Correlation between incidence rates for influenza and norovirus infection and soil radiation
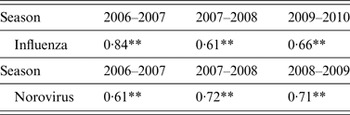
** P < 0·01
Pearson's correlation coefficients are shown for the fluctuating averages of the incidence rates for each dose (rounded to units of 0·01 μGy/h) of soil radiation (<0·15 μGy/h) in Japan.
DISCUSSION
The distribution of higher incidences of epidemics of influenza and norovirus appeared to be geographically similar, and significantly positive correlations were found between the incidence of the first season and that of the following two seasons. The epidemic clusters tended to appear in areas with relatively higher soil radiation doses, and there was a positive correlation between incidence and soil radiation in all observed seasons. These results indicate a dose-dependent effect of radiation on incidence and suggest that irradiation may potentially have an impact on immunity. Our data and study design are based on observations for geographically matching these viral infection rates and irradiation doses from the soil radiation across the country; there is also a limitation in consideration of other confounding circumstances. A further study is needed to consider these trends and the immunity impact of soil radiation.
Most epidemiological studies concerning the health effects of exposure to low-dose radiation have focused on cancer [Reference Ujeno36–Reference Brenner39]. The few studies that have considered the immunity impact of soil radiation show that a mutation of the human interferon α-2b gene accompanied with lower blood counts (i.e. white blood cells, mean corpuscular haemoglobin) was observed in individuals in irradiation areas with low-dose uranium, or in medical workers who were chronically exposed to radiation in Pakistan; this can be interpreted as a decrease in both anti-tumoural and antiviral immunity [Reference Shahid4, Reference Shahid5]. The other few studies that have considered infectious diseases in this context have reported an increase in the incidence of, or the death from infectious diseases, associated with low-dose radiation exposure [Reference Stewart10–Reference Stewart13, Reference Hodge40]. Some of other studies have also suggested an effect on immunity from haematopoietic disorders caused by irradiation [Reference Amagi6–Reference Sajjadieh9, Reference Kusunoki15]. The data framework and cohort were different in these studies, i.e. some were residents in higher dose areas and others were victims of the atomic bombs detonated in Hiroshima and Nagasaki, making it difficult to directly compare the results. However, they do provide a possible mechanism for the decline in immunity caused by exposure to low-dose radiation and, potentially, the subsequent increase in infections. Although it is likely that an immunity decrease can result in overall disease susceptibility, further studies are needed to consider immunity and susceptibility to these particular viral infections.
Soil radiation may cause internal contamination through the respiratory and digestive tracts via airborne transmission [Reference Barcinski41]. Our results demonstrated fluctuations in incidences correlated with radiation dose, i.e. differences in the rate of increase in the analysed seasons, suggesting that the incidence may also be affected by virus type. In correlations between the first season and the following two seasons, higher coefficients were found for norovirus infections than for influenza infections. This suggests that there is a greater tendency for norovirus infection to geographically recur over time, and likewise more susceptibility remains for norovirus infections than for influenza infections. Moreover, between lower and higher soil radiation doses there was a larger increase in incidences of norovirus infection compared to influenza, thus suggesting a potentially stronger effect of radiation on susceptibility to norovirus infection. The reason for this is not clear. However, earlier studies have reported that the stomach and intestinal tract, where norovirus is thought to multiply, are particularly sensitive to radiation [Reference François42–Reference Coia44]. One study has suggested that irritable bowel syndrome in children living in a radiation-contaminated area in Ukraine is potentially due to the irradiation effect on the T lymphocyte population; however, this was not compared with the impact on other internal tracts, or other diseases [Reference Sajjadieh7]. In addition, people tended to remain susceptible to norovirus infection over time as acquired immunity to norovirus is short-term [Reference Siebenga45]; therefore, any effect on the increasing incidence could be more noticeable compared to influenza infections [Reference Reber46]. Either way, the increasing incidence could be a sign of decreased immunity, potentially from irradiation doses as low as 0·15 μGy/h.
The length of exposure to radiation is known to be an important factor that affects immunity [Reference Gricienė20]. According to a previous study, the majority of norovirus cases consisted of children aged 0–4 years [Reference Inaida3]. This may imply that radiation exposure of any duration before age 4 years could affect immunity. The current data pertained mainly to patients aged <15 years; therefore, the data does not allow for possible assessment of longer term effects. The most of sentinel sites were located in areas with radiation doses of <0·15 μGy/h, which equals 1·3 (mGy) a year in cases of sustained exposure to radiation for 24 h a day. Meanwhile, previous studies have indicated that the effects of radiation could vary by individuals, although the mechanism involved is not well understood [Reference Bauman17, Reference Pohl-Rüling19]. Long-term observation studies are needed to fully evaluate the effect of radiation on immunity and overall health [Reference Shahid4–Reference Wuttke16, Reference McMahon22–Reference Daniak24, Reference Gloag47, Reference Land48].
Only a small number of the sentinel sites included in our study recorded soil radiation exposure in doses >0·15 μGy/h. Thus, our study is limited in its ability to make analysis regarding epidemic trends beyond that dose. Further, the data used in this study excluded other environmental data as well as background radiation from other terrestrial sources of radiation.
Although population size alone did not seem to be an epidemic factor, a demographic composition that includes a younger cohort may affect the spread of an epidemic [Reference Inaida1, Reference Inaida3]. The current study included incidence in individuals aged <20 years and there was no irregular conjunction of population aged <20 years for higher irradiation dose areas, which could have introduced potential bias by increasing the incidence in such areas. However, further studies regarding the epidemic trend according to age and sex are warranted. Additionally, the total number of clinics serving the total population in each area could affect the incidence, while our study was limited to calculations at the prefectural level. Influenza testing kits were mostly used to diagnose influenza infections and RT–PCR assays were conducted for specimens for 10% of norovirus infections; however, as the data were collected voluntarily by the physicians at sentinel sites, there could be a diagnostic bias. In Japan, a similar medical service with a universal medical insurance system is provided across the country; however, in rural areas where there are fewer residents than in metropolitan areas, the residential area of patients attending the same clinic may be larger than the 1-km radius that we have used to calculate soil radiation for each sentinel clinic.
Although epidemic prevalence can be compared between epidemic clusters and smaller epidemic areas, the higher incidences tended to be located in less populated areas. As expected, in less populated areas, the population size for each sentinel site, which is a statistical parameter to calculate prevalence, is smaller than that in the populated core areas. Thus, the epidemic prevalence, i.e. the rate of incidence in relation to the population size for each sentinel site, in those less populated areas will be greater than that in populated core areas. The examination of prevalence between each epidemic cluster area and smaller epidemic areas would be desirable in a further study. We conducted this study to generate hypotheses of the effect of soil radiation on immunity; as such, the results should be interpreted with caution, and more studies are needed to test these hypotheses. Other potential causative factors such as differences in medical services or socioeconomic settings over areas, or an ecological fallacy, also require examination.
Although data on epidemics of influenza and norovirus could potentially be affected by other confounding factors, such as type-specific susceptibility to the virus and vaccination status (for influenza), the infections appeared to be clustered in similar geographical areas, suggesting further studies on immunity and associated factors in these epidemic areas are warranted.
ACKNOWLEDGEMENTS
This research received no specific grant from any funding agency, commercial or not-for-profit sectors.
DECLARATION OF INTEREST
None.


